| Param | Original file | Final file |
|---|---|---|
| Filename | modeM0/AS1A12_029T02_9000005590_41042cztM0_level2.fits | modeM0/AS1A12_029T02_9000005590_41042cztM0_level2_quad_clean.evt |
| Size (bytes) | 300,824,640 | 87,606,720 |
| Size | 286.9 MB | 83.5 MB |
| Events in quadrant A | 2,701,079 | 594,546 |
| Events in quadrant B | 2,241,275 | 609,684 |
| Events in quadrant C | 2,796,007 | 576,848 |
| Events in quadrant D | 3,000,644 | 515,554 |
| Mode SS | |||
|---|---|---|---|
| Quadrant | BADHDUFLAG | Total packets | Discarded packets |
| A | 0 | 106 | 0 |
| B | 0 | 106 | 0 |
| C | 0 | 106 | 0 |
| D | 0 | 106 | 0 |
| Mode M0 | |||
|---|---|---|---|
| Quadrant | BADHDUFLAG | Total packets | Discarded packets |
| A | 0 | 11198 | 3 |
| B | 0 | 10215 | 2 |
| C | 0 | 11414 | 2 |
| D | 0 | 12547 | 2 |
| Mode M9 | |||
|---|---|---|---|
| Quadrant | BADHDUFLAG | Total packets | Discarded packets |
| A | 0 | 42 | 0 |
| B | 0 | 42 | 0 |
| C | 0 | 42 | 0 |
| D | 0 | 42 | 0 |
| Quadrant | Total seconds | Saturated seconds | Saturation percentage |
|---|---|---|---|
| A | 5083 | 10 | 0.196734% |
| B | 5083 | 3 | 0.059020% |
| C | 5083 | 106 | 2.085383% |
| D | 5083 | 244 | 4.800315% |
Noise dominated data is calculated using 1-second bins in cleaned event files. If a bin has >2000 counts, and if more than 50% of those come from <1% of pixels, then it is considered to be noise-dominated and hence unusable.
| Quadrant | # 1 sec bins | Bins with >0 counts | Bins with >2000 counts | High rate bins dominated by noise | Noise dominated (total time) | Noise dominated (detector-on time) | Marked lightcurve |
|---|---|---|---|---|---|---|---|
| A | 9328 | 5085 | 4 | 4 | 0.04% | 0.08% | 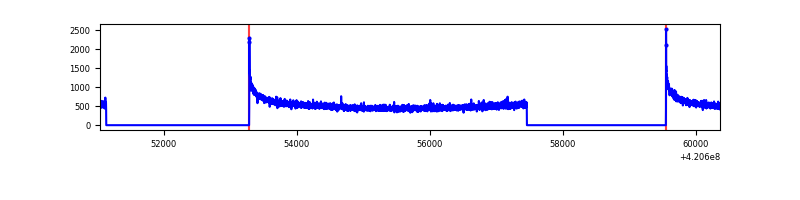 |
| B | 9328 | 5085 | 0 | 0 | 0.00% | 0.00% | 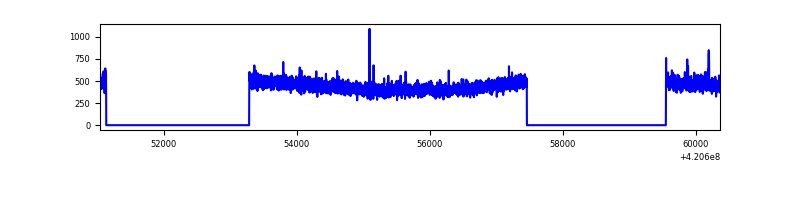 |
| C | 9328 | 5085 | 87 | 87 | 0.93% | 1.71% | 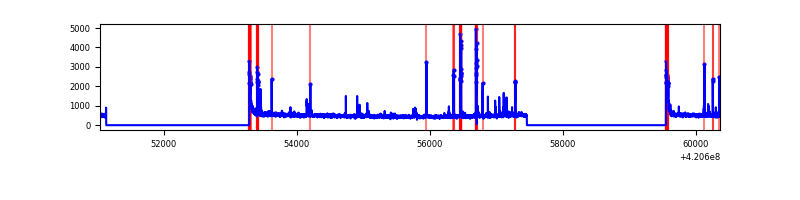 |
| D | 9328 | 5085 | 195 | 195 | 2.09% | 3.83% | 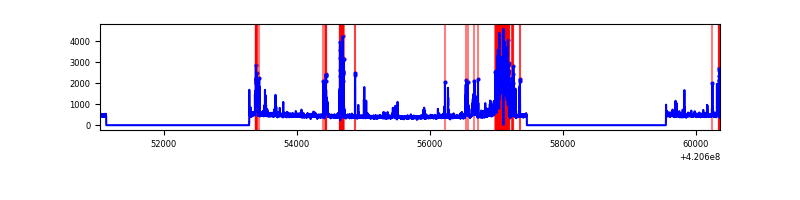 |
Top three noisy pixels from each quadrant. If the there are fewer than three noisy pixels in the level2.evt file, extra rows are filled as -1
| Pixel properties | Quadrant properties | ||||||
|---|---|---|---|---|---|---|---|
| Quadrant | DetID | PixID | Counts | Sigma | Mean | Median | Sigma |
| A | 10 | 83 | 490335 | 4223.87 | 567 | 557 | 116.0 |
| A | 13 | 254 | 9337 | 75.72 | 567 | 557 | 116.0 |
| A | 12 | 189 | 7938 | 63.65 | 567 | 557 | 116.0 |
| B | 12 | 111 | 13609 | 119.24 | 567 | 552 | 109.5 |
| B | 11 | 111 | 12731 | 111.23 | 567 | 552 | 109.5 |
| B | 14 | 111 | 12301 | 107.3 | 567 | 552 | 109.5 |
| C | 15 | 214 | 216857 | 1654.23 | 560 | 563 | 130.8 |
| C | 14 | 254 | 206831 | 1577.55 | 560 | 563 | 130.8 |
| C | 0 | 10 | 134612 | 1025.21 | 560 | 563 | 130.8 |
| D | 2 | 249 | 497863 | 3743.06 | 544 | 529 | 132.9 |
| D | 13 | 249 | 168927 | 1267.41 | 544 | 529 | 132.9 |
| D | 13 | 171 | 123997 | 929.25 | 544 | 529 | 132.9 |
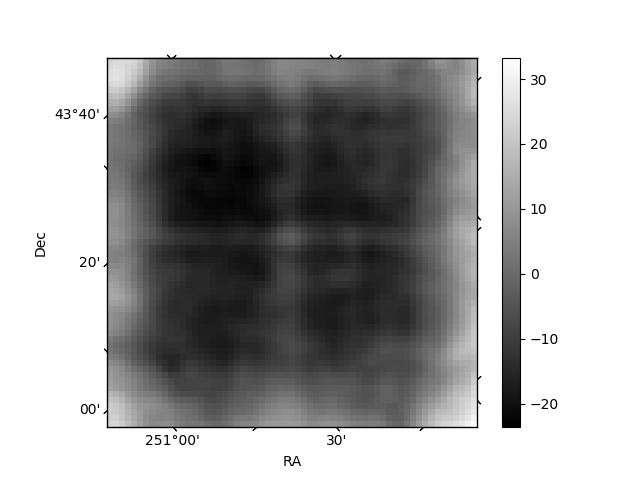
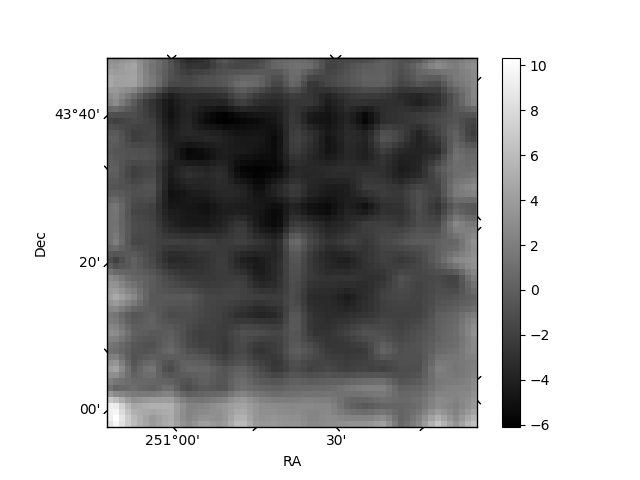
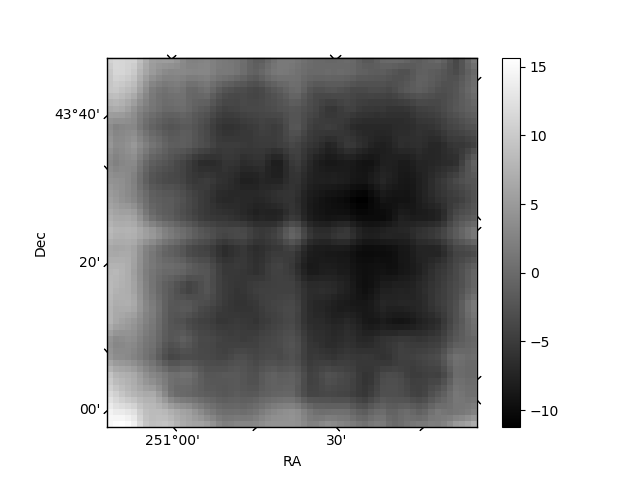
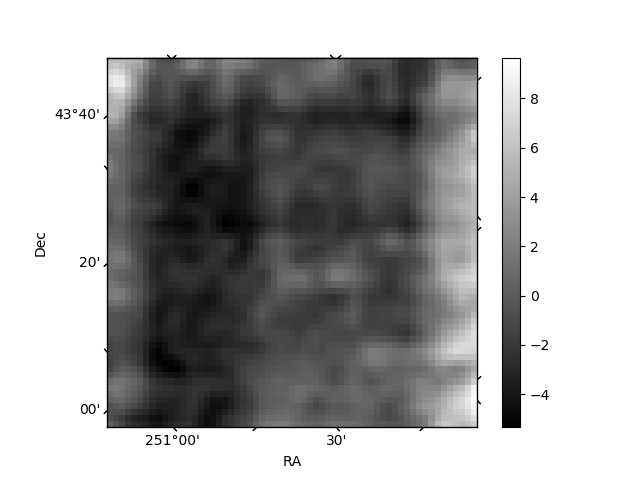
Histogram calculated using DETX and DETY for each event in the final _common_clean file
| Quadrant A | 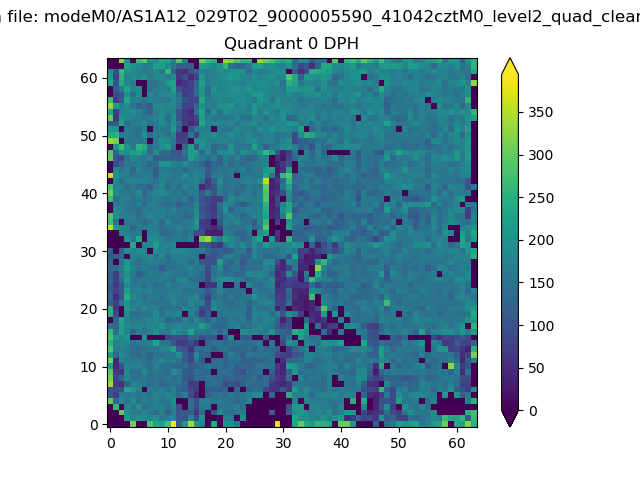 |
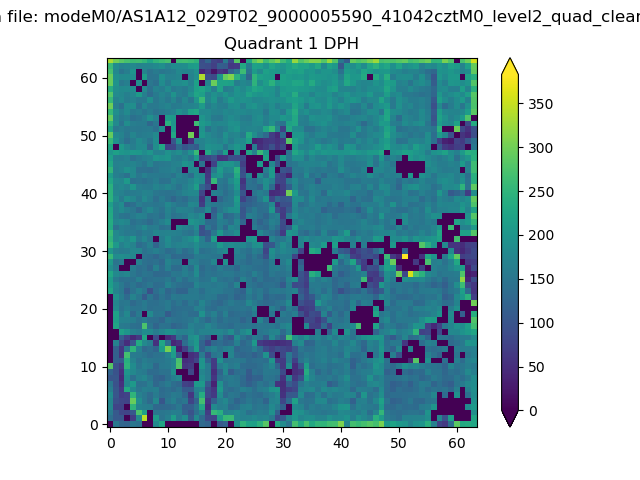 |
Quadrant B |
|---|---|---|---|
| Quadrant D | 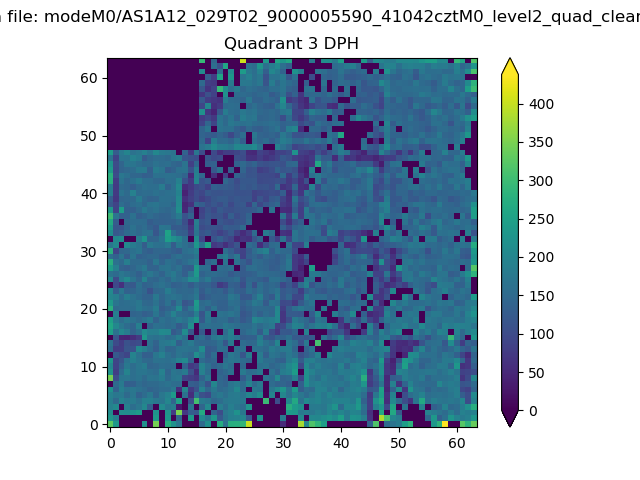 |
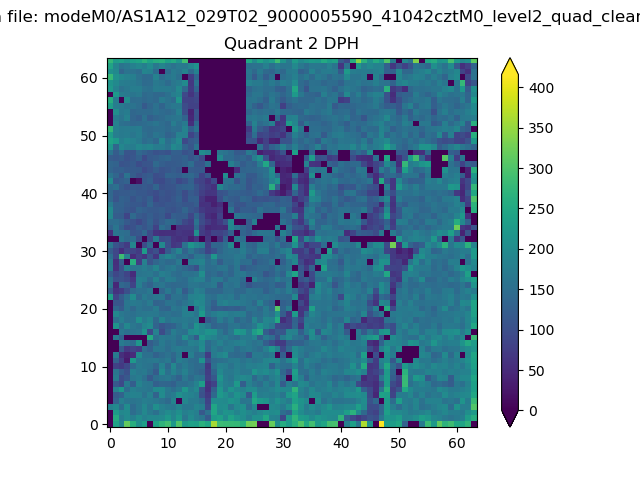 |
Quadrant C |
| Plot type | Count rate plots | Images |
|---|---|---|
| Comparison with Poisson distribution Blue bars denote a histogram of data divided into 1 sec bins. Red curve is a Poisson curve with rate = median count rate of data. |
 |
 |
| Quadrant-wise count rates Data is divided into 100 sec bins |
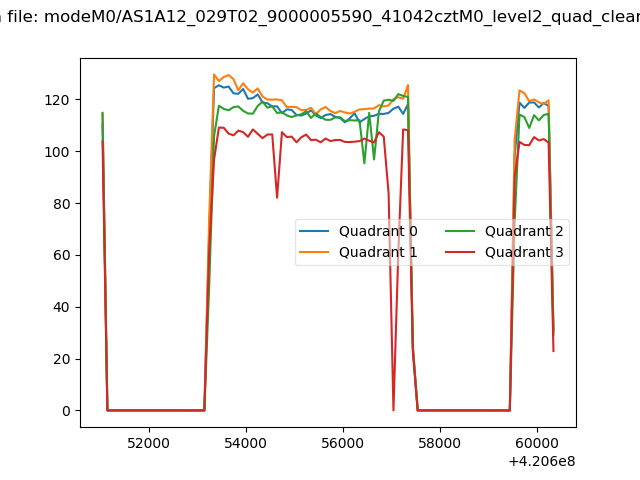 |
|
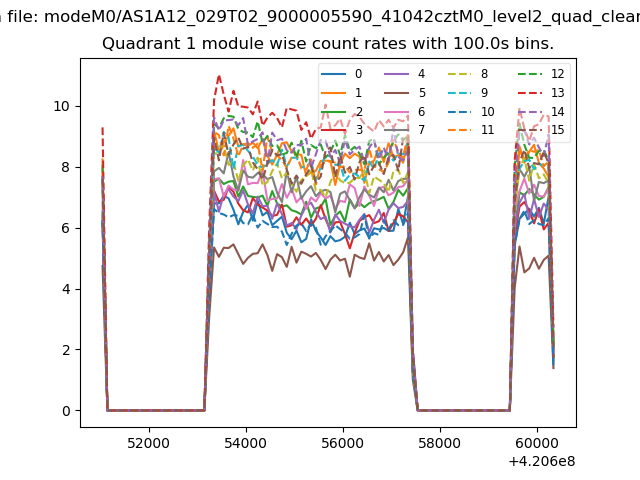
| Module-wise count rates for Quadrant A Data is divided into 100 sec bins |
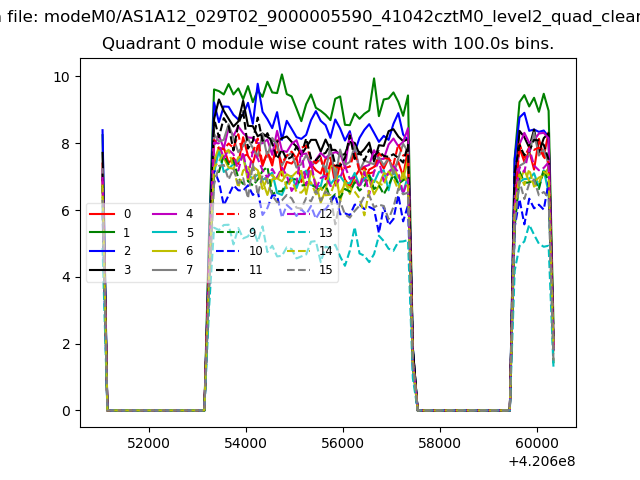 |
 |
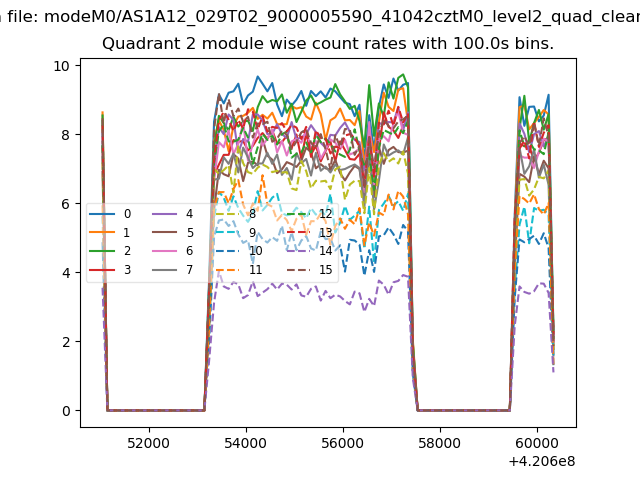
| Module-wise count rates for Quadrant B Data is divided into 100 sec bins |
 |
 |
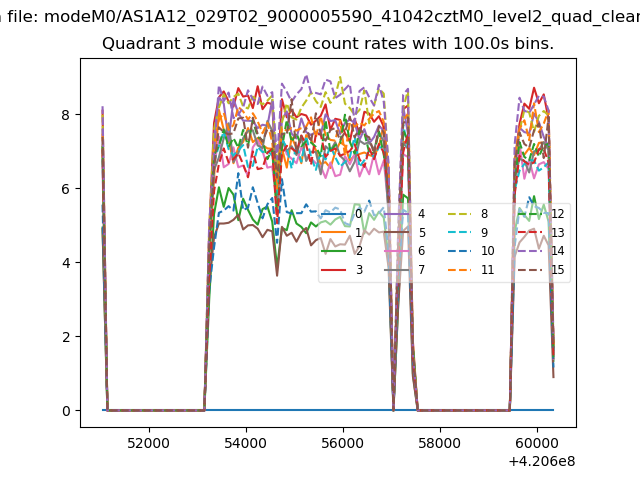
| Module-wise count rates for Quadrant C Data is divided into 100 sec bins |
 |
 |
| Module-wise count rates for Quadrant D Data is divided into 100 sec bins |
 |
 |
| Parameter | Plot |
|---|---|
| CZT HV Monitor | 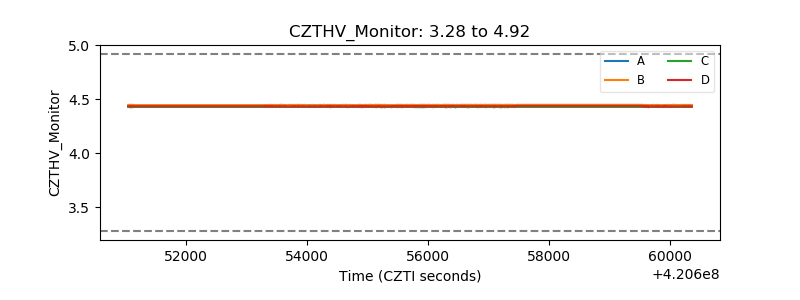 |
| D_VDD | 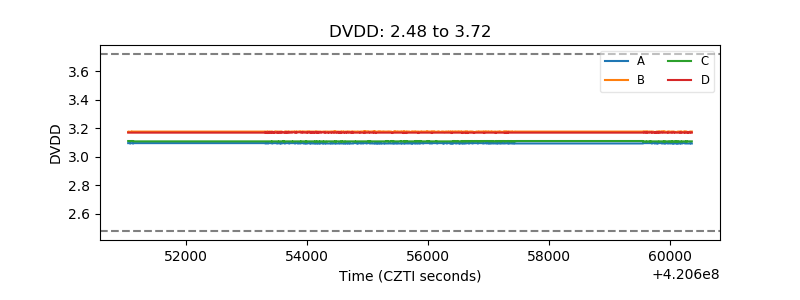 |
| Temperature 1 | 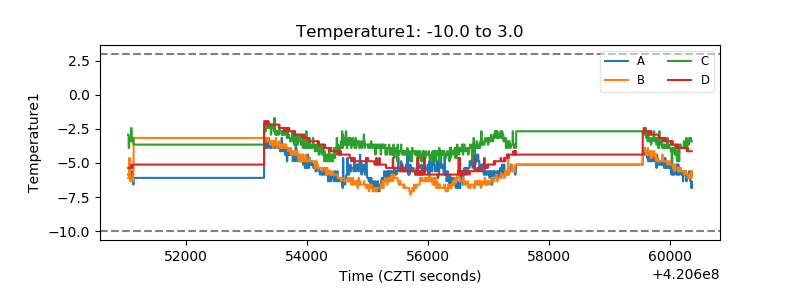 |
| Veto HV Monitor |  |
| Veto LLD | 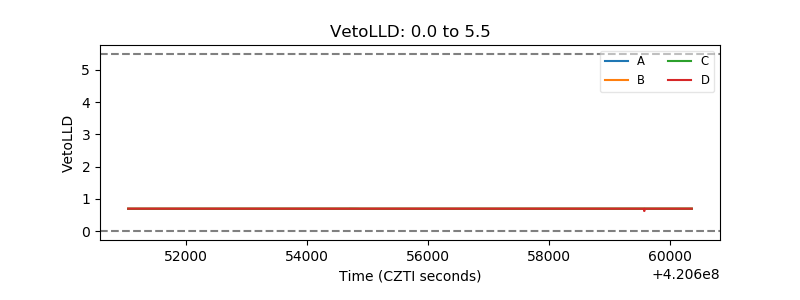 |
| Alpha Counter | 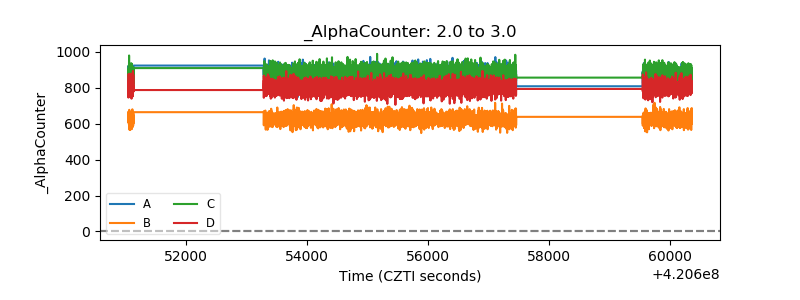 |
| _CPM_Rate | 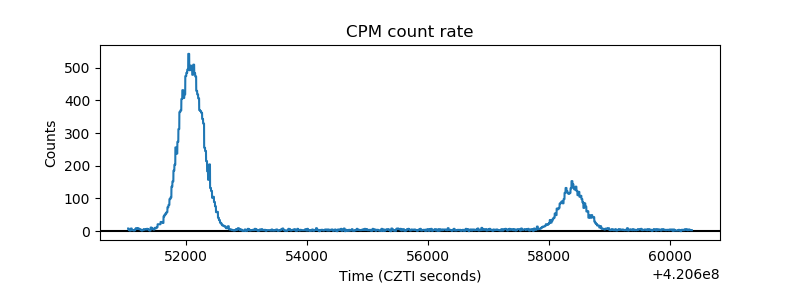 |
| CZT Counter | 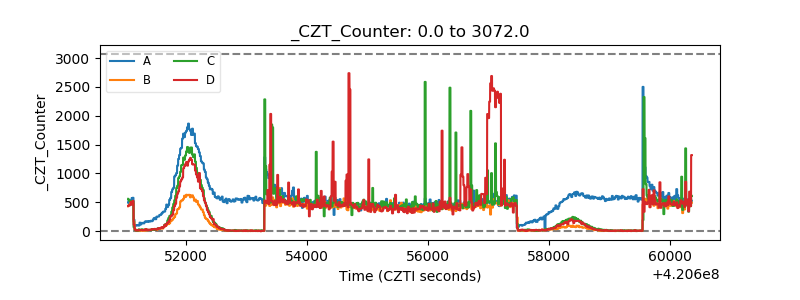 |
| +2.5 Volts monitor |  |
| +5 Volts monitor | 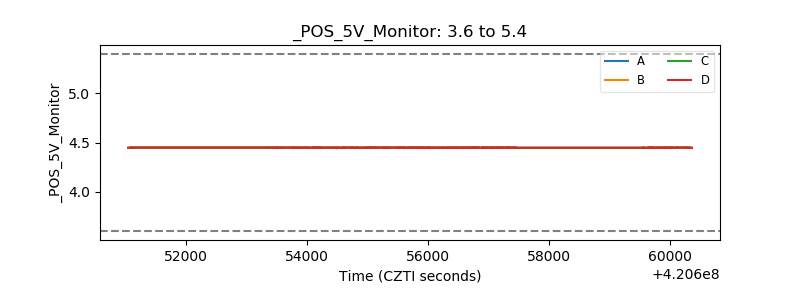 |
| _ROLL_ROT | 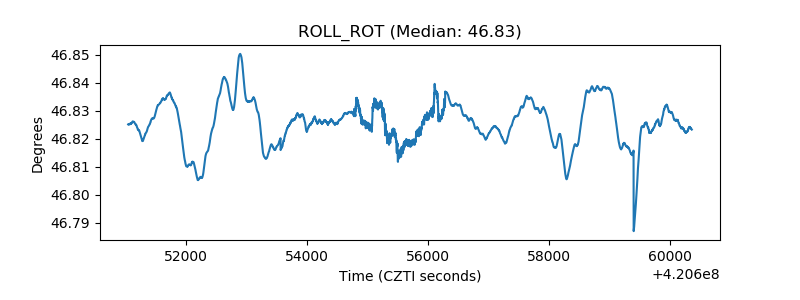 |
| _Roll_DEC |  |
| _Roll_RA | 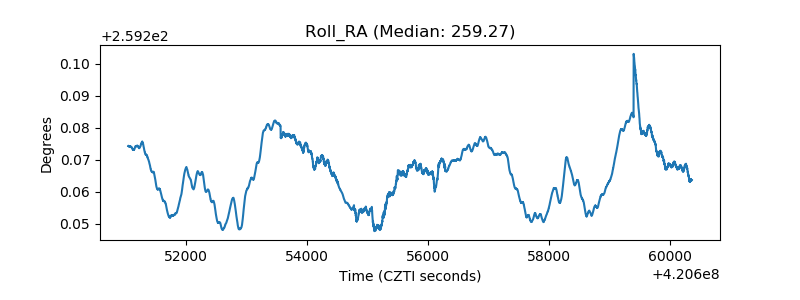 |
| Veto Counter | 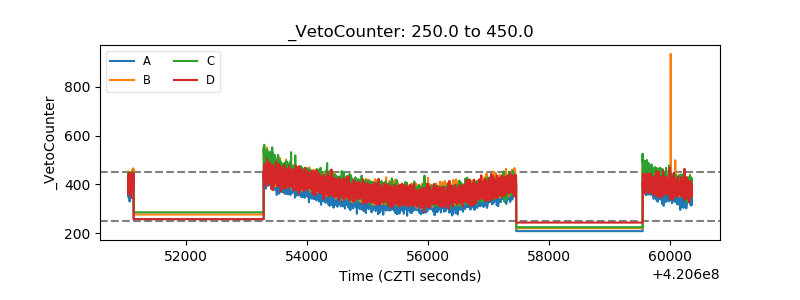 |