| Param | Original file | Final file |
|---|---|---|
| Filename | modeM0/AS1A12_029T02_9000005590_41043cztM0_level2.fits | modeM0/AS1A12_029T02_9000005590_41043cztM0_level2_quad_clean.evt |
| Size (bytes) | 296,038,080 | 88,698,240 |
| Size | 282.3 MB | 84.6 MB |
| Events in quadrant A | 2,745,498 | 592,943 |
| Events in quadrant B | 2,268,988 | 606,652 |
| Events in quadrant C | 2,863,062 | 581,716 |
| Events in quadrant D | 2,669,100 | 534,792 |
| Mode SS | |||
|---|---|---|---|
| Quadrant | BADHDUFLAG | Total packets | Discarded packets |
| A | 0 | 108 | 0 |
| B | 0 | 108 | 0 |
| C | 0 | 108 | 0 |
| D | 0 | 108 | 0 |
| Mode M0 | |||
|---|---|---|---|
| Quadrant | BADHDUFLAG | Total packets | Discarded packets |
| A | 0 | 11467 | 3 |
| B | 0 | 10592 | 2 |
| C | 0 | 11865 | 2 |
| D | 0 | 11754 | 2 |
| Mode M9 | |||
|---|---|---|---|
| Quadrant | BADHDUFLAG | Total packets | Discarded packets |
| A | 0 | 31 | 0 |
| B | 0 | 31 | 0 |
| C | 0 | 31 | 0 |
| D | 0 | 32 | 0 |
| Quadrant | Total seconds | Saturated seconds | Saturation percentage |
|---|---|---|---|
| A | 5278 | 12 | 0.227359% |
| B | 5278 | 4 | 0.075786% |
| C | 5278 | 97 | 1.837817% |
| D | 5278 | 81 | 1.534672% |
Noise dominated data is calculated using 1-second bins in cleaned event files. If a bin has >2000 counts, and if more than 50% of those come from <1% of pixels, then it is considered to be noise-dominated and hence unusable.
| Quadrant | # 1 sec bins | Bins with >0 counts | Bins with >2000 counts | High rate bins dominated by noise | Noise dominated (total time) | Noise dominated (detector-on time) | Marked lightcurve |
|---|---|---|---|---|---|---|---|
| A | 7100 | 5279 | 3 | 3 | 0.04% | 0.06% | 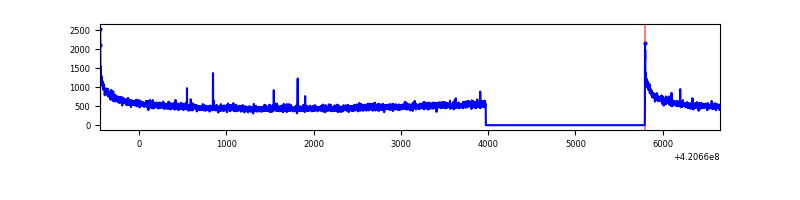 |
| B | 7100 | 5279 | 0 | 0 | 0.00% | 0.00% | 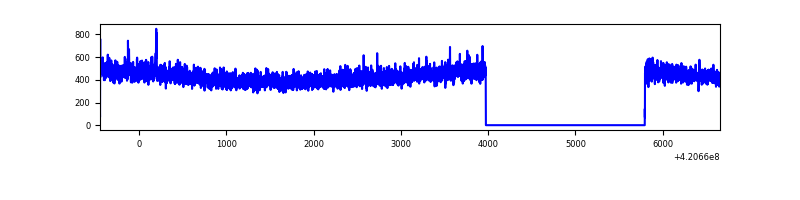 |
| C | 7100 | 5279 | 85 | 85 | 1.20% | 1.61% | 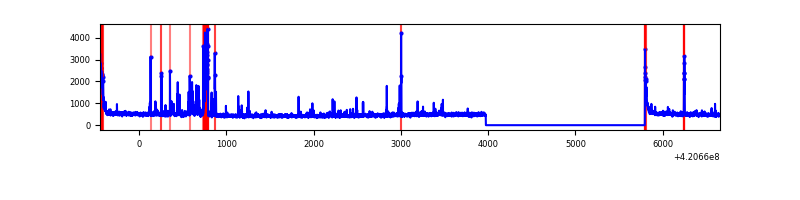 |
| D | 7100 | 5279 | 63 | 63 | 0.89% | 1.19% | 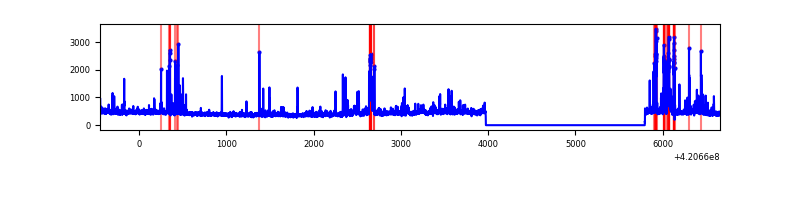 |
Top three noisy pixels from each quadrant. If the there are fewer than three noisy pixels in the level2.evt file, extra rows are filled as -1
| Pixel properties | Quadrant properties | ||||||
|---|---|---|---|---|---|---|---|
| Quadrant | DetID | PixID | Counts | Sigma | Mean | Median | Sigma |
| A | 10 | 83 | 495581 | 4210.39 | 572 | 560 | 117.6 |
| A | 12 | 189 | 14152 | 115.61 | 572 | 560 | 117.6 |
| A | 13 | 254 | 9817 | 78.74 | 572 | 560 | 117.6 |
| B | 12 | 111 | 14125 | 121.84 | 572 | 556 | 111.4 |
| B | 11 | 111 | 12960 | 111.38 | 572 | 556 | 111.4 |
| B | 14 | 111 | 12883 | 110.69 | 572 | 556 | 111.4 |
| C | 14 | 254 | 281960 | 2137.46 | 562 | 566 | 131.6 |
| C | 15 | 214 | 225608 | 1709.41 | 562 | 566 | 131.6 |
| C | 0 | 10 | 120976 | 914.63 | 562 | 566 | 131.6 |
| D | 13 | 249 | 185773 | 1375.87 | 559 | 544 | 134.6 |
| D | 12 | 0 | 144340 | 1068.11 | 559 | 544 | 134.6 |
| D | 13 | 171 | 124964 | 924.18 | 559 | 544 | 134.6 |
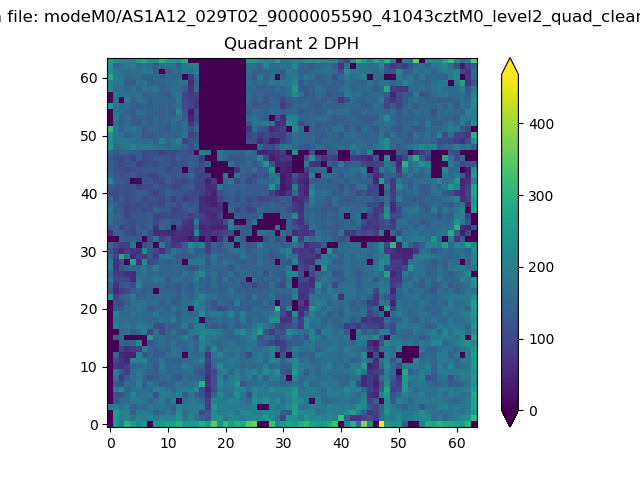
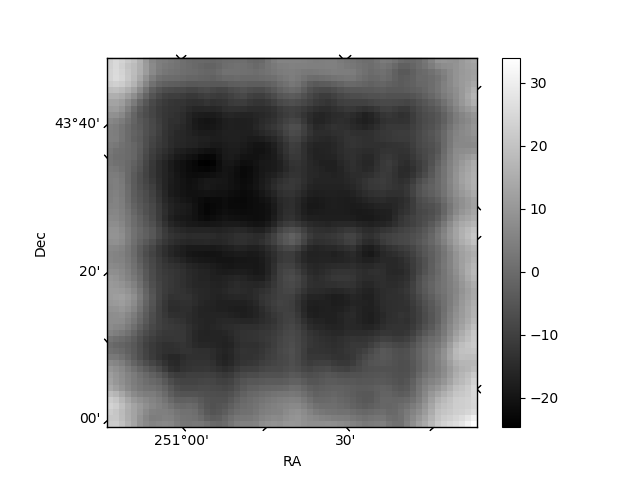
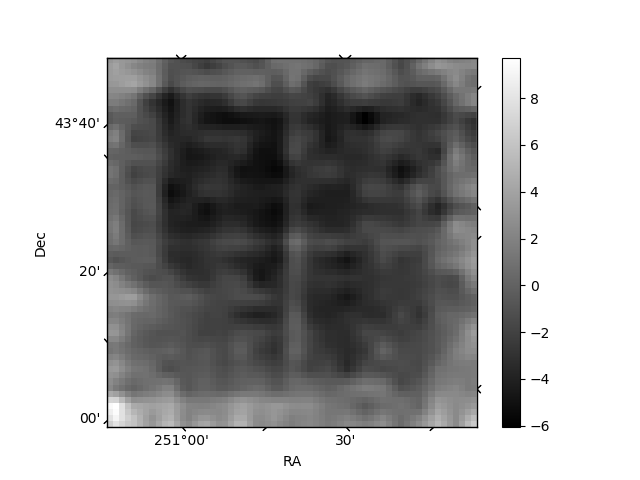
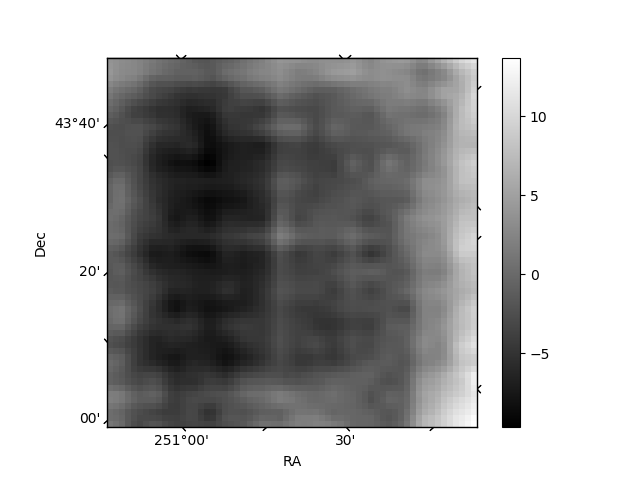
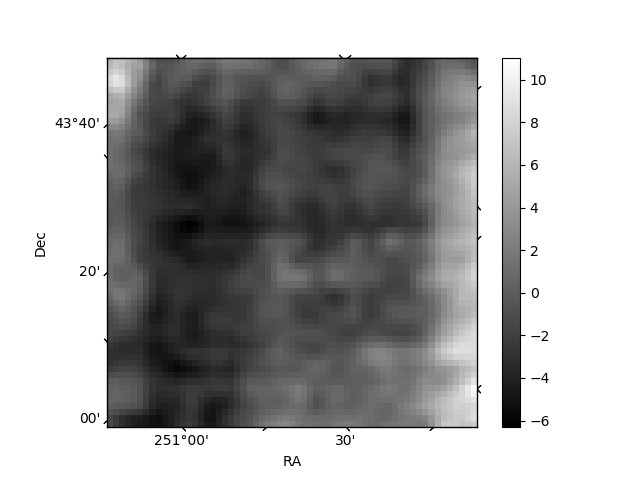
Histogram calculated using DETX and DETY for each event in the final _common_clean file
| Quadrant A | 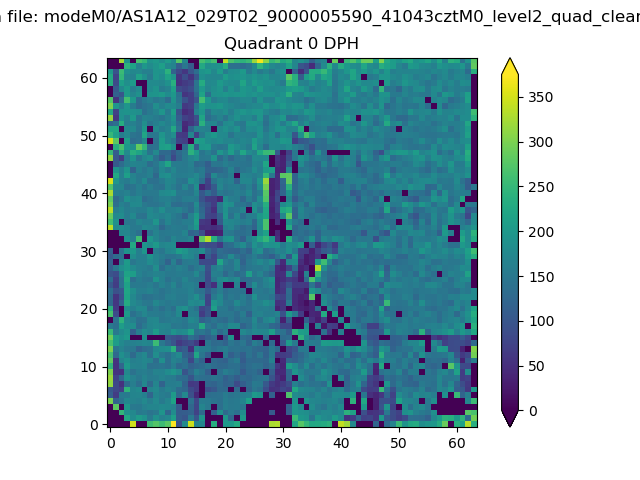 |
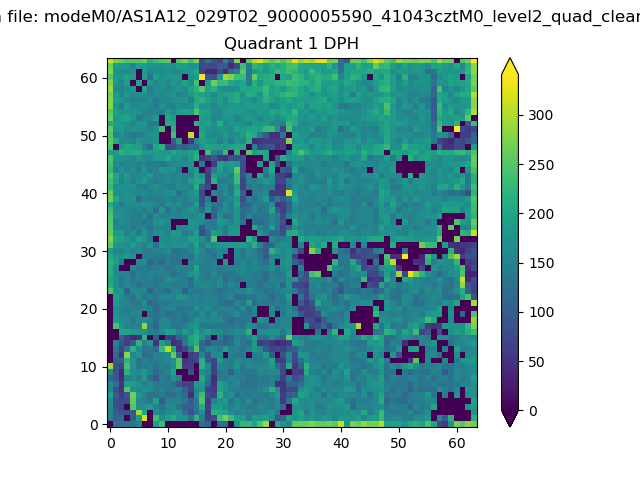 |
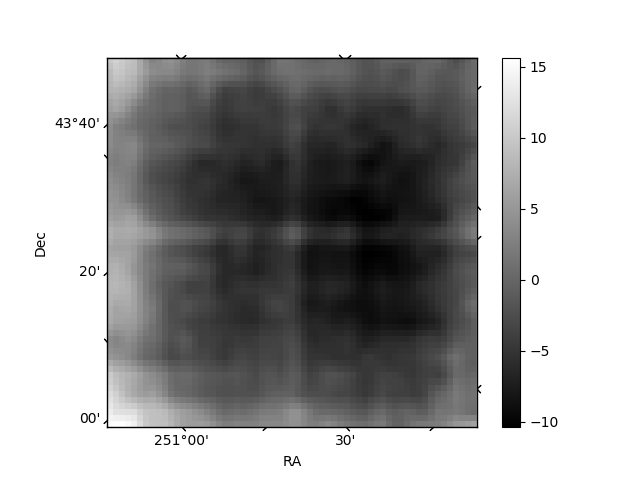
Quadrant B |
|---|---|---|---|
| Quadrant D | 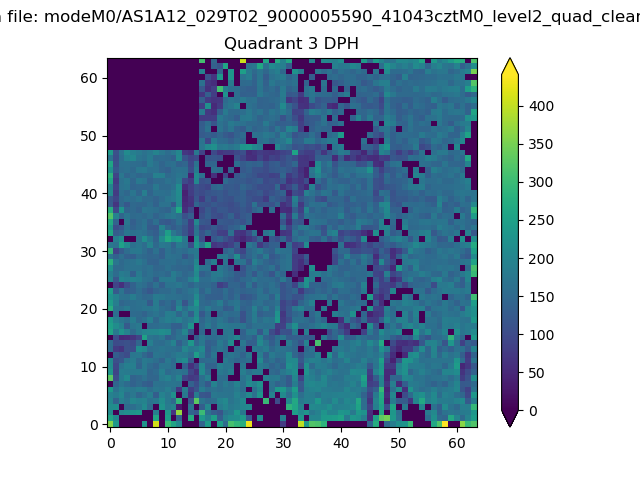 |
 |
Quadrant C |
| Plot type | Count rate plots | Images |
|---|---|---|
| Comparison with Poisson distribution Blue bars denote a histogram of data divided into 1 sec bins. Red curve is a Poisson curve with rate = median count rate of data. |
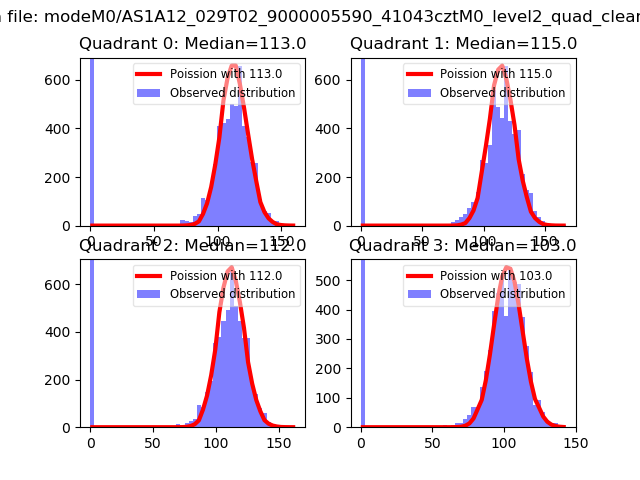 |
 |
| Quadrant-wise count rates Data is divided into 100 sec bins |
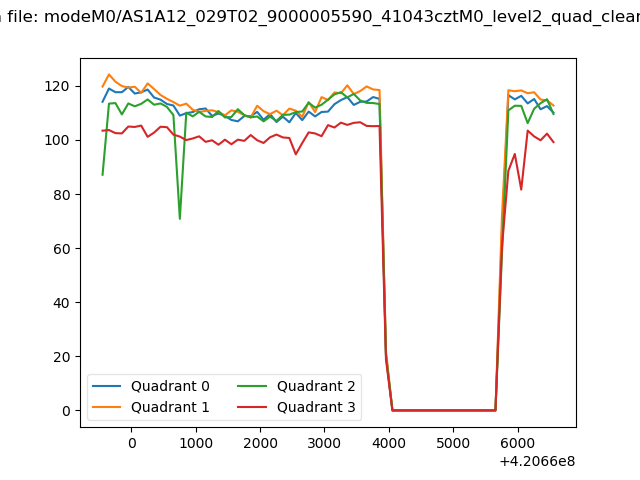 |
|
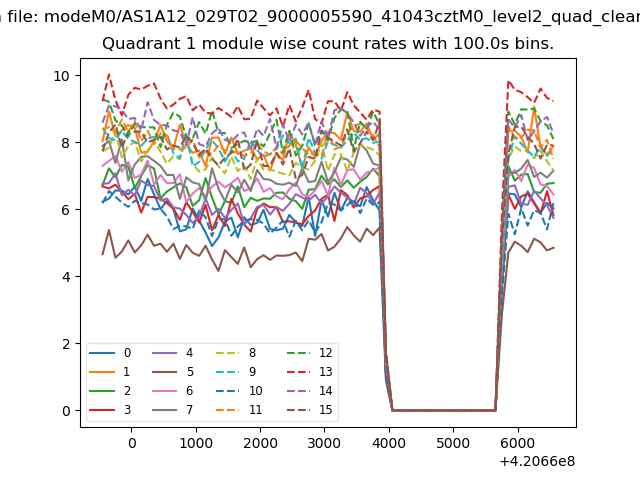
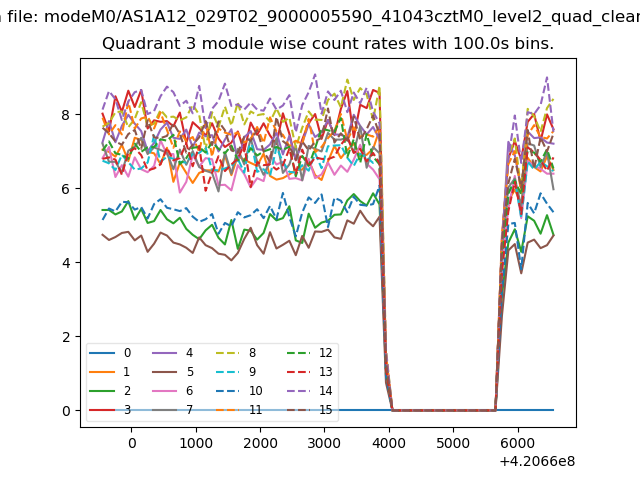
| Module-wise count rates for Quadrant A Data is divided into 100 sec bins |
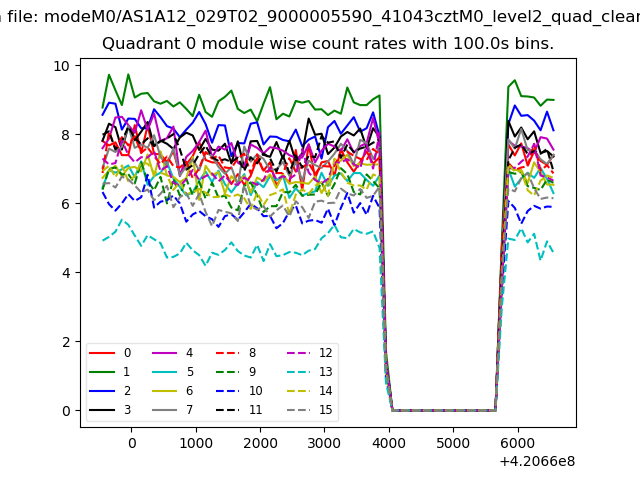 |
 |
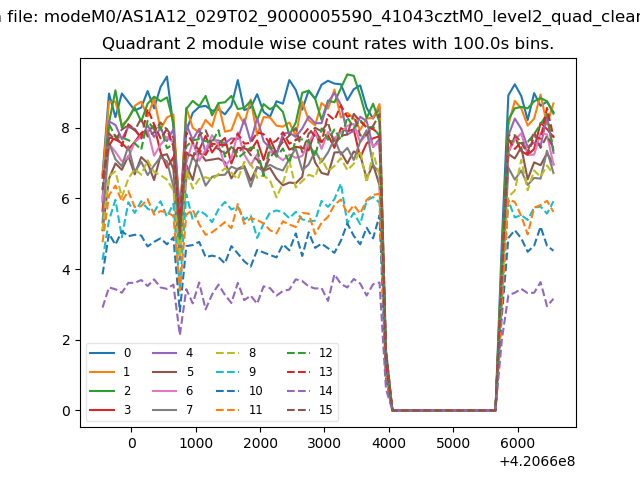
| Module-wise count rates for Quadrant B Data is divided into 100 sec bins |
 |
 |
| Module-wise count rates for Quadrant C Data is divided into 100 sec bins |
 |
 |
| Module-wise count rates for Quadrant D Data is divided into 100 sec bins |
 |
 |
| Parameter | Plot |
|---|---|
| CZT HV Monitor | 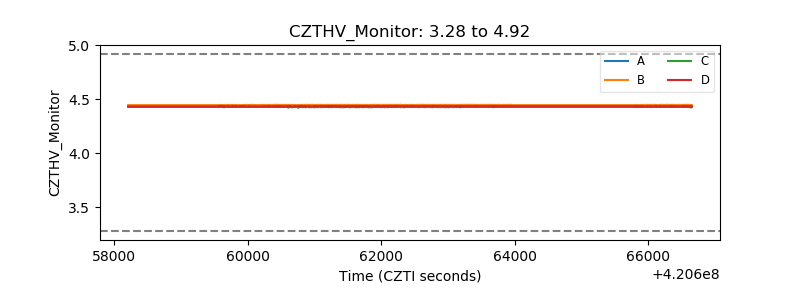 |
| D_VDD | 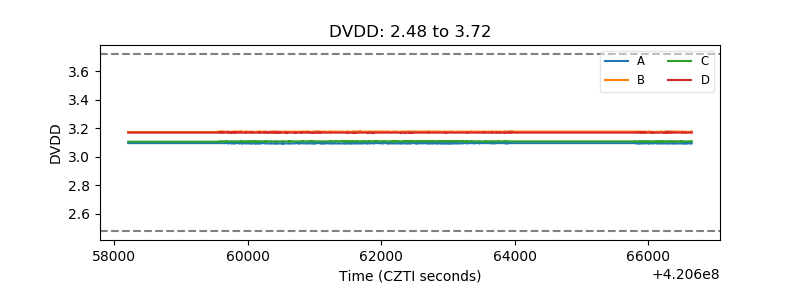 |
| Temperature 1 | 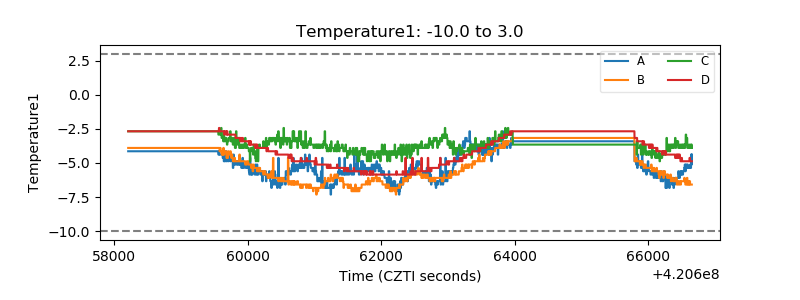 |
| Veto HV Monitor |  |
| Veto LLD | 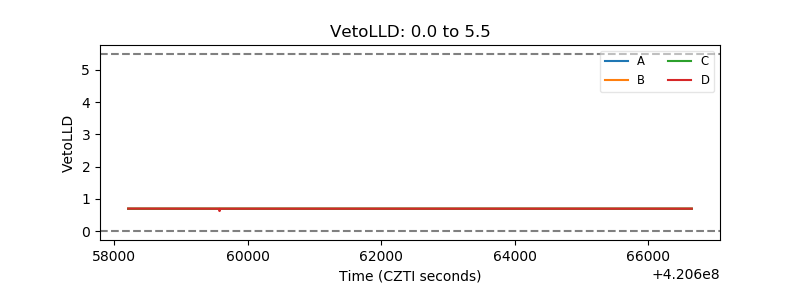 |
| Alpha Counter |  |
| _CPM_Rate |  |
| CZT Counter | 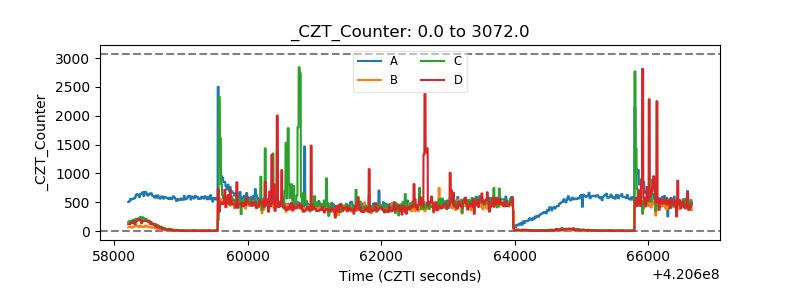 |
| +2.5 Volts monitor | 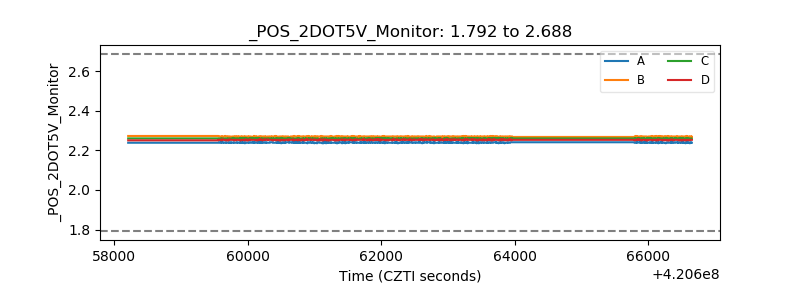 |
| +5 Volts monitor | 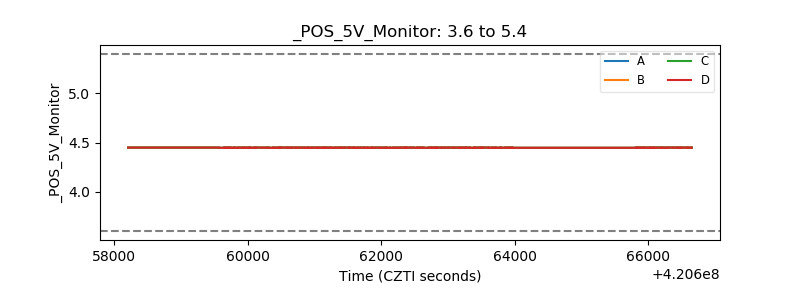 |
| _ROLL_ROT | 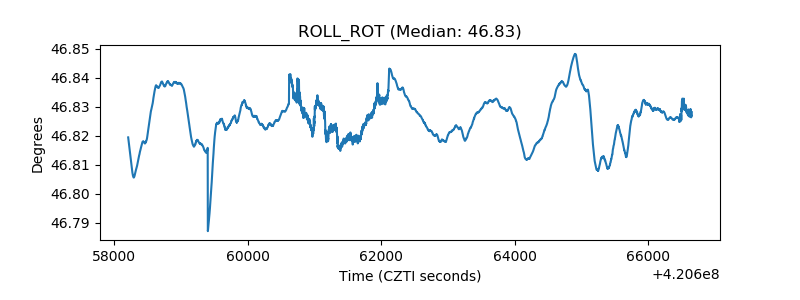 |
| _Roll_DEC | 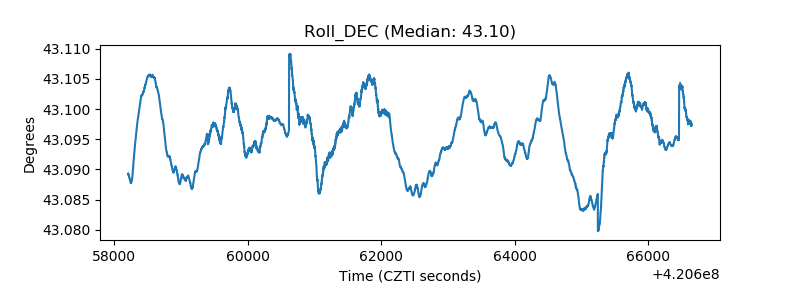 |
| _Roll_RA | 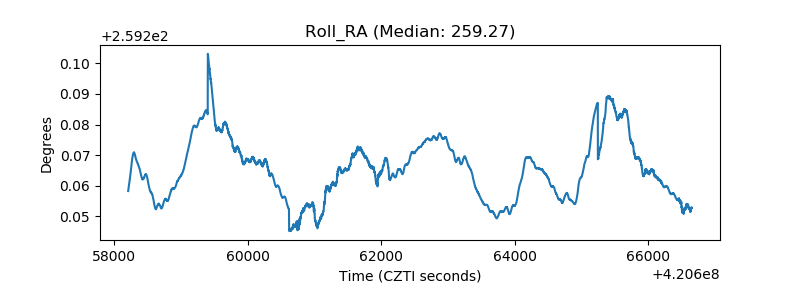 |
| Veto Counter | 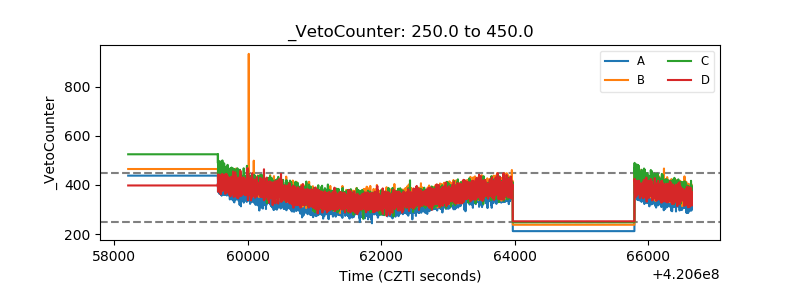 |