| Param | Original file | Final file |
|---|---|---|
| Filename | modeM0/AS1A12_029T02_9000005590_41044cztM0_level2.fits | modeM0/AS1A12_029T02_9000005590_41044cztM0_level2_quad_clean.evt |
| Size (bytes) | 330,488,640 | 97,732,800 |
| Size | 315.2 MB | 93.2 MB |
| Events in quadrant A | 3,038,683 | 649,284 |
| Events in quadrant B | 2,567,575 | 667,298 |
| Events in quadrant C | 2,908,938 | 646,971 |
| Events in quadrant D | 3,258,581 | 583,676 |
| Mode SS | |||
|---|---|---|---|
| Quadrant | BADHDUFLAG | Total packets | Discarded packets |
| A | 0 | 122 | 0 |
| B | 0 | 122 | 0 |
| C | 0 | 122 | 0 |
| D | 0 | 122 | 0 |
| Mode M0 | |||
|---|---|---|---|
| Quadrant | BADHDUFLAG | Total packets | Discarded packets |
| A | 0 | 12693 | 3 |
| B | 0 | 11922 | 2 |
| C | 0 | 12422 | 2 |
| D | 0 | 13980 | 2 |
| Mode M9 | |||
|---|---|---|---|
| Quadrant | BADHDUFLAG | Total packets | Discarded packets |
| A | 0 | 33 | 0 |
| B | 0 | 33 | 0 |
| C | 0 | 33 | 0 |
| D | 0 | 33 | 0 |
| Quadrant | Total seconds | Saturated seconds | Saturation percentage |
|---|---|---|---|
| A | 5898 | 12 | 0.203459% |
| B | 5898 | 9 | 0.152594% |
| C | 5898 | 36 | 0.610376% |
| D | 5898 | 152 | 2.577145% |
Noise dominated data is calculated using 1-second bins in cleaned event files. If a bin has >2000 counts, and if more than 50% of those come from <1% of pixels, then it is considered to be noise-dominated and hence unusable.
| Quadrant | # 1 sec bins | Bins with >0 counts | Bins with >2000 counts | High rate bins dominated by noise | Noise dominated (total time) | Noise dominated (detector-on time) | Marked lightcurve |
|---|---|---|---|---|---|---|---|
| A | 9213 | 5900 | 3 | 3 | 0.03% | 0.05% | 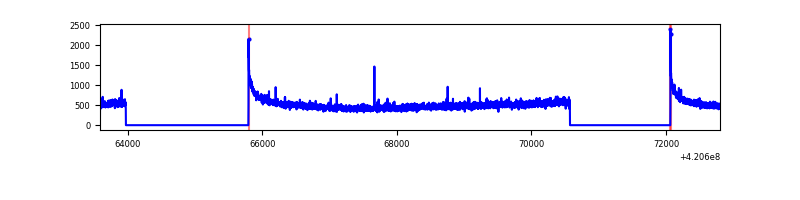 |
| B | 9213 | 5900 | 0 | 0 | 0.00% | 0.00% | 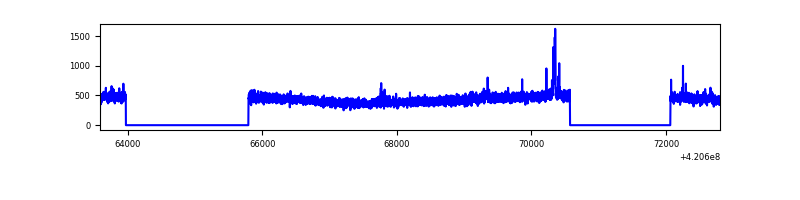 |
| C | 9213 | 5900 | 28 | 28 | 0.30% | 0.47% | 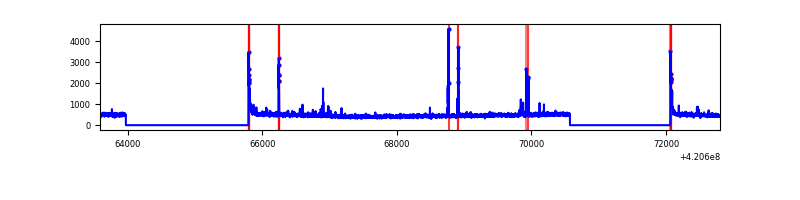 |
| D | 9213 | 5900 | 141 | 141 | 1.53% | 2.39% | 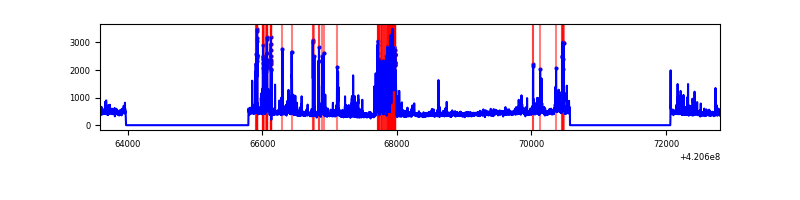 |
Top three noisy pixels from each quadrant. If the there are fewer than three noisy pixels in the level2.evt file, extra rows are filled as -1
| Pixel properties | Quadrant properties | ||||||
|---|---|---|---|---|---|---|---|
| Quadrant | DetID | PixID | Counts | Sigma | Mean | Median | Sigma |
| A | 10 | 83 | 523327 | 3968.15 | 644 | 631 | 131.7 |
| A | 13 | 254 | 10520 | 75.07 | 644 | 631 | 131.7 |
| A | 3 | 137 | 7289 | 50.55 | 644 | 631 | 131.7 |
| B | 8 | 128 | 30365 | 238.59 | 638 | 619 | 124.7 |
| B | 12 | 111 | 16006 | 123.42 | 638 | 619 | 124.7 |
| B | 11 | 111 | 14998 | 115.33 | 638 | 619 | 124.7 |
| C | 15 | 214 | 250037 | 1700.87 | 631 | 636 | 146.6 |
| C | 0 | 10 | 83645 | 566.11 | 631 | 636 | 146.6 |
| C | 14 | 254 | 75890 | 513.22 | 631 | 636 | 146.6 |
| D | 13 | 249 | 438579 | 2915.07 | 620 | 603 | 150.2 |
| D | 12 | 0 | 256109 | 1700.59 | 620 | 603 | 150.2 |
| D | 2 | 249 | 64846 | 427.58 | 620 | 603 | 150.2 |
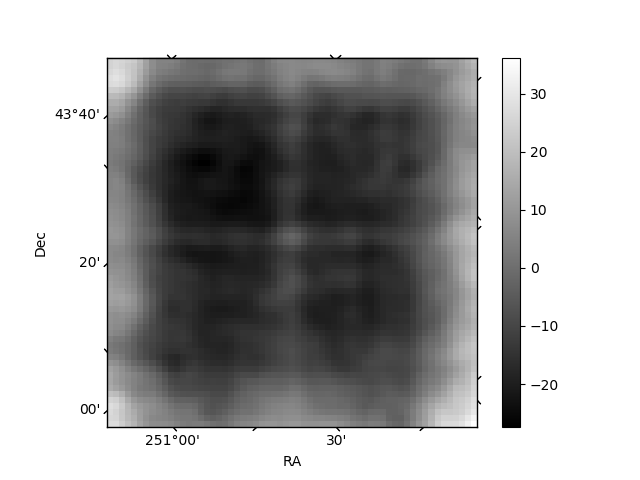
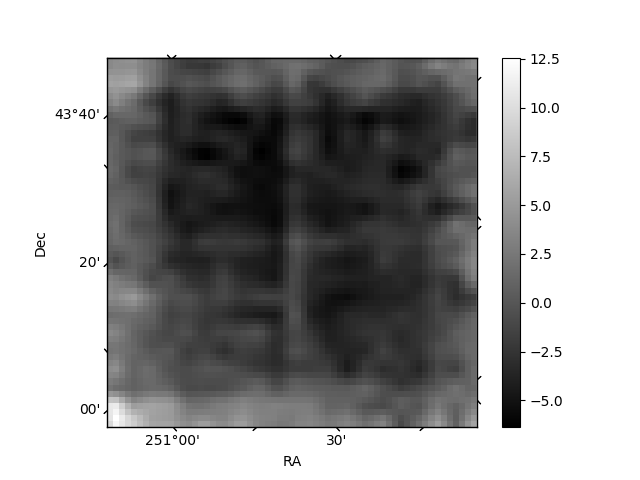
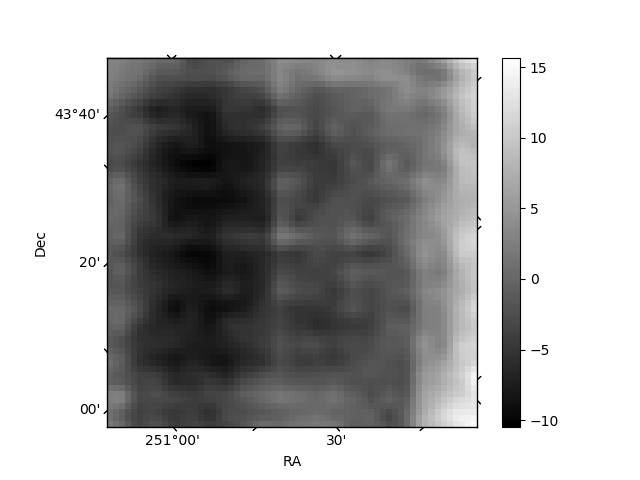
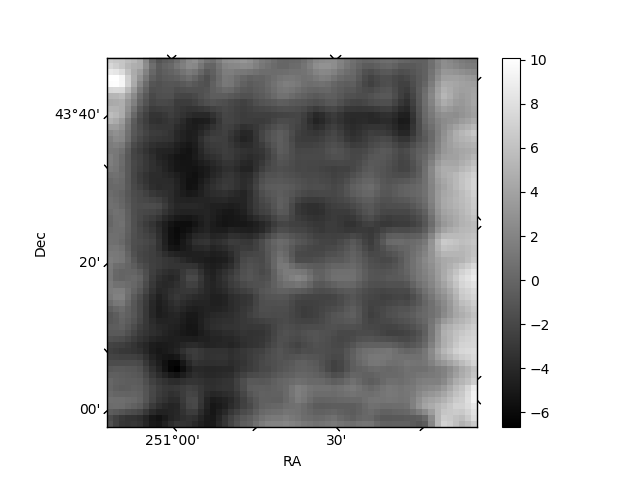
Histogram calculated using DETX and DETY for each event in the final _common_clean file
| Quadrant A | 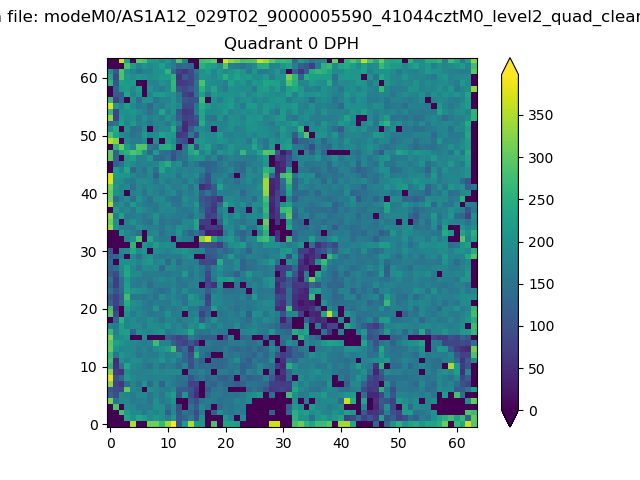 |
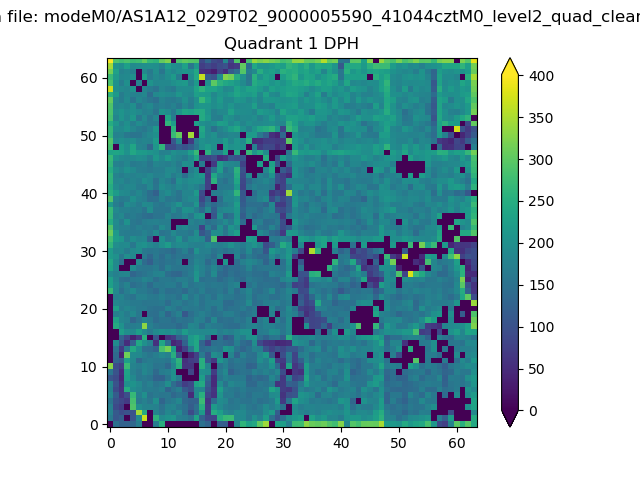 |
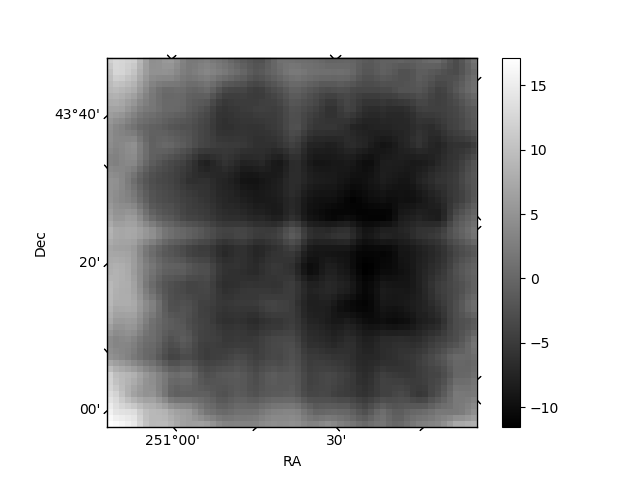
Quadrant B |
|---|---|---|---|
| Quadrant D | 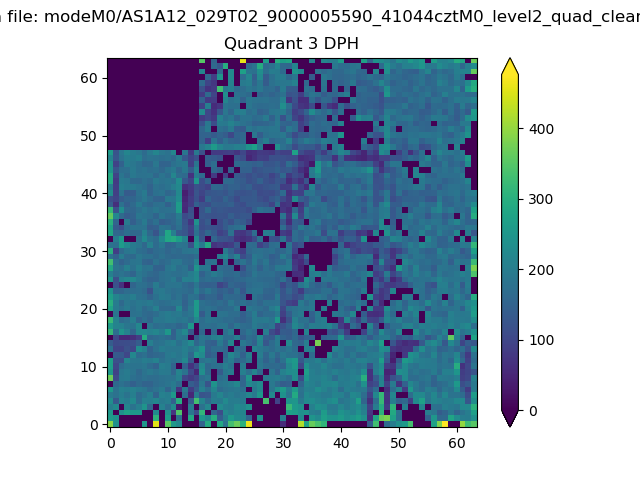 |
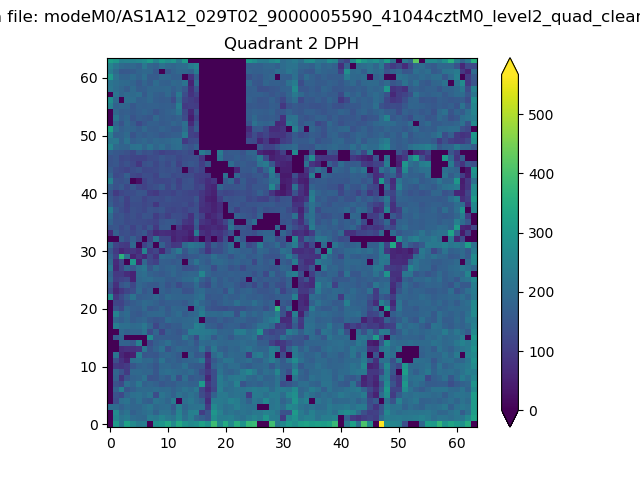 |
Quadrant C |
| Plot type | Count rate plots | Images |
|---|---|---|
| Comparison with Poisson distribution Blue bars denote a histogram of data divided into 1 sec bins. Red curve is a Poisson curve with rate = median count rate of data. |
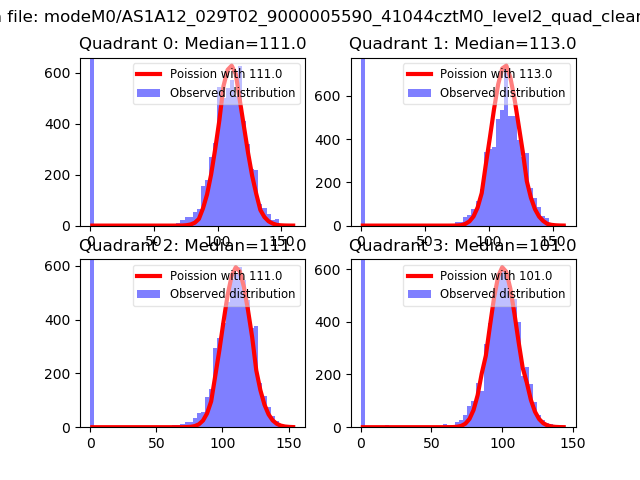 |
 |
| Quadrant-wise count rates Data is divided into 100 sec bins |
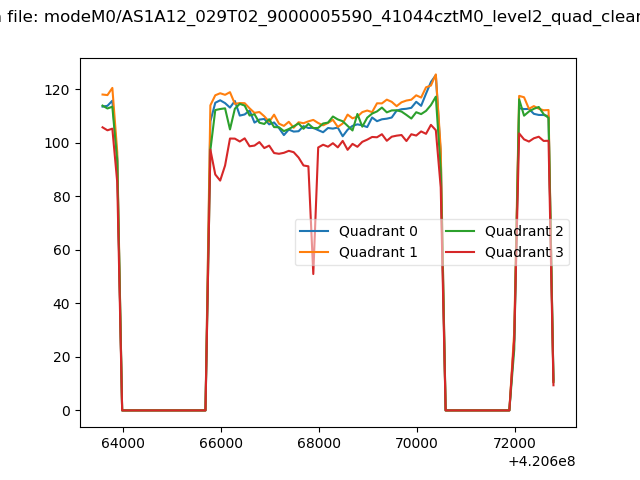 |
|
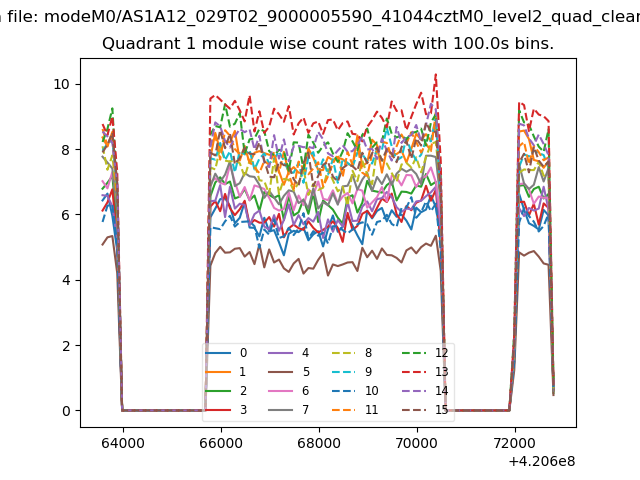
| Module-wise count rates for Quadrant A Data is divided into 100 sec bins |
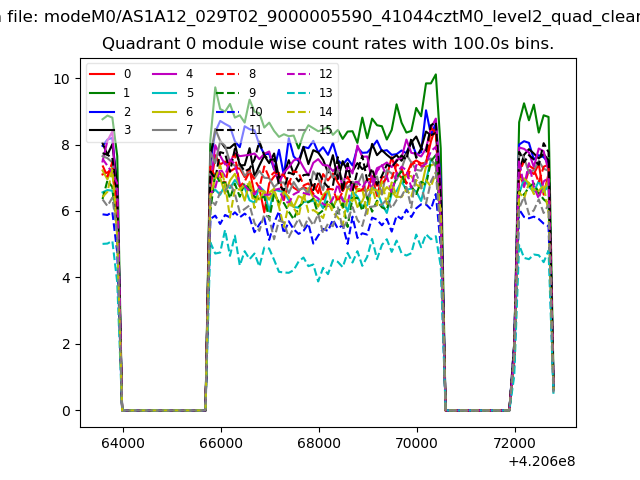 |
 |
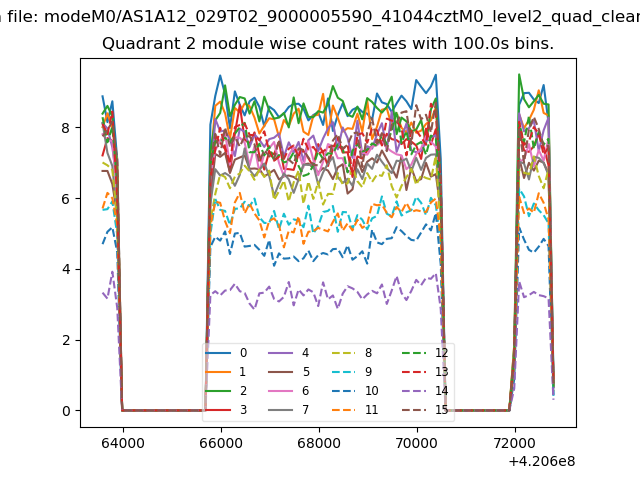
| Module-wise count rates for Quadrant B Data is divided into 100 sec bins |
 |
 |
| Module-wise count rates for Quadrant C Data is divided into 100 sec bins |
 |
 |
| Module-wise count rates for Quadrant D Data is divided into 100 sec bins |
 |
 |
| Parameter | Plot |
|---|---|
| CZT HV Monitor | 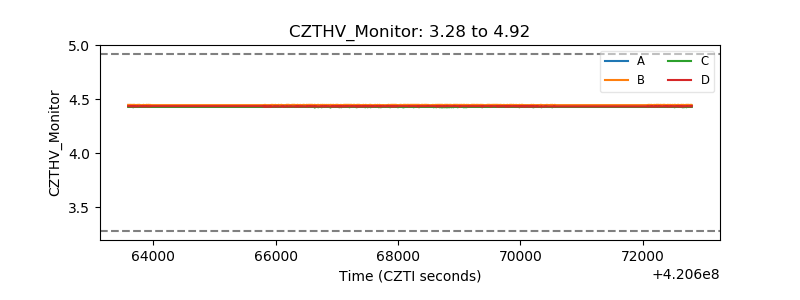 |
| D_VDD | 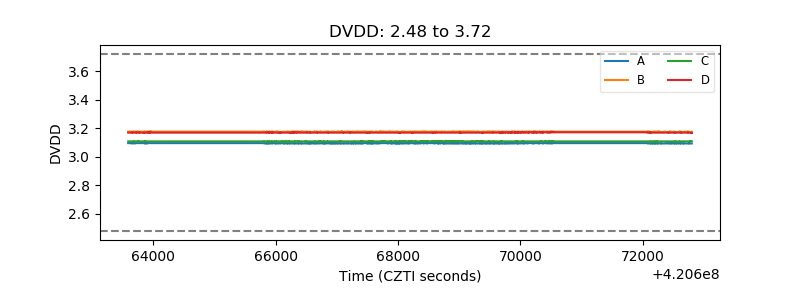 |
| Temperature 1 | 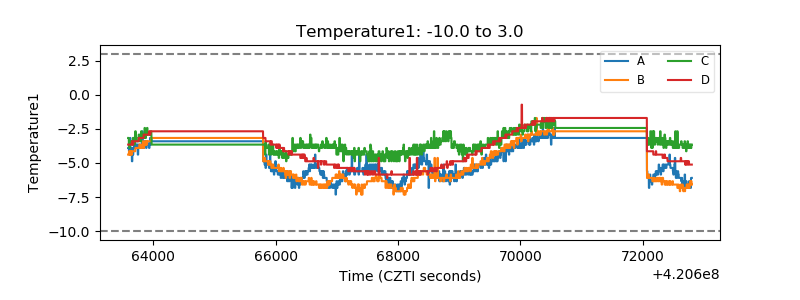 |
| Veto HV Monitor | 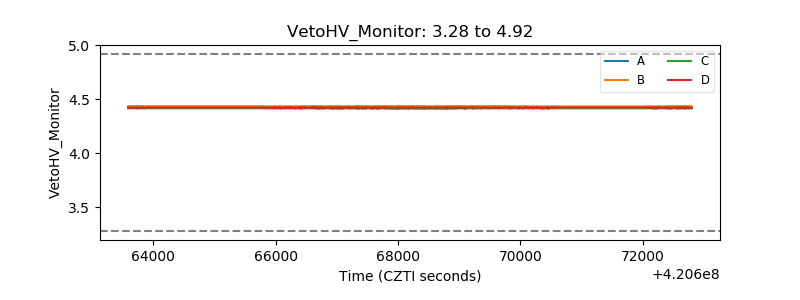 |
| Veto LLD | 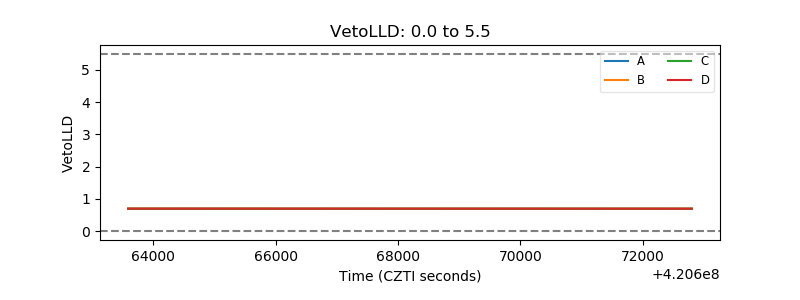 |
| Alpha Counter |  |
| _CPM_Rate |  |
| CZT Counter | 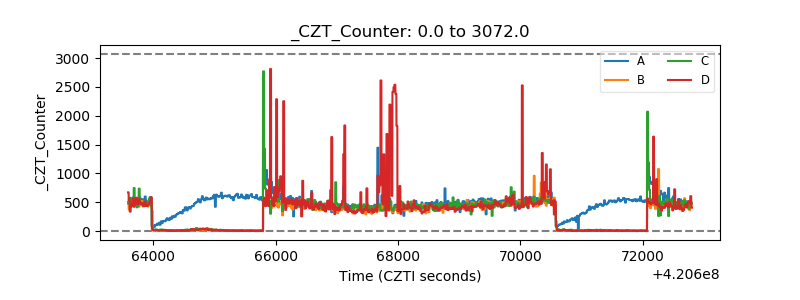 |
| +2.5 Volts monitor | 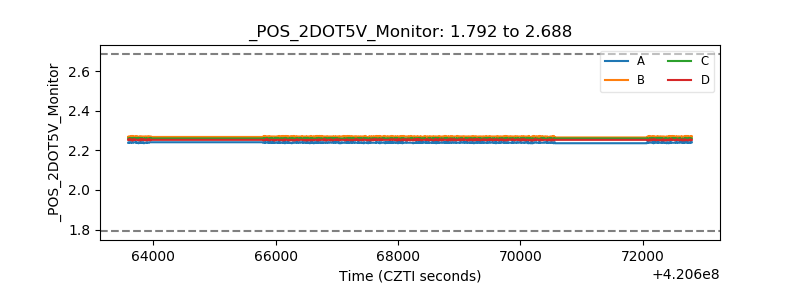 |
| +5 Volts monitor | 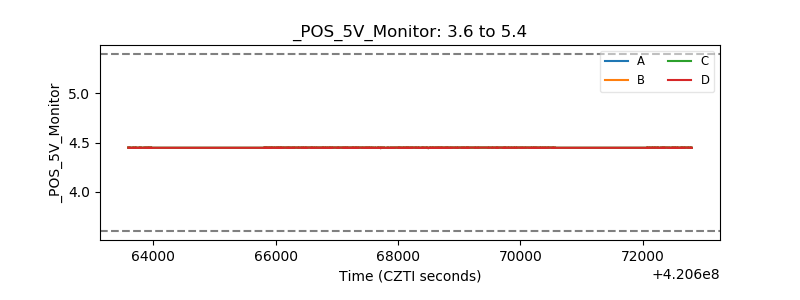 |
| _ROLL_ROT | 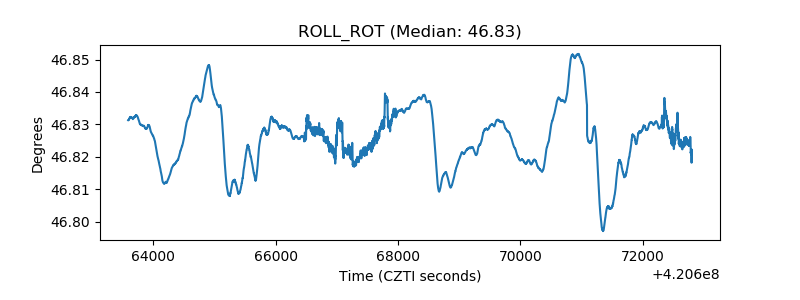 |
| _Roll_DEC | 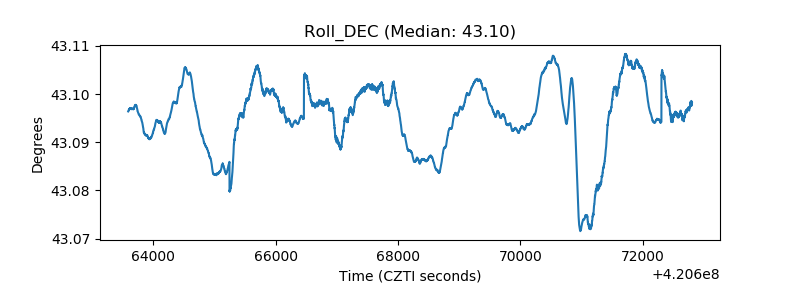 |
| _Roll_RA | 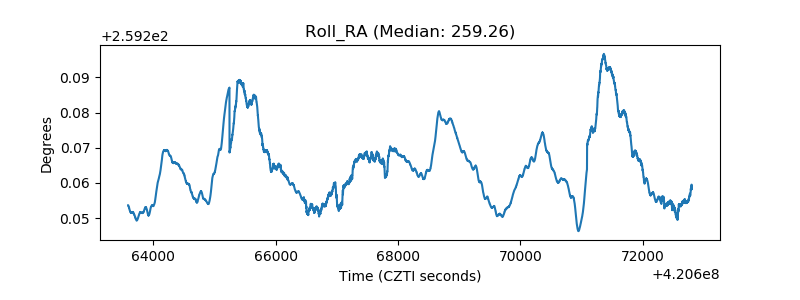 |
| Veto Counter | 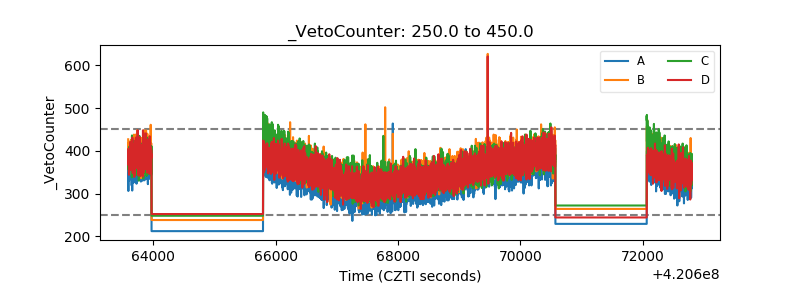 |