| Param | Original file | Final file |
|---|---|---|
| Filename | modeM0/AS1A12_029T02_9000005590_41048cztM0_level2.fits | modeM0/AS1A12_029T02_9000005590_41048cztM0_level2_quad_clean.evt |
| Size (bytes) | 919,618,560 | 258,955,200 |
| Size | 877.0 MB | 247.0 MB |
| Events in quadrant A | 8,265,184 | 1,717,150 |
| Events in quadrant B | 7,240,457 | 1,769,912 |
| Events in quadrant C | 8,190,396 | 1,699,139 |
| Events in quadrant D | 9,089,996 | 1,537,190 |
| Mode SS | |||
|---|---|---|---|
| Quadrant | BADHDUFLAG | Total packets | Discarded packets |
| A | 0 | 332 | 0 |
| B | 0 | 332 | 0 |
| C | 0 | 332 | 0 |
| D | 0 | 332 | 0 |
| Mode M0 | |||
|---|---|---|---|
| Quadrant | BADHDUFLAG | Total packets | Discarded packets |
| A | 0 | 34498 | 5 |
| B | 0 | 33202 | 4 |
| C | 0 | 34723 | 4 |
| D | 0 | 38705 | 4 |
| Mode M9 | |||
|---|---|---|---|
| Quadrant | BADHDUFLAG | Total packets | Discarded packets |
| A | 0 | 55 | 0 |
| B | 0 | 55 | 0 |
| C | 0 | 55 | 0 |
| D | 0 | 55 | 0 |
| Quadrant | Total seconds | Saturated seconds | Saturation percentage |
|---|---|---|---|
| A | 16193 | 25 | 0.154388% |
| B | 16193 | 46 | 0.284073% |
| C | 16193 | 140 | 0.864571% |
| D | 16193 | 352 | 2.173779% |
Noise dominated data is calculated using 1-second bins in cleaned event files. If a bin has >2000 counts, and if more than 50% of those come from <1% of pixels, then it is considered to be noise-dominated and hence unusable.
| Quadrant | # 1 sec bins | Bins with >0 counts | Bins with >2000 counts | High rate bins dominated by noise | Noise dominated (total time) | Noise dominated (detector-on time) | Marked lightcurve |
|---|---|---|---|---|---|---|---|
| A | 21655 | 16197 | 6 | 6 | 0.03% | 0.04% | 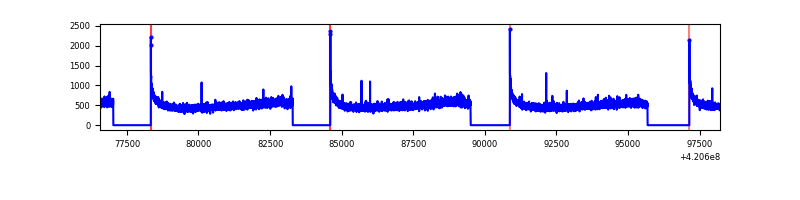 |
| B | 21655 | 16197 | 8 | 8 | 0.04% | 0.05% | 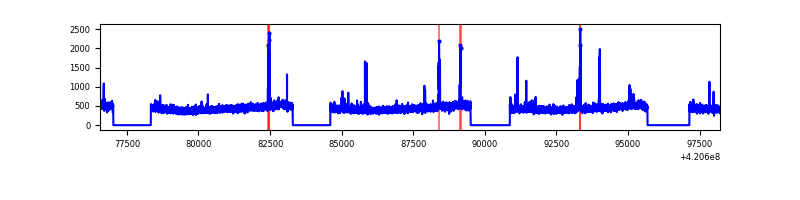 |
| C | 21655 | 16197 | 105 | 105 | 0.48% | 0.65% | 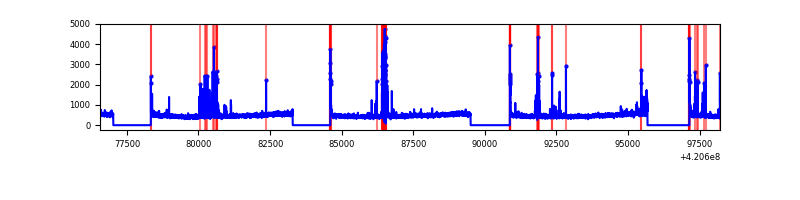 |
| D | 21655 | 16197 | 256 | 256 | 1.18% | 1.58% | 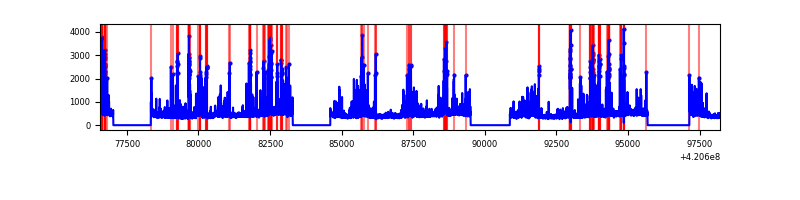 |
Top three noisy pixels from each quadrant. If the there are fewer than three noisy pixels in the level2.evt file, extra rows are filled as -1
| Pixel properties | Quadrant properties | ||||||
|---|---|---|---|---|---|---|---|
| Quadrant | DetID | PixID | Counts | Sigma | Mean | Median | Sigma |
| A | 10 | 83 | 1327301 | 3643.74 | 1780 | 1742 | 363.8 |
| A | 12 | 189 | 30158 | 78.11 | 1780 | 1742 | 363.8 |
| A | 13 | 254 | 24512 | 62.59 | 1780 | 1742 | 363.8 |
| B | 8 | 128 | 201806 | 587.86 | 1765 | 1715 | 340.4 |
| B | 0 | 190 | 72941 | 209.26 | 1765 | 1715 | 340.4 |
| B | 12 | 111 | 44818 | 126.64 | 1765 | 1715 | 340.4 |
| C | 15 | 214 | 733667 | 1812.61 | 1733 | 1740 | 403.8 |
| C | 14 | 254 | 563382 | 1390.9 | 1733 | 1740 | 403.8 |
| C | 0 | 10 | 120290 | 293.59 | 1733 | 1740 | 403.8 |
| D | 13 | 249 | 1292499 | 3097.02 | 1717 | 1669 | 416.8 |
| D | 12 | 0 | 507130 | 1212.73 | 1717 | 1669 | 416.8 |
| D | 13 | 171 | 336240 | 802.72 | 1717 | 1669 | 416.8 |
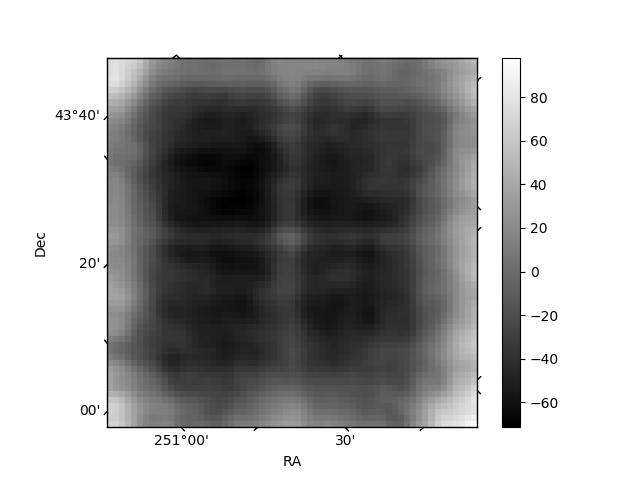
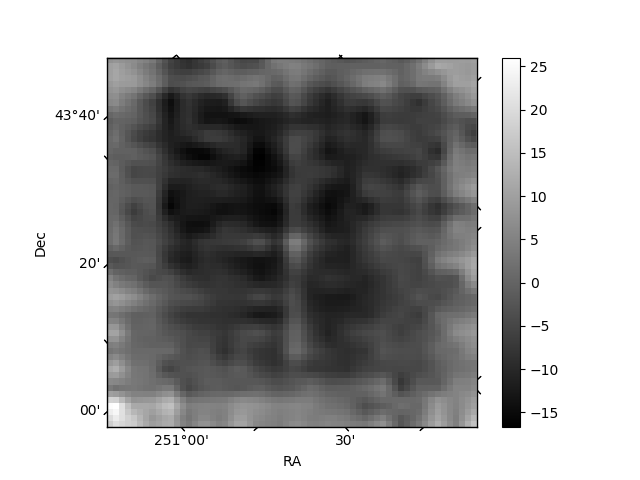
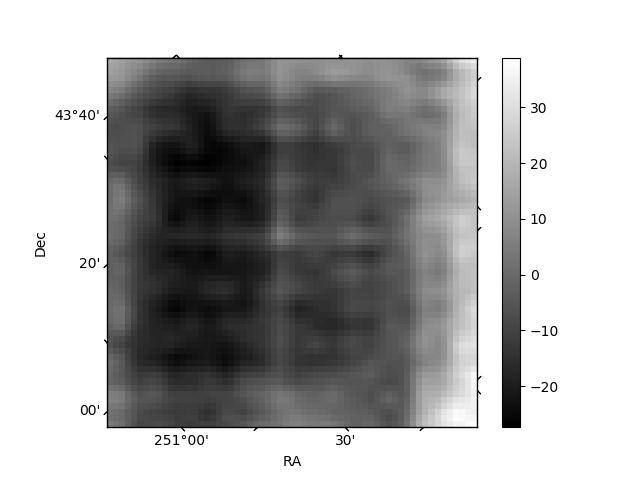
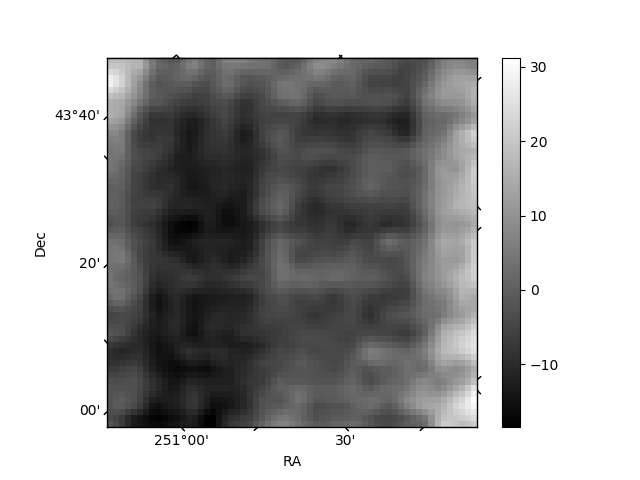
Histogram calculated using DETX and DETY for each event in the final _common_clean file
| Quadrant A | 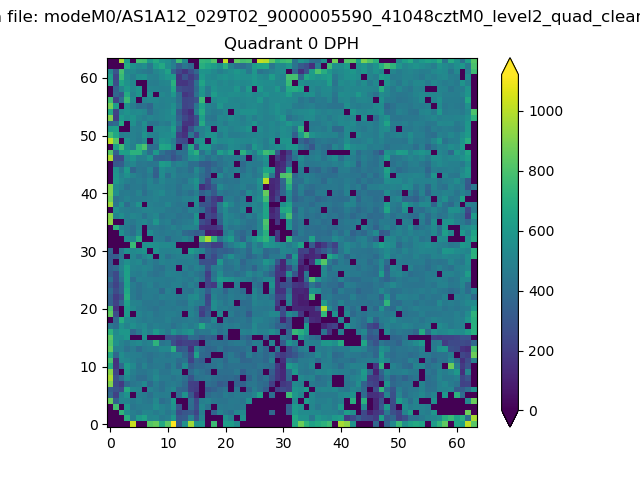 |
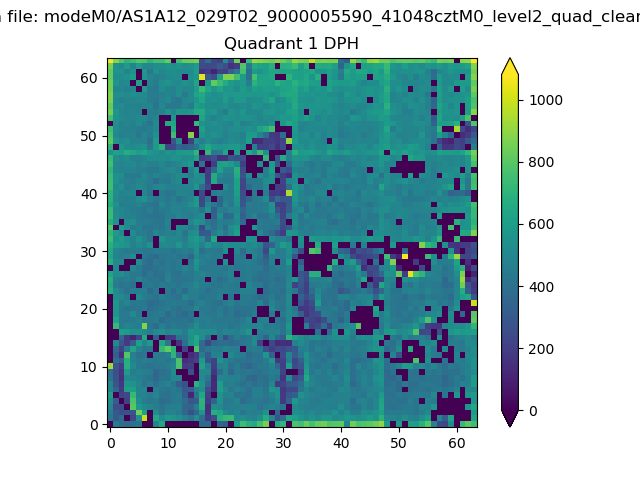 |
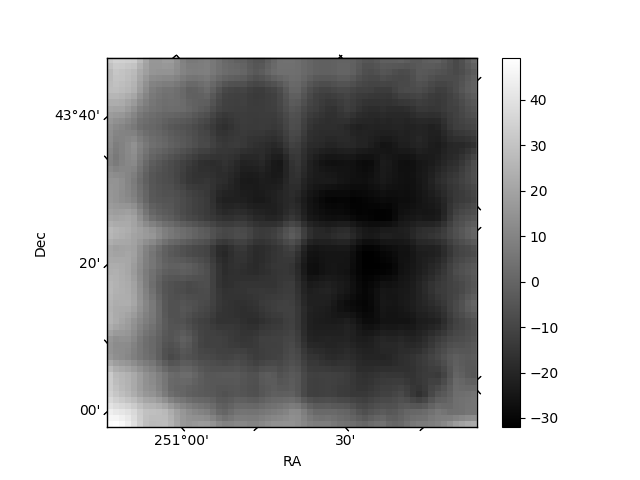
Quadrant B |
|---|---|---|---|
| Quadrant D | 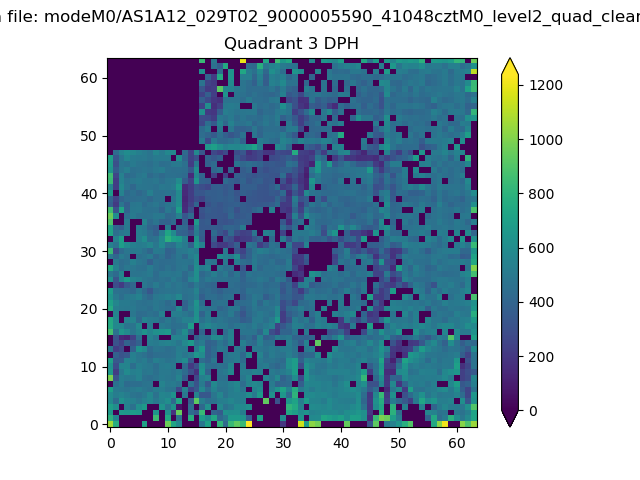 |
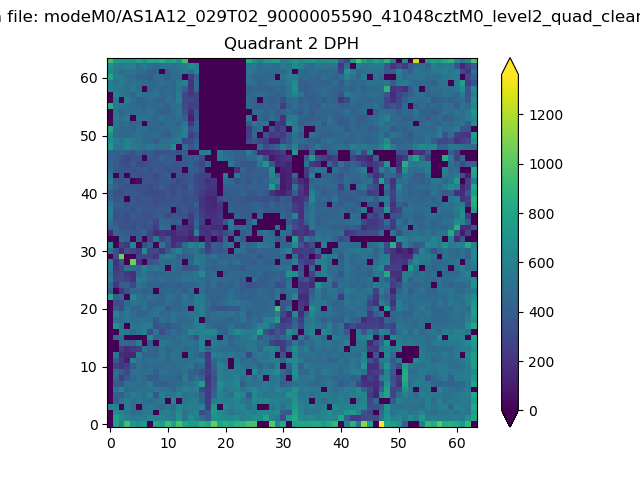 |
Quadrant C |
| Plot type | Count rate plots | Images |
|---|---|---|
| Comparison with Poisson distribution Blue bars denote a histogram of data divided into 1 sec bins. Red curve is a Poisson curve with rate = median count rate of data. |
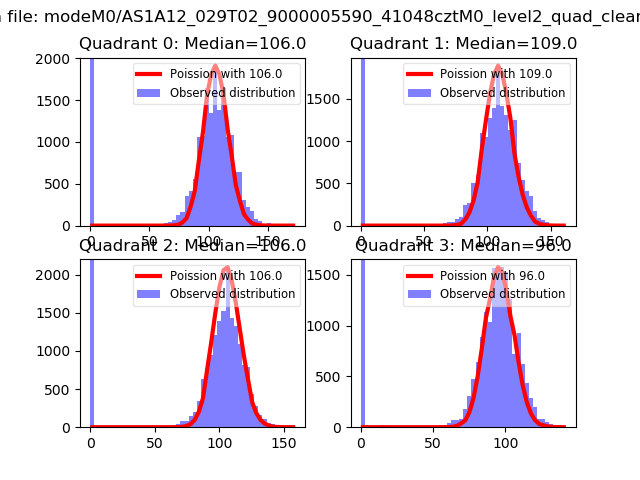 |
 |
| Quadrant-wise count rates Data is divided into 100 sec bins |
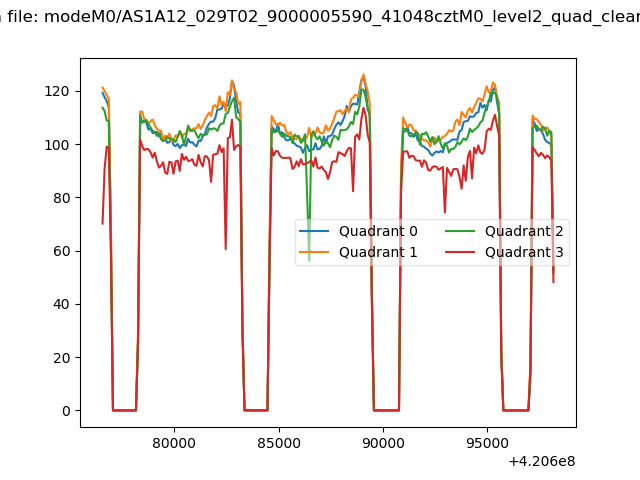 |
|
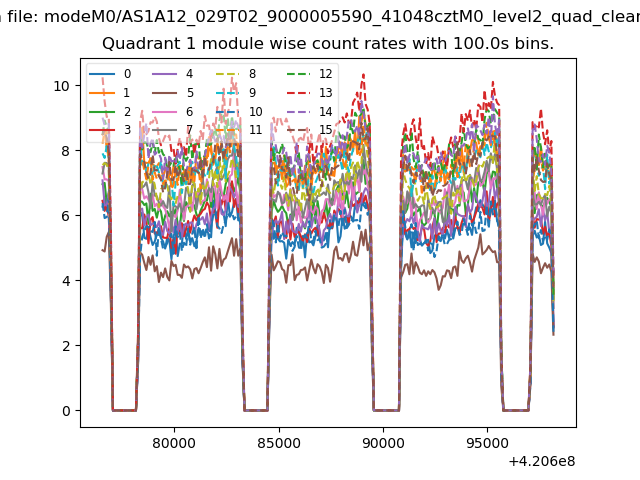
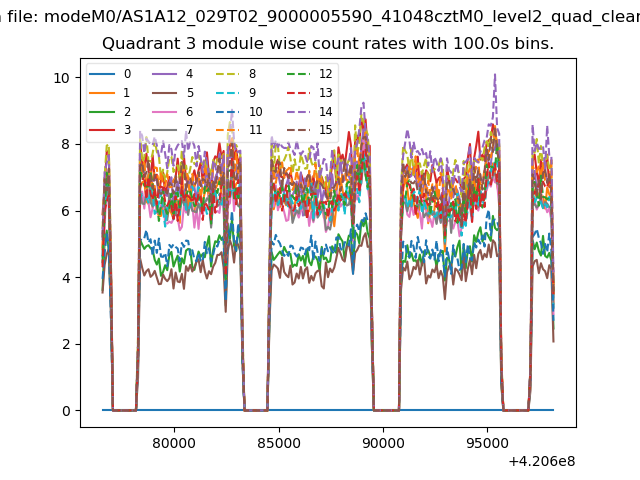
| Module-wise count rates for Quadrant A Data is divided into 100 sec bins |
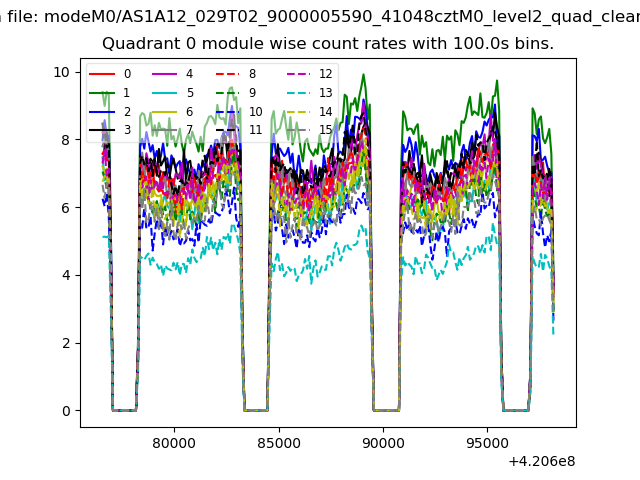 |
 |
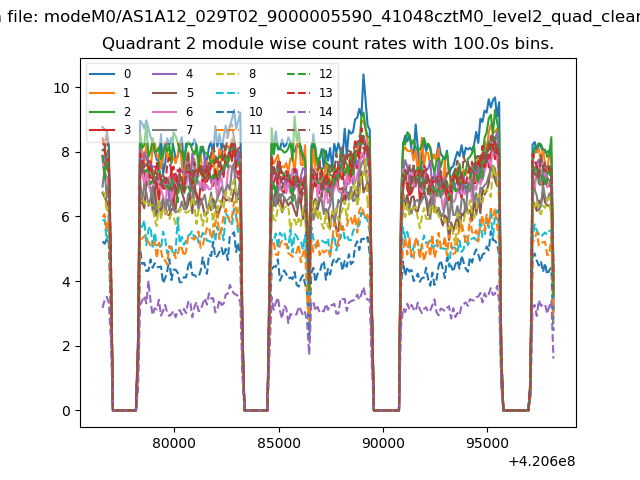
| Module-wise count rates for Quadrant B Data is divided into 100 sec bins |
 |
 |
| Module-wise count rates for Quadrant C Data is divided into 100 sec bins |
 |
 |
| Module-wise count rates for Quadrant D Data is divided into 100 sec bins |
 |
 |
| Parameter | Plot |
|---|---|
| CZT HV Monitor |  |
| D_VDD | 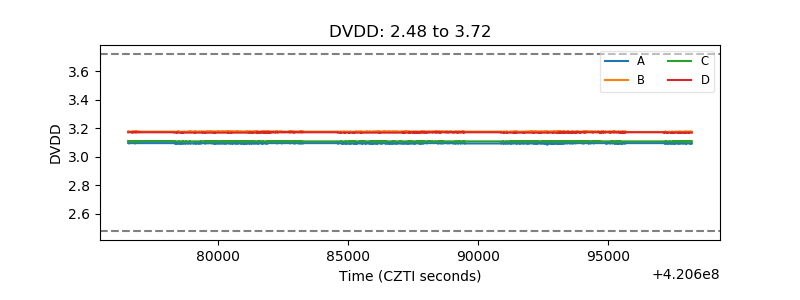 |
| Temperature 1 | 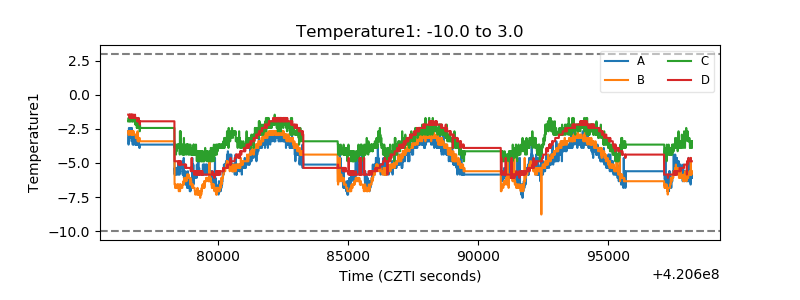 |
| Veto HV Monitor | 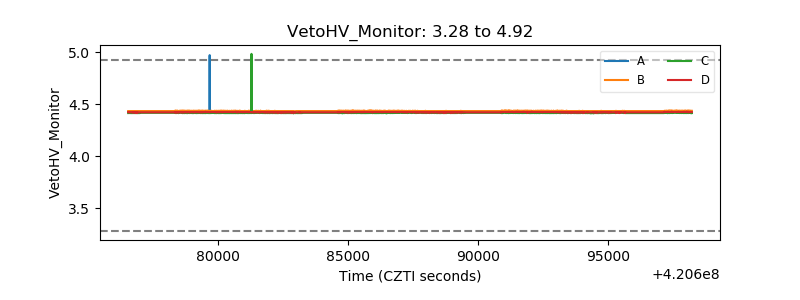 |
| Veto LLD | 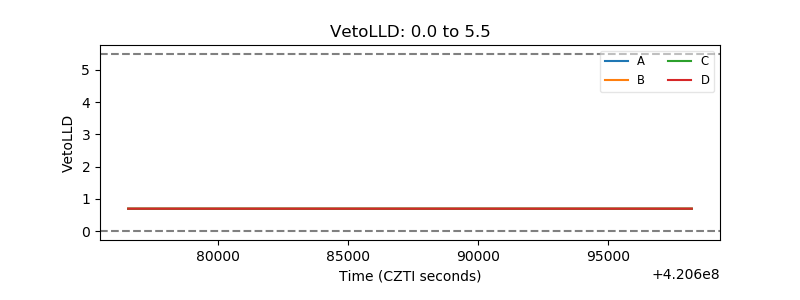 |
| Alpha Counter | 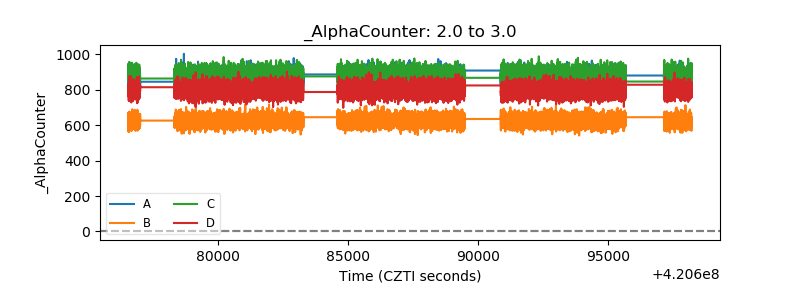 |
| _CPM_Rate |  |
| CZT Counter | 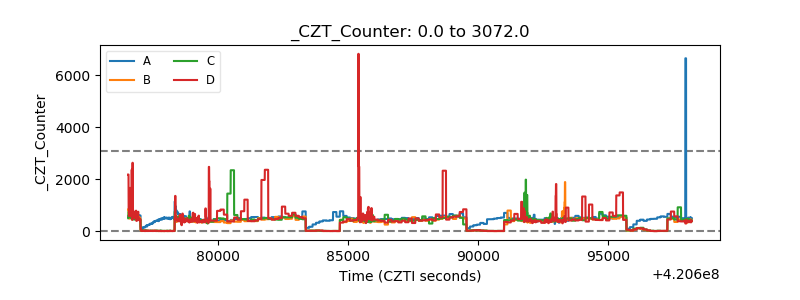 |
| +2.5 Volts monitor |  |
| +5 Volts monitor |  |
| _ROLL_ROT | 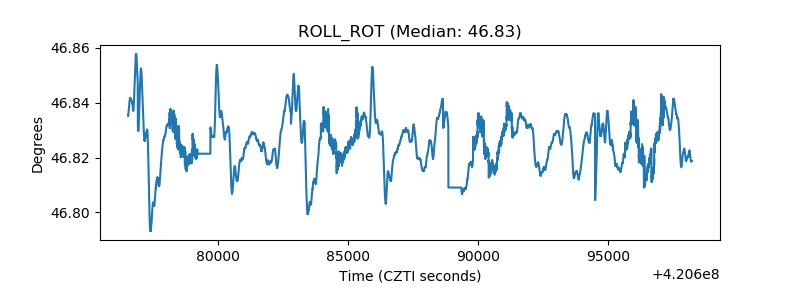 |
| _Roll_DEC | 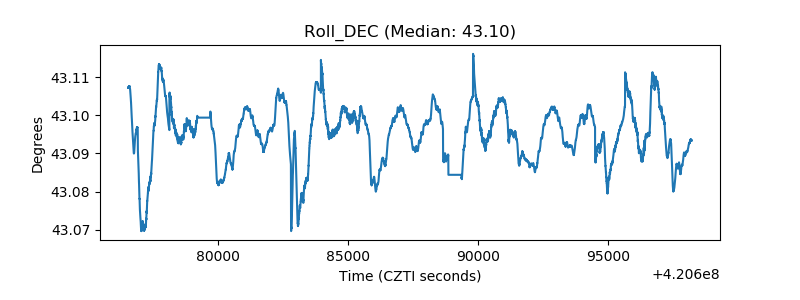 |
| _Roll_RA | 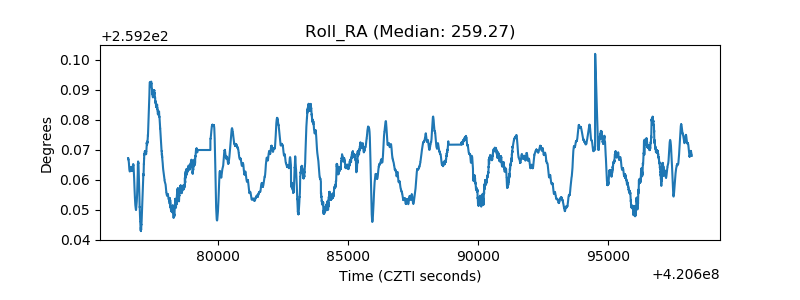 |
| Veto Counter | 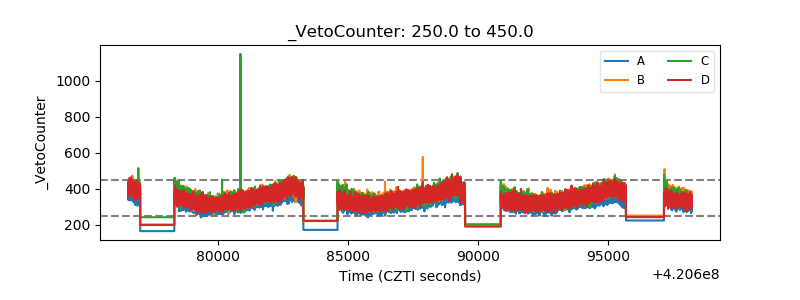 |