| Param | Original file | Final file |
|---|---|---|
| Filename | modeM0/AS1A12_029T02_9000005590_41049cztM0_level2.fits | modeM0/AS1A12_029T02_9000005590_41049cztM0_level2_quad_clean.evt |
| Size (bytes) | 333,734,400 | 91,981,440 |
| Size | 318.3 MB | 87.7 MB |
| Events in quadrant A | 2,944,959 | 613,333 |
| Events in quadrant B | 2,485,621 | 630,844 |
| Events in quadrant C | 2,836,510 | 605,821 |
| Events in quadrant D | 3,645,309 | 539,202 |
| Mode SS | |||
|---|---|---|---|
| Quadrant | BADHDUFLAG | Total packets | Discarded packets |
| A | 0 | 114 | 0 |
| B | 0 | 114 | 0 |
| C | 0 | 114 | 0 |
| D | 0 | 114 | 0 |
| Mode M0 | |||
|---|---|---|---|
| Quadrant | BADHDUFLAG | Total packets | Discarded packets |
| A | 0 | 12041 | 3 |
| B | 0 | 11420 | 2 |
| C | 0 | 11956 | 2 |
| D | 0 | 14965 | 2 |
| Mode M9 | |||
|---|---|---|---|
| Quadrant | BADHDUFLAG | Total packets | Discarded packets |
| A | 0 | 29 | 0 |
| B | 0 | 29 | 0 |
| C | 0 | 29 | 0 |
| D | 0 | 30 | 0 |
| Quadrant | Total seconds | Saturated seconds | Saturation percentage |
|---|---|---|---|
| A | 5666 | 10 | 0.176491% |
| B | 5666 | 7 | 0.123544% |
| C | 5666 | 28 | 0.494176% |
| D | 5666 | 270 | 4.765267% |
Noise dominated data is calculated using 1-second bins in cleaned event files. If a bin has >2000 counts, and if more than 50% of those come from <1% of pixels, then it is considered to be noise-dominated and hence unusable.
| Quadrant | # 1 sec bins | Bins with >0 counts | Bins with >2000 counts | High rate bins dominated by noise | Noise dominated (total time) | Noise dominated (detector-on time) | Marked lightcurve |
|---|---|---|---|---|---|---|---|
| A | 7249 | 5667 | 2 | 2 | 0.03% | 0.04% | 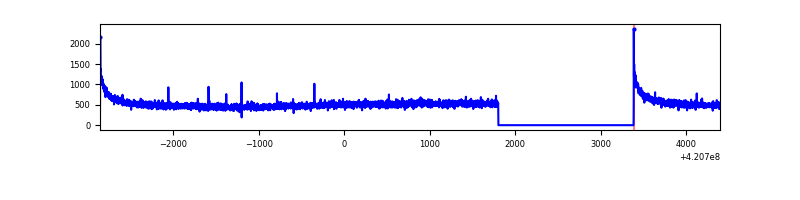 |
| B | 7249 | 5667 | 0 | 0 | 0.00% | 0.00% | 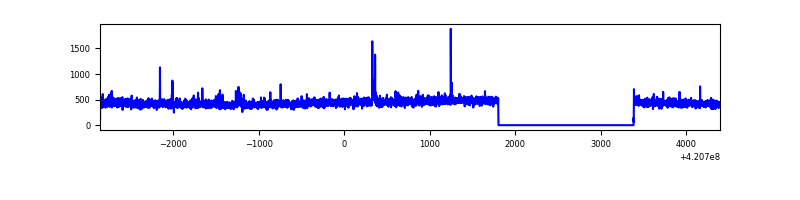 |
| C | 7249 | 5667 | 26 | 26 | 0.36% | 0.46% | 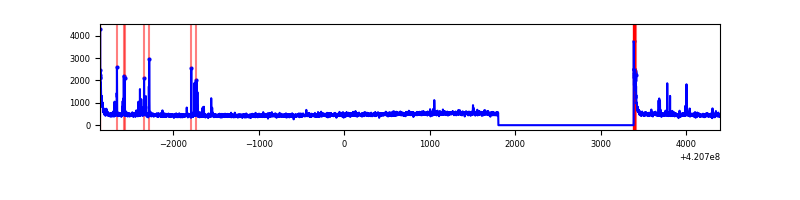 |
| D | 7249 | 5667 | 218 | 218 | 3.01% | 3.85% | 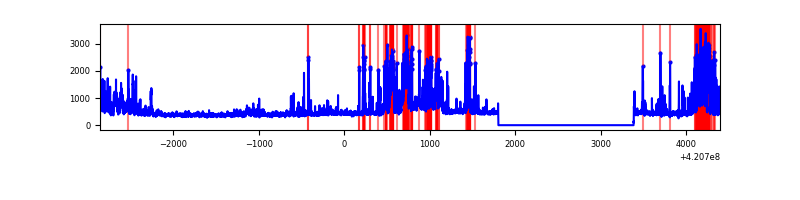 |
Top three noisy pixels from each quadrant. If the there are fewer than three noisy pixels in the level2.evt file, extra rows are filled as -1
| Pixel properties | Quadrant properties | ||||||
|---|---|---|---|---|---|---|---|
| Quadrant | DetID | PixID | Counts | Sigma | Mean | Median | Sigma |
| A | 10 | 83 | 516098 | 3986.44 | 626 | 612 | 129.3 |
| A | 13 | 254 | 7756 | 55.25 | 626 | 612 | 129.3 |
| A | 3 | 137 | 7280 | 51.57 | 626 | 612 | 129.3 |
| B | 0 | 229 | 22923 | 182.52 | 621 | 604 | 122.3 |
| B | 0 | 190 | 19517 | 154.66 | 621 | 604 | 122.3 |
| B | 12 | 111 | 15836 | 124.56 | 621 | 604 | 122.3 |
| C | 15 | 214 | 261845 | 1820.87 | 609 | 612 | 143.5 |
| C | 14 | 254 | 98629 | 683.21 | 609 | 612 | 143.5 |
| C | 0 | 10 | 95518 | 661.52 | 609 | 612 | 143.5 |
| D | 13 | 249 | 1014429 | 6886.96 | 599 | 581 | 147.2 |
| D | 12 | 0 | 138724 | 938.39 | 599 | 581 | 147.2 |
| D | 13 | 171 | 85187 | 574.72 | 599 | 581 | 147.2 |
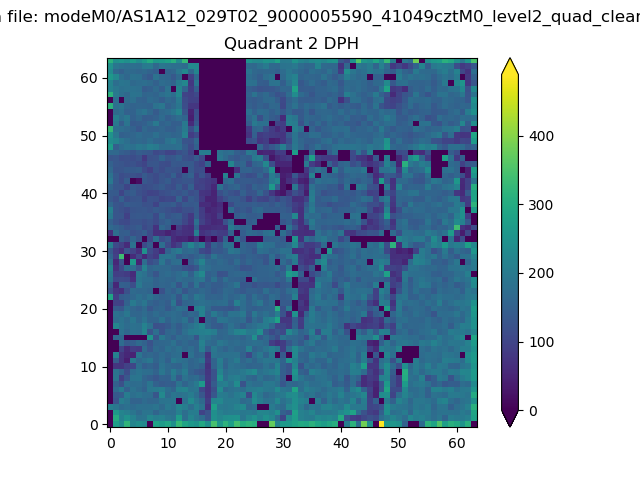
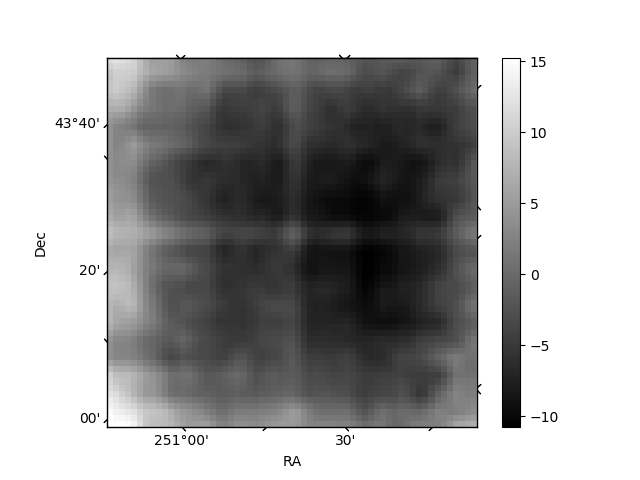
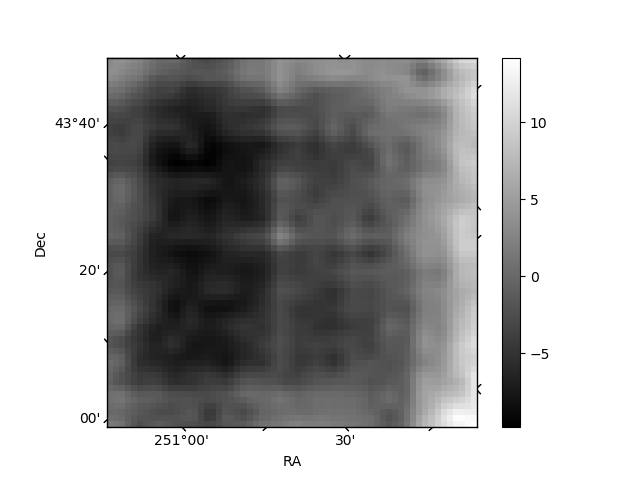
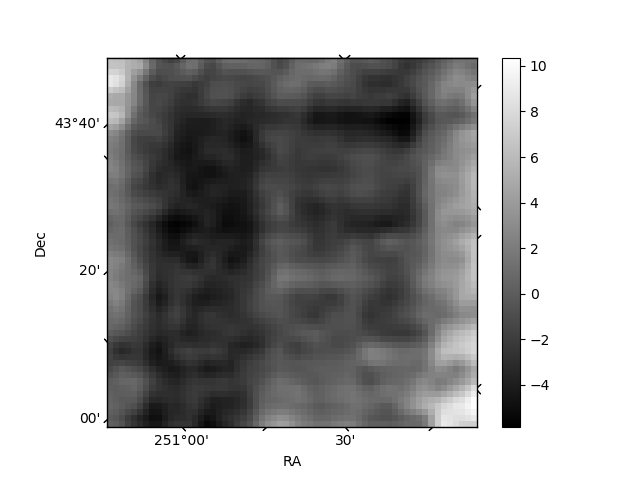
Histogram calculated using DETX and DETY for each event in the final _common_clean file
| Quadrant A | 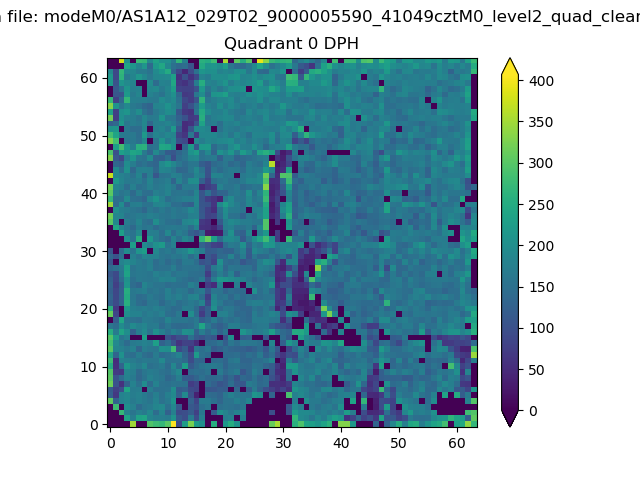 |
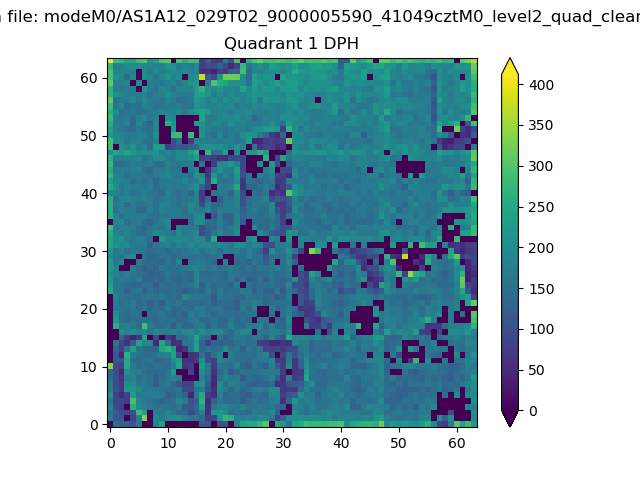 |
Quadrant B |
|---|---|---|---|
| Quadrant D | 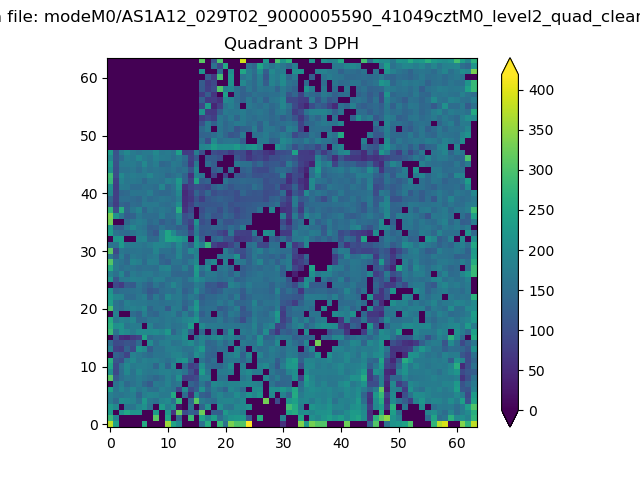 |
 |
Quadrant C |
| Plot type | Count rate plots | Images |
|---|---|---|
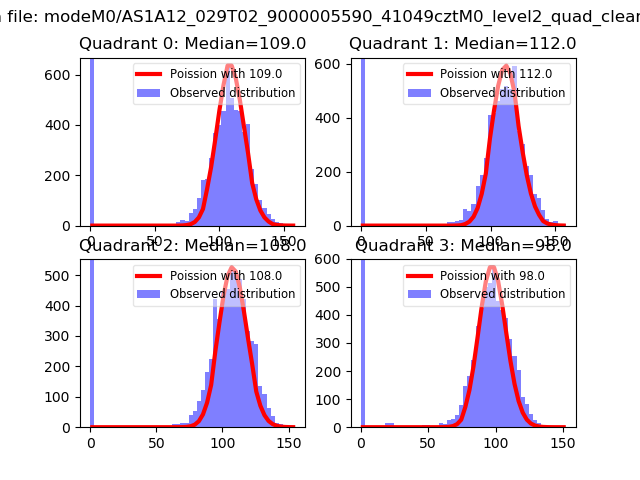
| Comparison with Poisson distribution Blue bars denote a histogram of data divided into 1 sec bins. Red curve is a Poisson curve with rate = median count rate of data. |
 |
 |
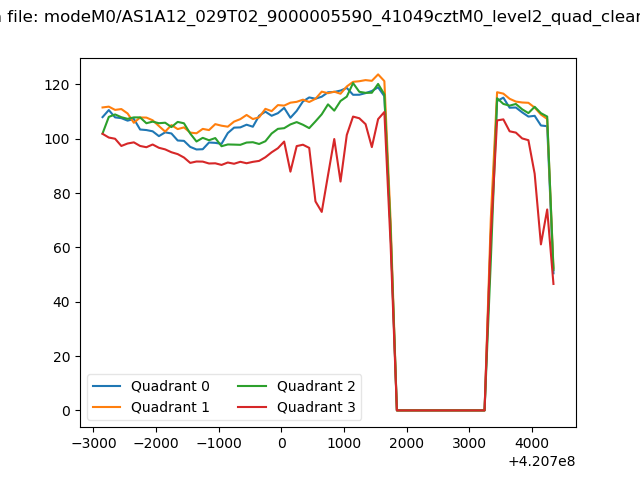
| Quadrant-wise count rates Data is divided into 100 sec bins |
 |
|
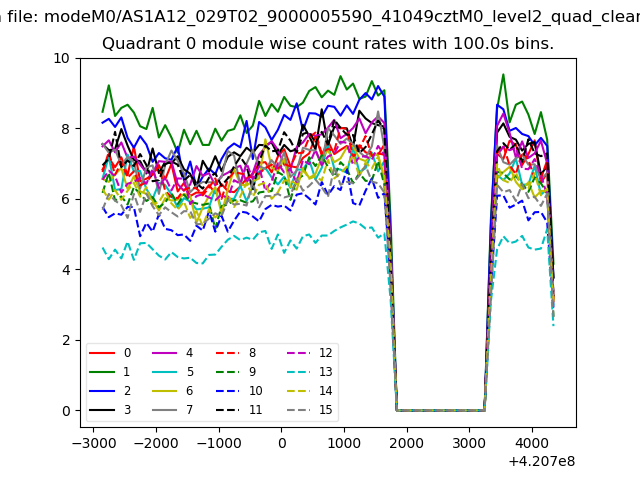
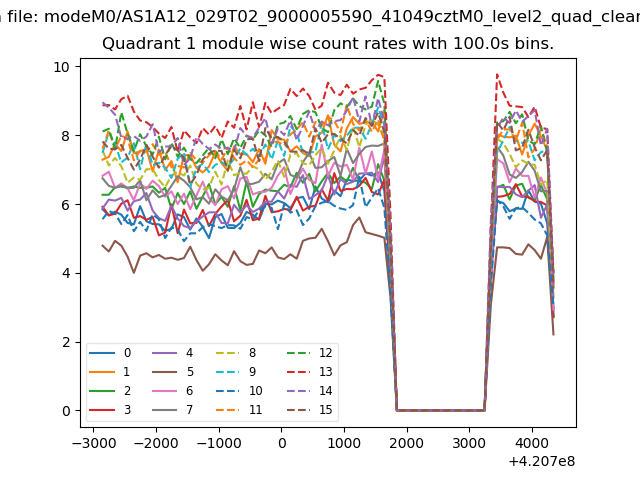
| Module-wise count rates for Quadrant A Data is divided into 100 sec bins |
 |
 |
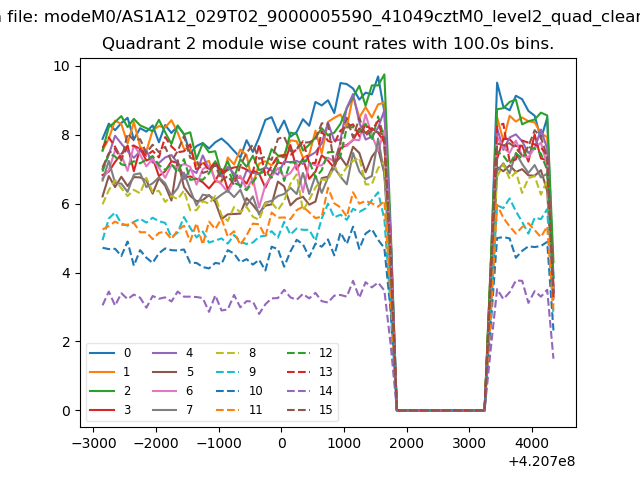
| Module-wise count rates for Quadrant B Data is divided into 100 sec bins |
 |
 |
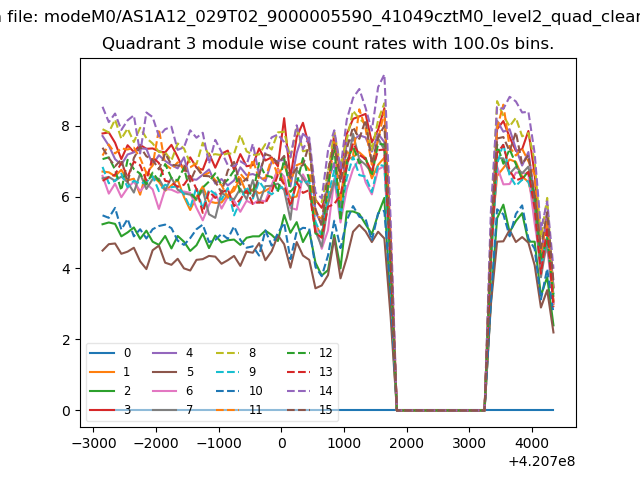
| Module-wise count rates for Quadrant C Data is divided into 100 sec bins |
 |
 |
| Module-wise count rates for Quadrant D Data is divided into 100 sec bins |
 |
 |
| Parameter | Plot |
|---|---|
| CZT HV Monitor | 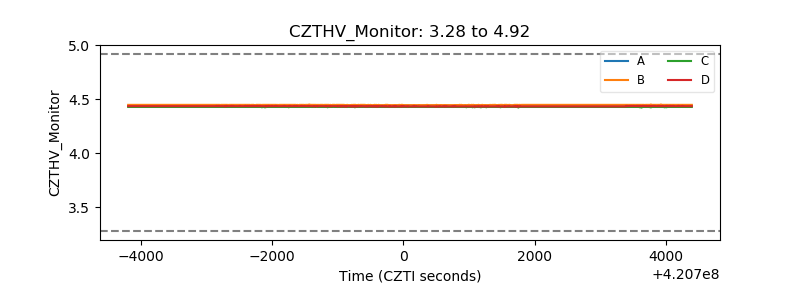 |
| D_VDD | 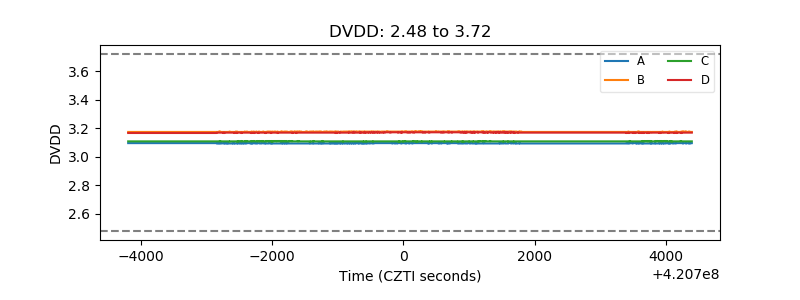 |
| Temperature 1 | 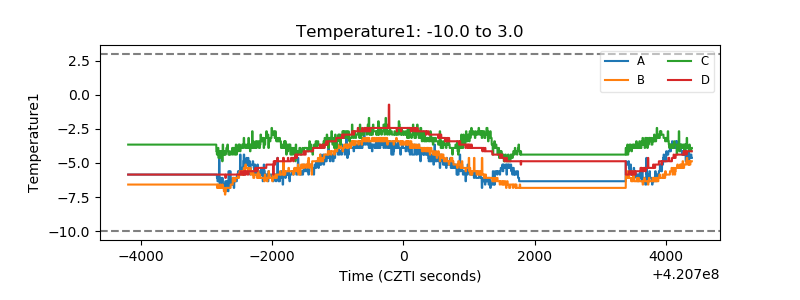 |
| Veto HV Monitor | 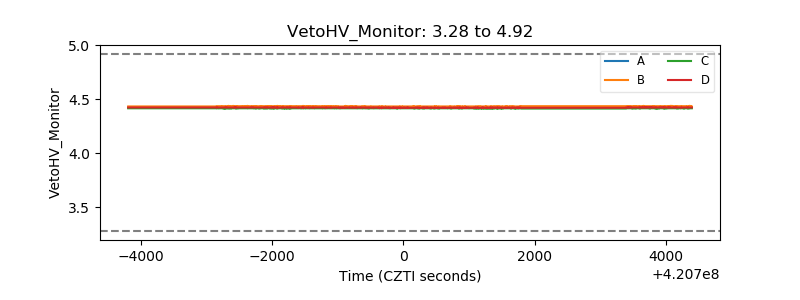 |
| Veto LLD |  |
| Alpha Counter | 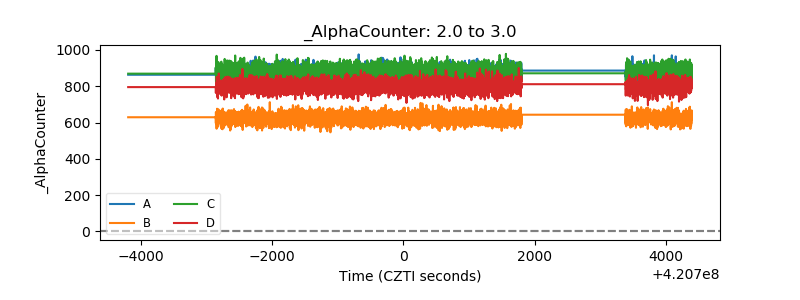 |
| _CPM_Rate | 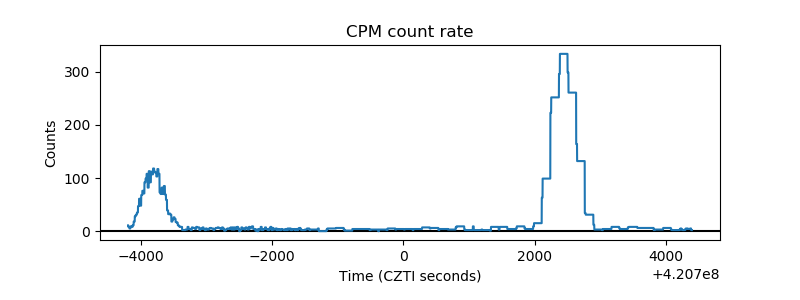 |
| CZT Counter | 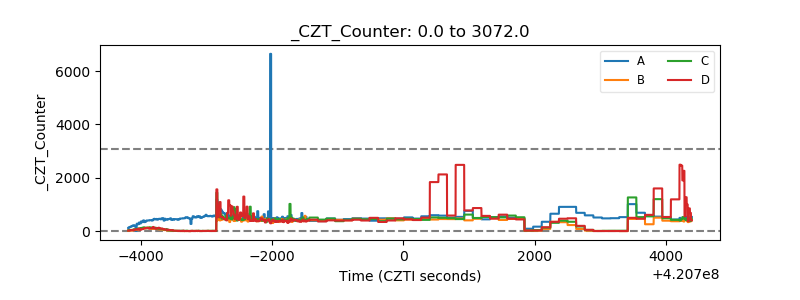 |
| +2.5 Volts monitor | 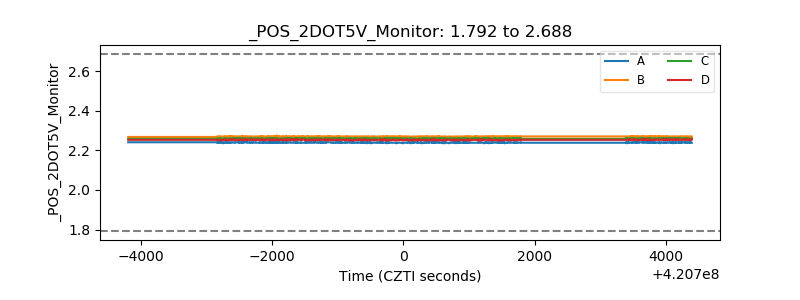 |
| +5 Volts monitor | 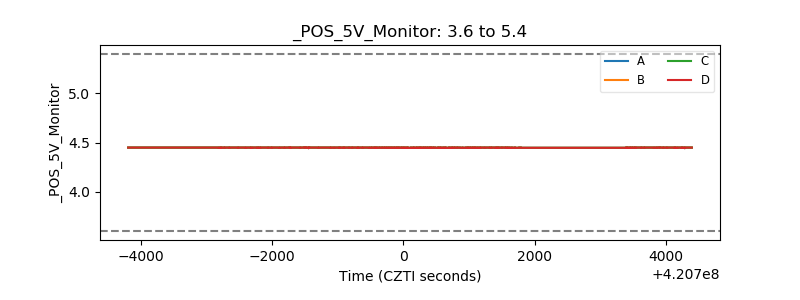 |
| _ROLL_ROT | 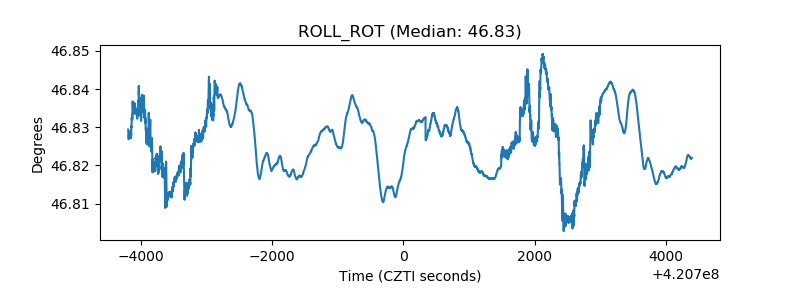 |
| _Roll_DEC | 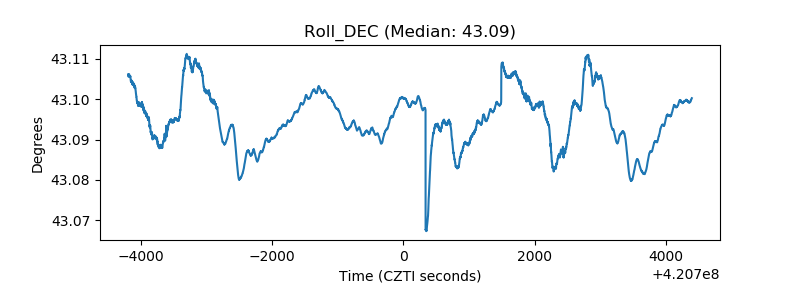 |
| _Roll_RA |  |
| Veto Counter | 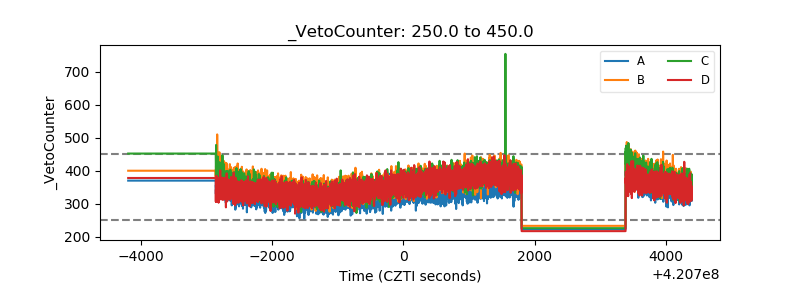 |