| Param | Original file | Final file |
|---|---|---|
| Filename | modeM0/AS1A12_029T02_9000005590_41050cztM0_level2.fits | modeM0/AS1A12_029T02_9000005590_41050cztM0_level2_quad_clean.evt |
| Size (bytes) | 356,348,160 | 91,992,960 |
| Size | 339.8 MB | 87.7 MB |
| Events in quadrant A | 2,988,598 | 621,345 |
| Events in quadrant B | 2,445,728 | 640,049 |
| Events in quadrant C | 2,943,036 | 606,669 |
| Events in quadrant D | 4,378,075 | 526,315 |
| Mode SS | |||
|---|---|---|---|
| Quadrant | BADHDUFLAG | Total packets | Discarded packets |
| A | 0 | 114 | 0 |
| B | 0 | 114 | 0 |
| C | 0 | 114 | 0 |
| D | 0 | 114 | 0 |
| Mode M0 | |||
|---|---|---|---|
| Quadrant | BADHDUFLAG | Total packets | Discarded packets |
| A | 0 | 12144 | 3 |
| B | 0 | 11193 | 2 |
| C | 0 | 12202 | 2 |
| D | 0 | 16889 | 2 |
| Mode M9 | |||
|---|---|---|---|
| Quadrant | BADHDUFLAG | Total packets | Discarded packets |
| A | 0 | 18 | 0 |
| B | 0 | 18 | 0 |
| C | 0 | 18 | 0 |
| D | 0 | 19 | 0 |
| Quadrant | Total seconds | Saturated seconds | Saturation percentage |
|---|---|---|---|
| A | 5591 | 11 | 0.196745% |
| B | 5591 | 8 | 0.143087% |
| C | 5591 | 66 | 1.180469% |
| D | 5591 | 466 | 8.334824% |
Noise dominated data is calculated using 1-second bins in cleaned event files. If a bin has >2000 counts, and if more than 50% of those come from <1% of pixels, then it is considered to be noise-dominated and hence unusable.
| Quadrant | # 1 sec bins | Bins with >0 counts | Bins with >2000 counts | High rate bins dominated by noise | Noise dominated (total time) | Noise dominated (detector-on time) | Marked lightcurve |
|---|---|---|---|---|---|---|---|
| A | 7293 | 5592 | 2 | 2 | 0.03% | 0.04% | 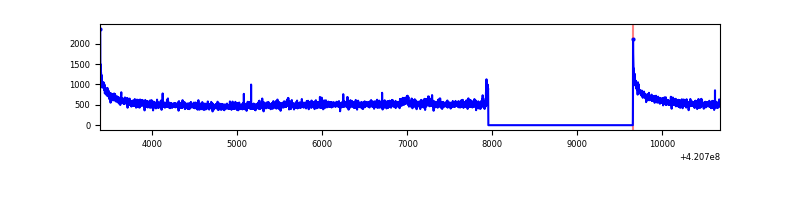 |
| B | 7293 | 5592 | 0 | 0 | 0.00% | 0.00% | 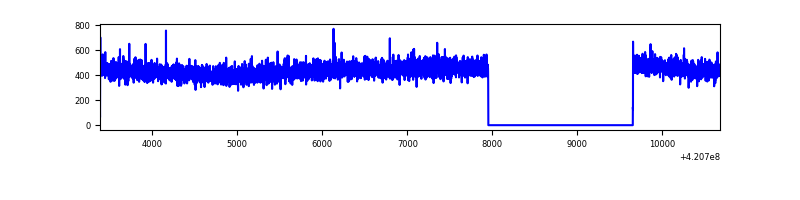 |
| C | 7293 | 5592 | 54 | 54 | 0.74% | 0.97% | 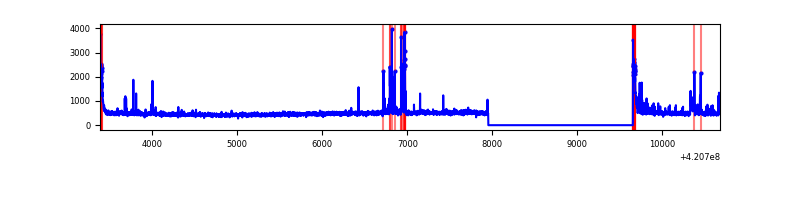 |
| D | 7293 | 5592 | 386 | 386 | 5.29% | 6.90% | 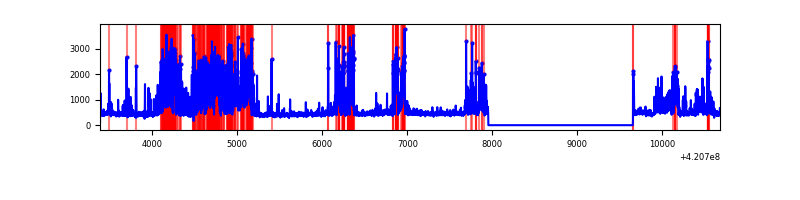 |
Top three noisy pixels from each quadrant. If the there are fewer than three noisy pixels in the level2.evt file, extra rows are filled as -1
| Pixel properties | Quadrant properties | ||||||
|---|---|---|---|---|---|---|---|
| Quadrant | DetID | PixID | Counts | Sigma | Mean | Median | Sigma |
| A | 10 | 83 | 515390 | 3987.37 | 628 | 617 | 129.1 |
| A | 12 | 189 | 38494 | 293.39 | 628 | 617 | 129.1 |
| A | 13 | 254 | 8802 | 63.4 | 628 | 617 | 129.1 |
| B | 12 | 111 | 15668 | 124.16 | 621 | 604 | 121.3 |
| B | 11 | 111 | 14505 | 114.57 | 621 | 604 | 121.3 |
| B | 14 | 111 | 14181 | 111.9 | 621 | 604 | 121.3 |
| C | 15 | 214 | 258928 | 1822.89 | 605 | 608 | 141.7 |
| C | 14 | 254 | 186872 | 1314.41 | 605 | 608 | 141.7 |
| C | 0 | 10 | 129308 | 908.2 | 605 | 608 | 141.7 |
| D | 13 | 249 | 1805042 | 12374.94 | 593 | 574 | 145.8 |
| D | 1 | 47 | 114498 | 781.28 | 593 | 574 | 145.8 |
| D | 12 | 0 | 72187 | 491.12 | 593 | 574 | 145.8 |
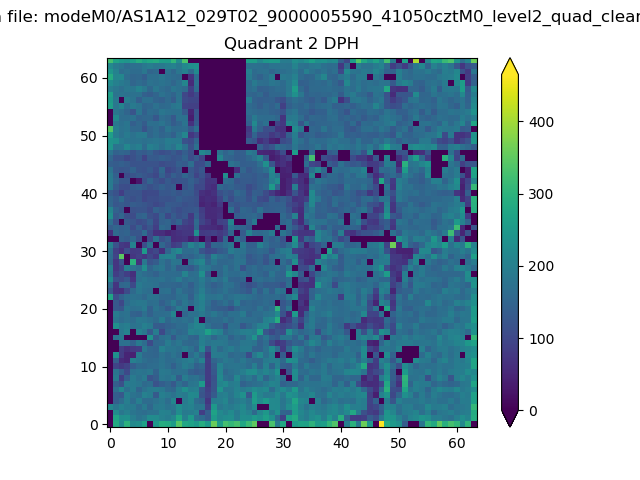
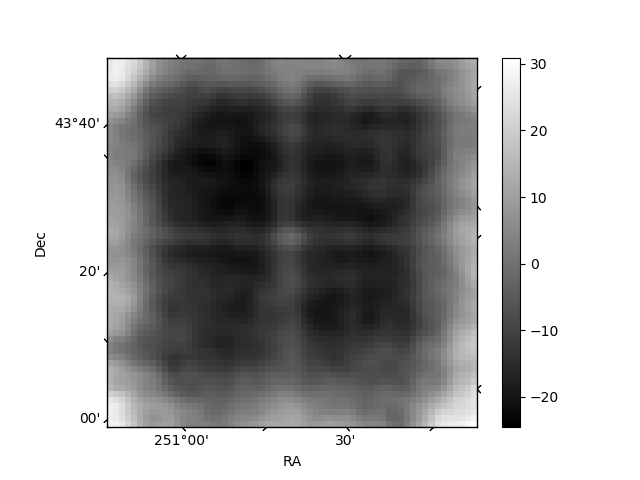
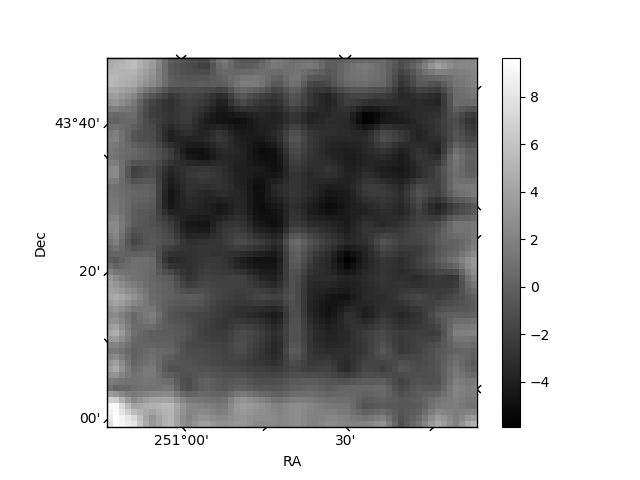
Histogram calculated using DETX and DETY for each event in the final _common_clean file
| Quadrant A | 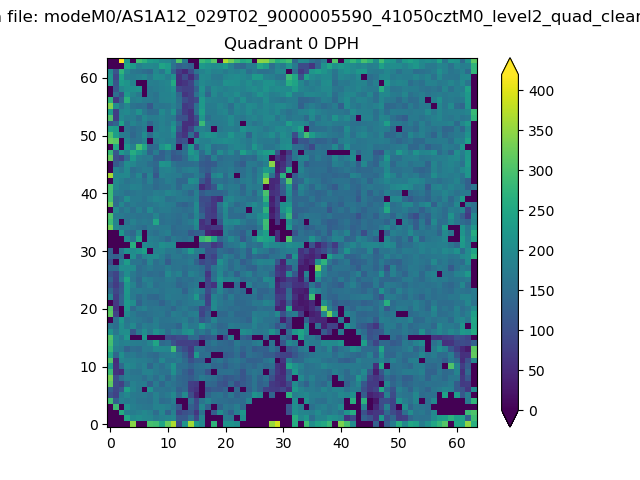 |
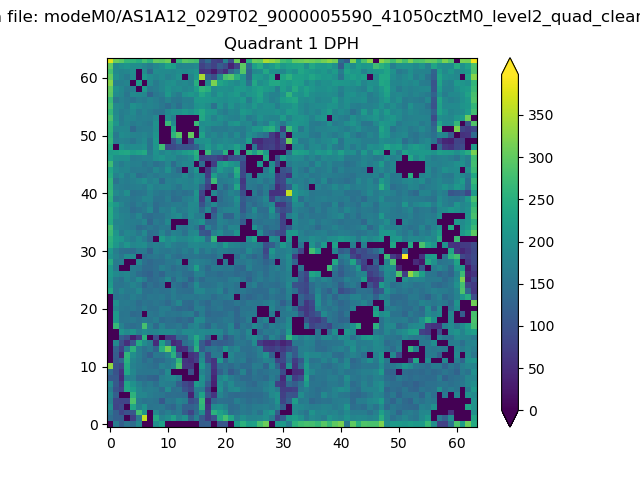 |
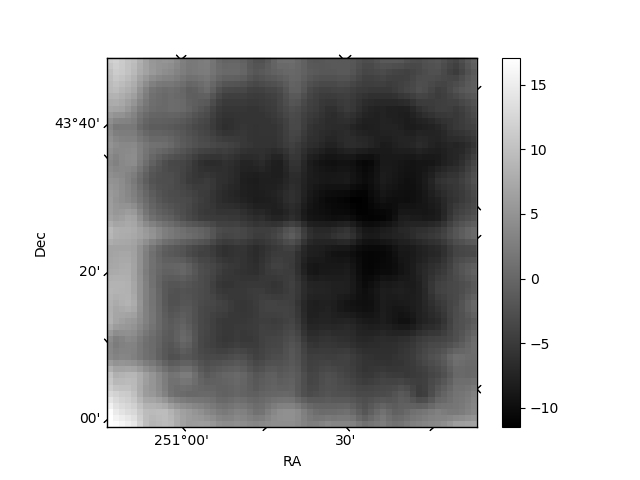
Quadrant B |
|---|---|---|---|
| Quadrant D | 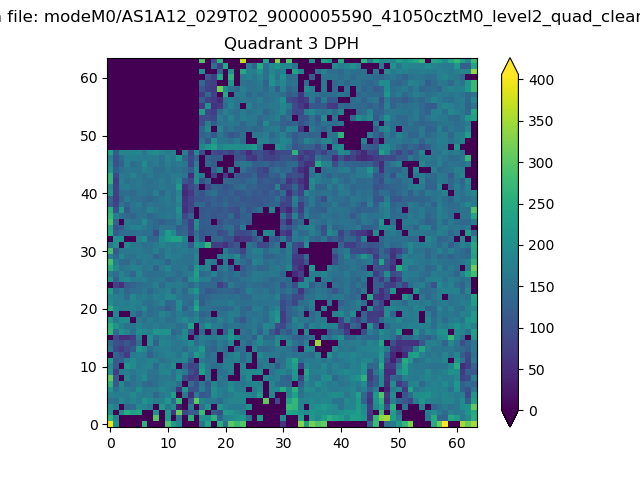 |
 |
Quadrant C |
| Plot type | Count rate plots | Images |
|---|---|---|
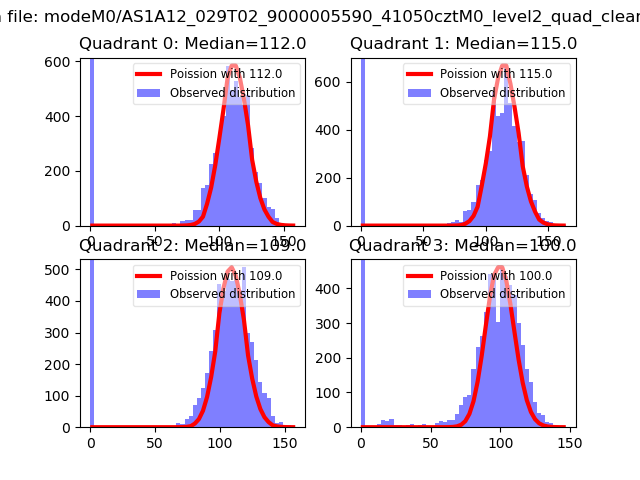
| Comparison with Poisson distribution Blue bars denote a histogram of data divided into 1 sec bins. Red curve is a Poisson curve with rate = median count rate of data. |
 |
 |
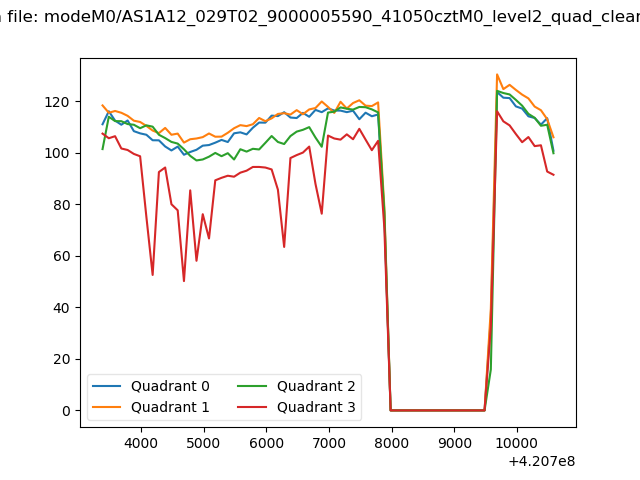
| Quadrant-wise count rates Data is divided into 100 sec bins |
 |
|
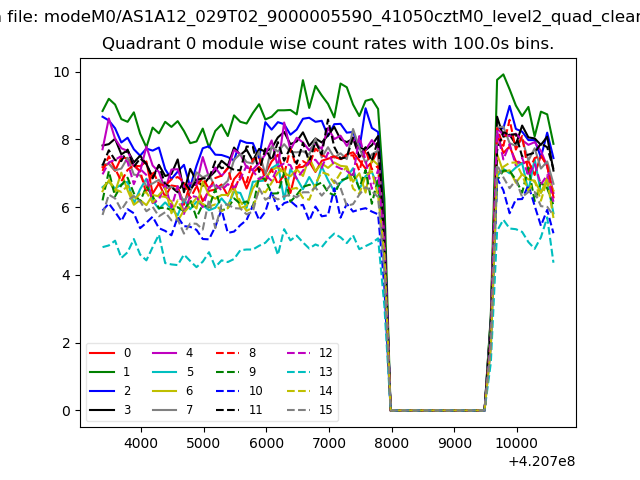
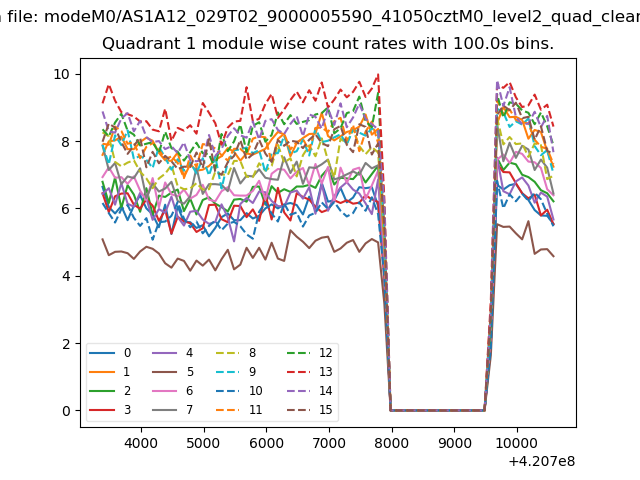
| Module-wise count rates for Quadrant A Data is divided into 100 sec bins |
 |
 |
| Module-wise count rates for Quadrant B Data is divided into 100 sec bins |
 |
 |
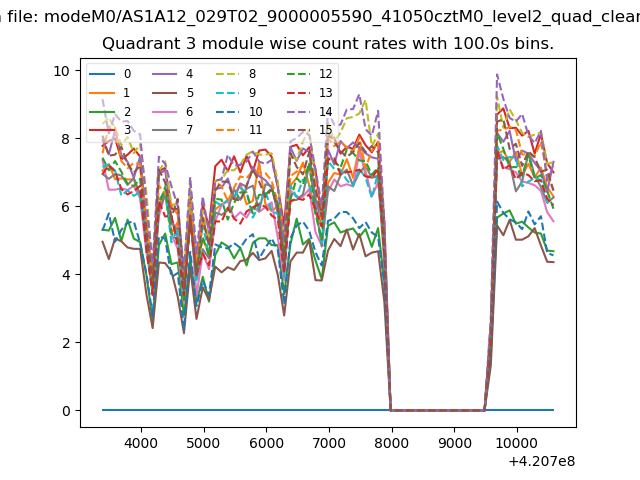
| Module-wise count rates for Quadrant C Data is divided into 100 sec bins |
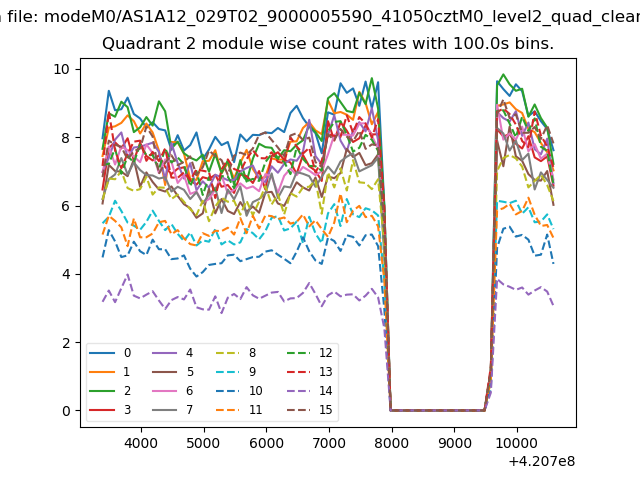 |
 |
| Module-wise count rates for Quadrant D Data is divided into 100 sec bins |
 |
 |
| Parameter | Plot |
|---|---|
| CZT HV Monitor | 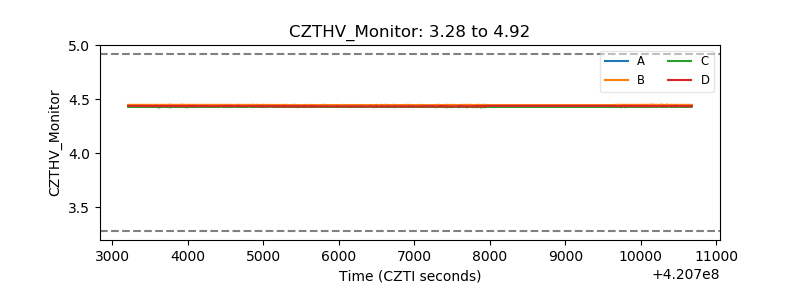 |
| D_VDD | 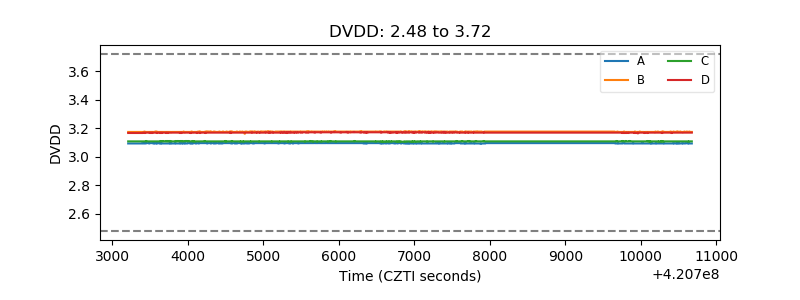 |
| Temperature 1 | 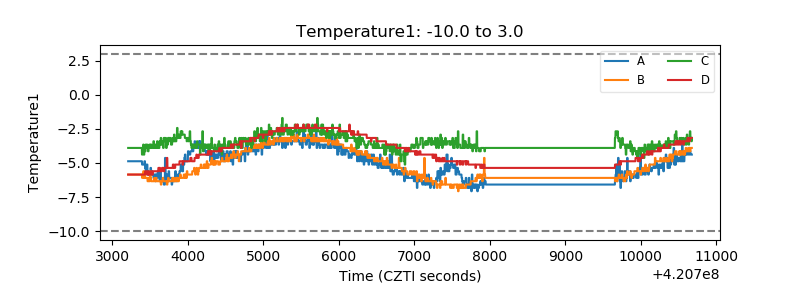 |
| Veto HV Monitor | 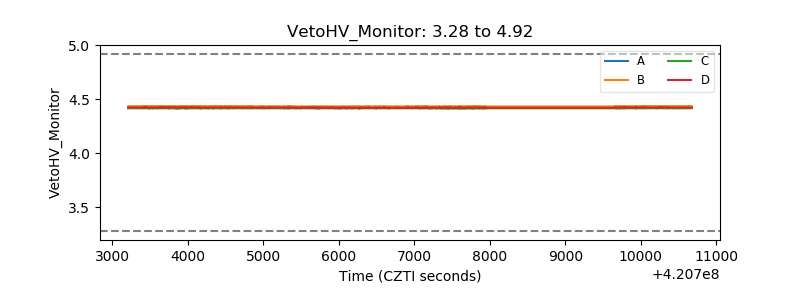 |
| Veto LLD | 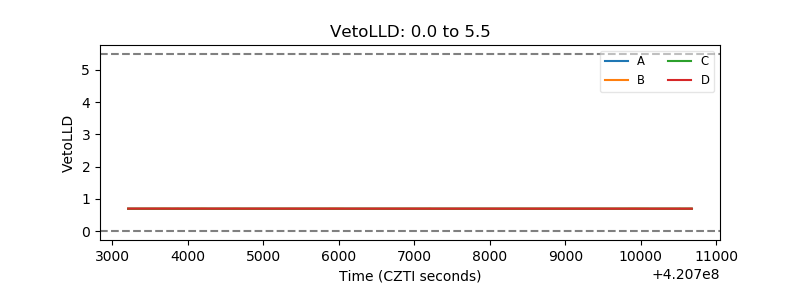 |
| Alpha Counter | 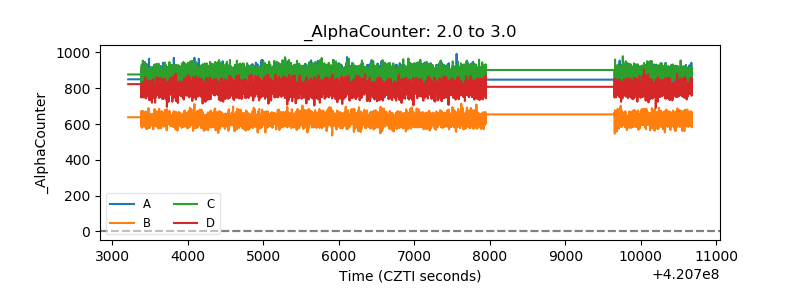 |
| _CPM_Rate |  |
| CZT Counter | 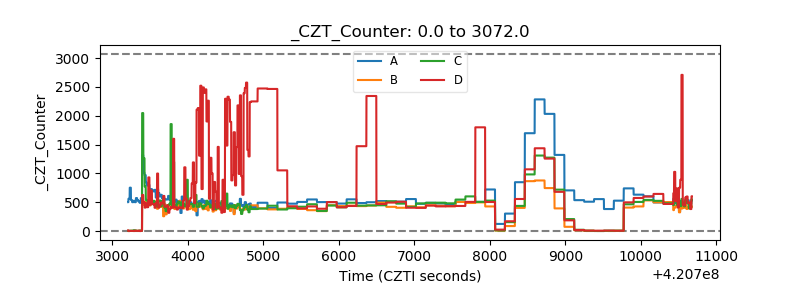 |
| +2.5 Volts monitor | 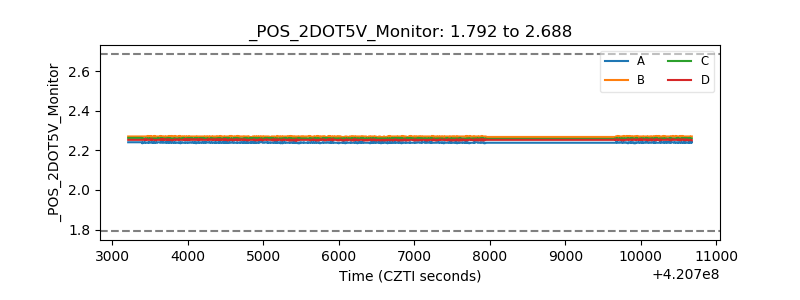 |
| +5 Volts monitor |  |
| _ROLL_ROT | 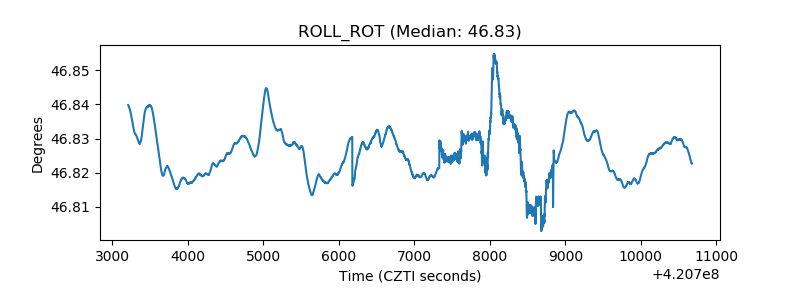 |
| _Roll_DEC | 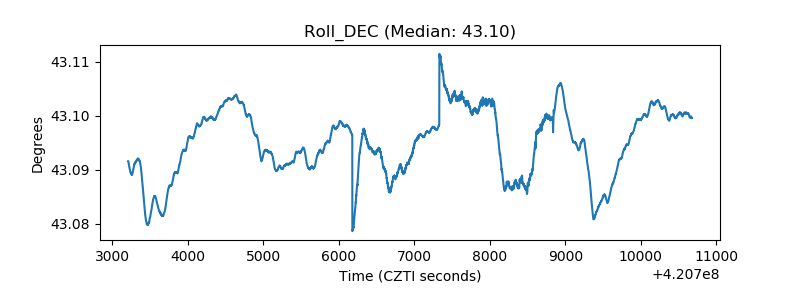 |
| _Roll_RA | 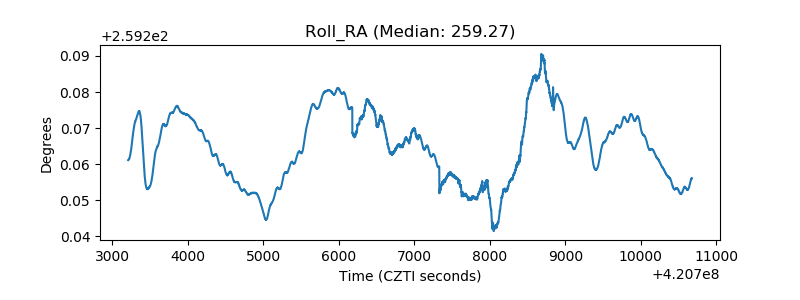 |
| Veto Counter | 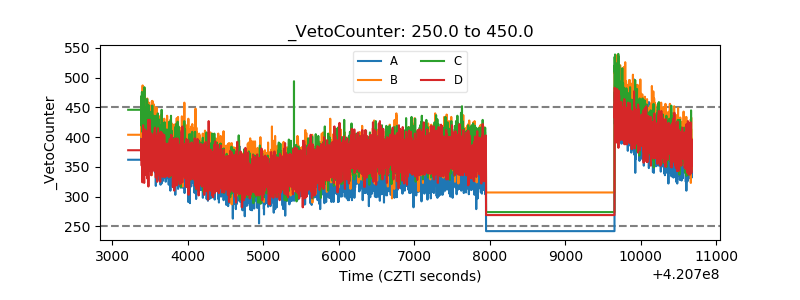 |