| Param | Original file | Final file |
|---|---|---|
| Filename | modeM0/AS1A12_029T02_9000005590_41052cztM0_level2.fits | modeM0/AS1A12_029T02_9000005590_41052cztM0_level2_quad_clean.evt |
| Size (bytes) | 317,505,600 | 91,555,200 |
| Size | 302.8 MB | 87.3 MB |
| Events in quadrant A | 2,933,789 | 619,834 |
| Events in quadrant B | 2,397,327 | 639,349 |
| Events in quadrant C | 3,091,637 | 588,074 |
| Events in quadrant D | 2,916,290 | 553,312 |
| Mode SS | |||
|---|---|---|---|
| Quadrant | BADHDUFLAG | Total packets | Discarded packets |
| A | 0 | 108 | 0 |
| B | 0 | 108 | 0 |
| C | 0 | 108 | 0 |
| D | 0 | 108 | 0 |
| Mode M0 | |||
|---|---|---|---|
| Quadrant | BADHDUFLAG | Total packets | Discarded packets |
| A | 0 | 11866 | 3 |
| B | 0 | 10654 | 2 |
| C | 0 | 12321 | 2 |
| D | 0 | 12339 | 2 |
| Mode M9 | |||
|---|---|---|---|
| Quadrant | BADHDUFLAG | Total packets | Discarded packets |
| A | 0 | 21 | 0 |
| B | 0 | 21 | 0 |
| C | 0 | 21 | 0 |
| D | 0 | 22 | 0 |
| Quadrant | Total seconds | Saturated seconds | Saturation percentage |
|---|---|---|---|
| A | 5310 | 17 | 0.320151% |
| B | 5310 | 5 | 0.094162% |
| C | 5310 | 152 | 2.862524% |
| D | 5310 | 52 | 0.979284% |
Noise dominated data is calculated using 1-second bins in cleaned event files. If a bin has >2000 counts, and if more than 50% of those come from <1% of pixels, then it is considered to be noise-dominated and hence unusable.
| Quadrant | # 1 sec bins | Bins with >0 counts | Bins with >2000 counts | High rate bins dominated by noise | Noise dominated (total time) | Noise dominated (detector-on time) | Marked lightcurve |
|---|---|---|---|---|---|---|---|
| A | 7163 | 5311 | 3 | 3 | 0.04% | 0.06% | 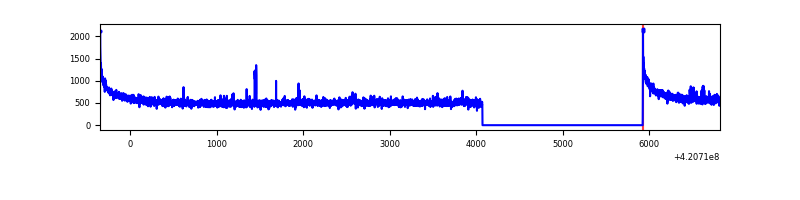 |
| B | 7163 | 5311 | 0 | 0 | 0.00% | 0.00% | 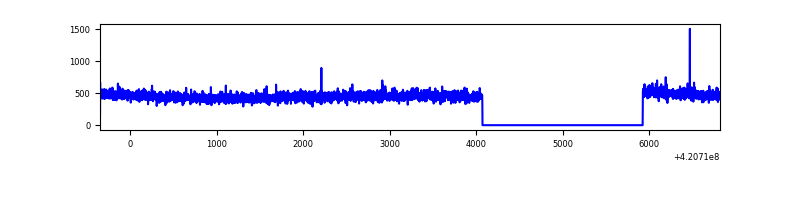 |
| C | 7163 | 5311 | 133 | 133 | 1.86% | 2.50% | 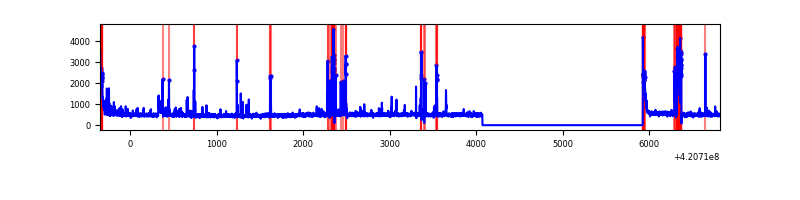 |
| D | 7163 | 5311 | 43 | 43 | 0.60% | 0.81% | 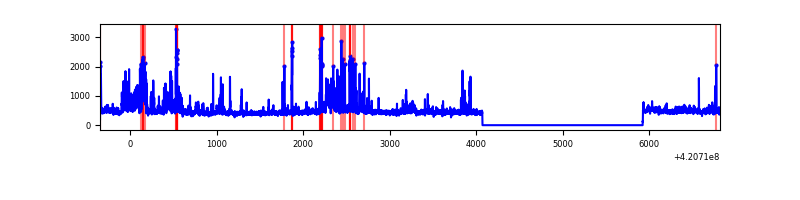 |
Top three noisy pixels from each quadrant. If the there are fewer than three noisy pixels in the level2.evt file, extra rows are filled as -1
| Pixel properties | Quadrant properties | ||||||
|---|---|---|---|---|---|---|---|
| Quadrant | DetID | PixID | Counts | Sigma | Mean | Median | Sigma |
| A | 10 | 83 | 487099 | 3855.76 | 616 | 604 | 126.2 |
| A | 12 | 189 | 55688 | 436.57 | 616 | 604 | 126.2 |
| A | 13 | 254 | 8096 | 59.38 | 616 | 604 | 126.2 |
| B | 12 | 111 | 15022 | 121.9 | 607 | 590 | 118.4 |
| B | 11 | 111 | 13942 | 112.78 | 607 | 590 | 118.4 |
| B | 14 | 111 | 13747 | 111.13 | 607 | 590 | 118.4 |
| C | 14 | 254 | 430445 | 3157.58 | 584 | 588 | 136.1 |
| C | 15 | 214 | 245370 | 1798.08 | 584 | 588 | 136.1 |
| C | 0 | 10 | 130484 | 954.17 | 584 | 588 | 136.1 |
| D | 13 | 249 | 524133 | 3638.92 | 594 | 576 | 143.9 |
| D | 13 | 171 | 46063 | 316.15 | 594 | 576 | 143.9 |
| D | 2 | 234 | 20903 | 141.28 | 594 | 576 | 143.9 |
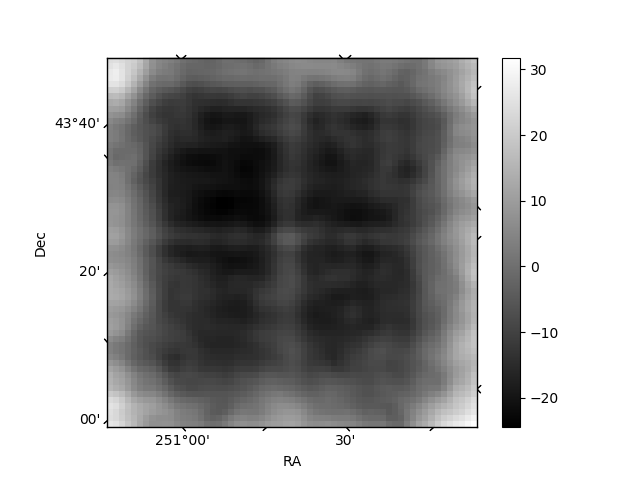
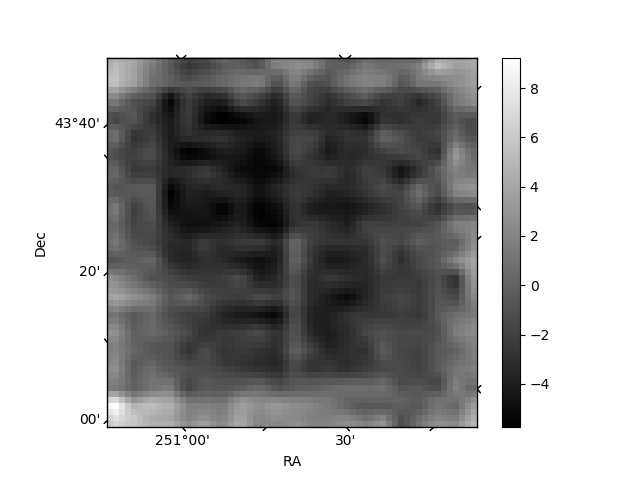
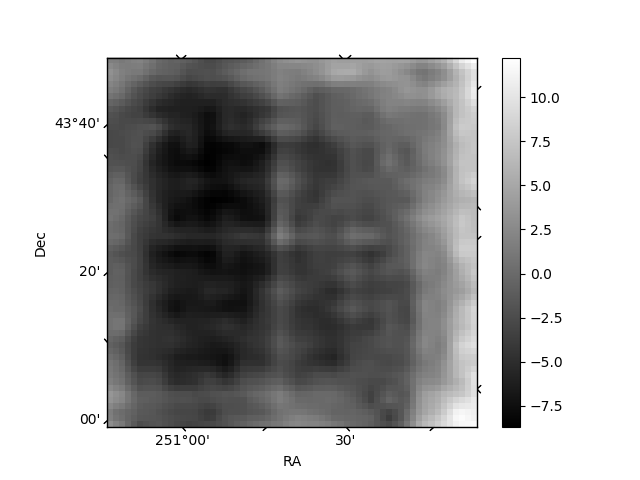
Histogram calculated using DETX and DETY for each event in the final _common_clean file
| Quadrant A | 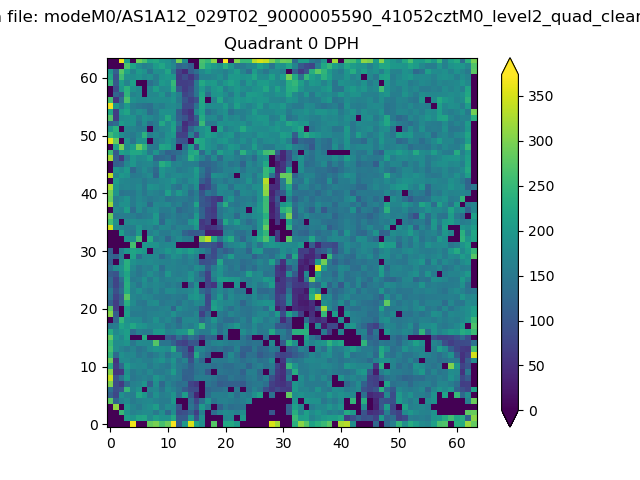 |
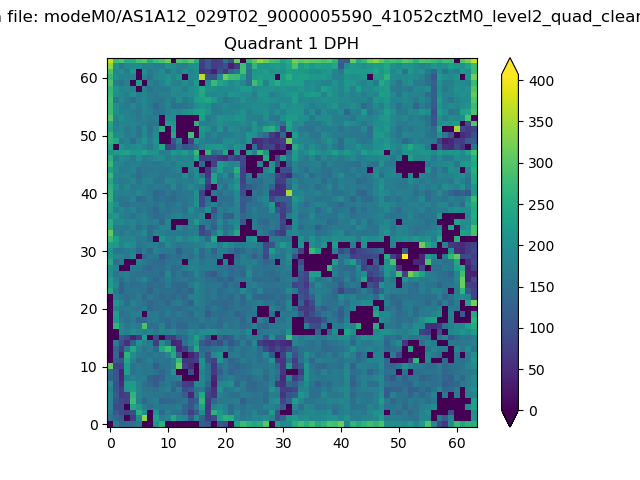 |
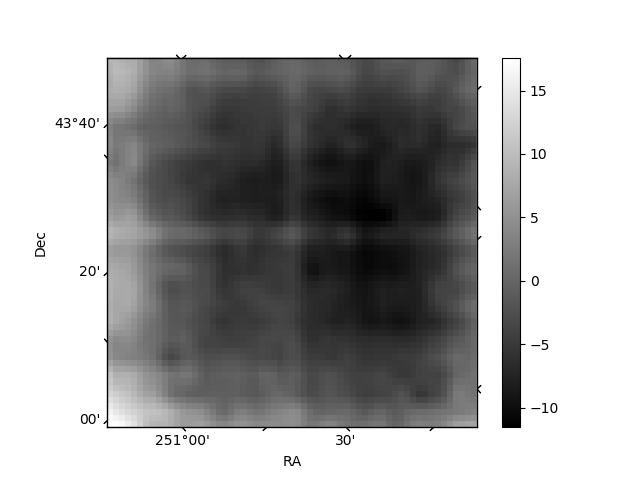
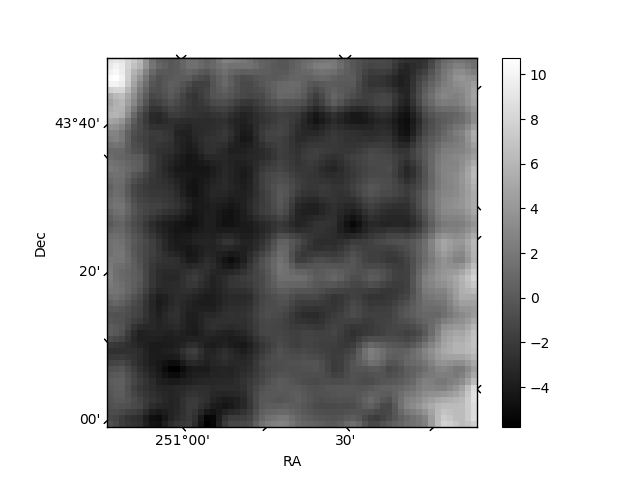
Quadrant B |
|---|---|---|---|
| Quadrant D | 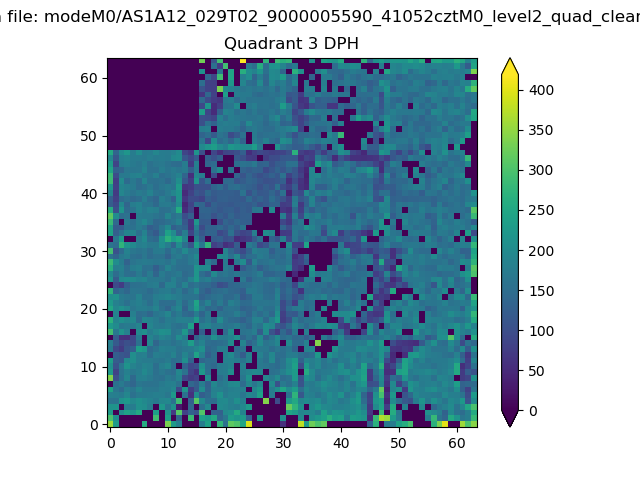 |
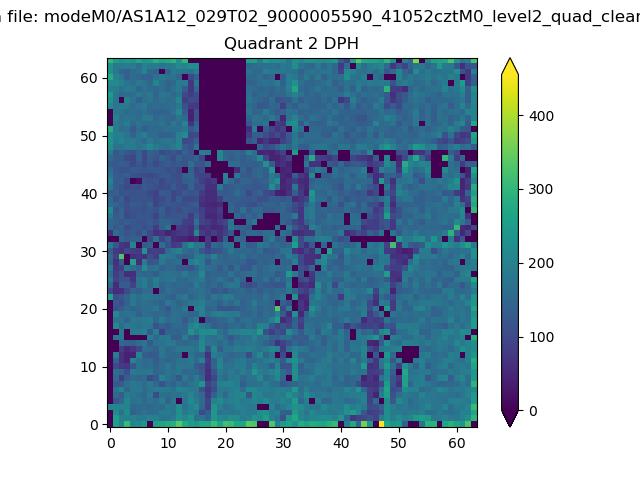 |
Quadrant C |
| Plot type | Count rate plots | Images |
|---|---|---|
| Comparison with Poisson distribution Blue bars denote a histogram of data divided into 1 sec bins. Red curve is a Poisson curve with rate = median count rate of data. |
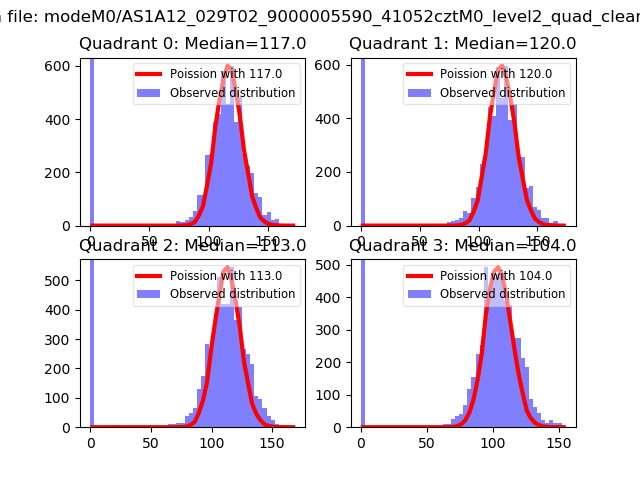 |
 |
| Quadrant-wise count rates Data is divided into 100 sec bins |
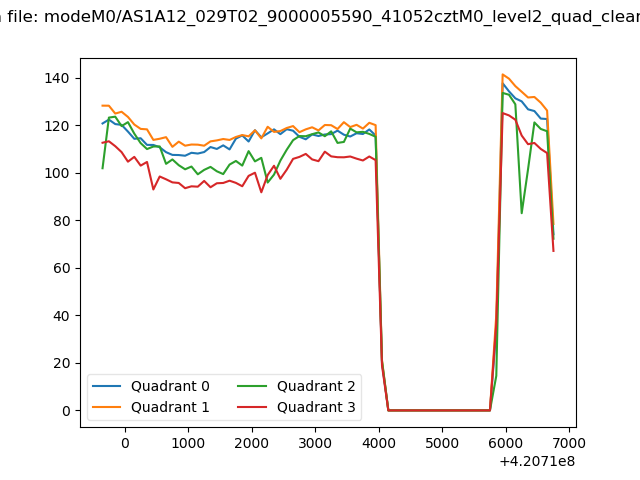 |
|
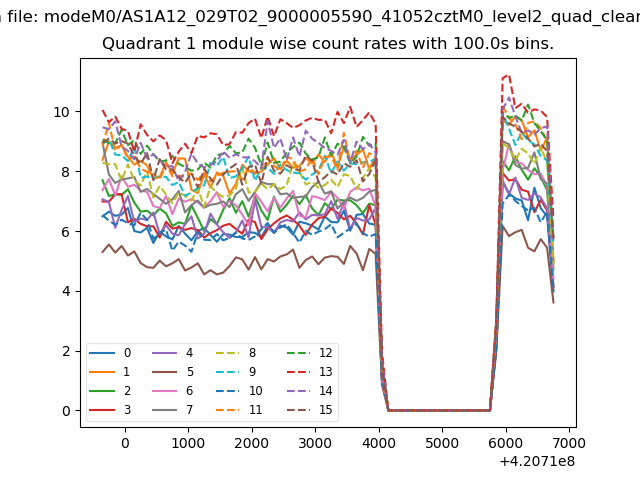
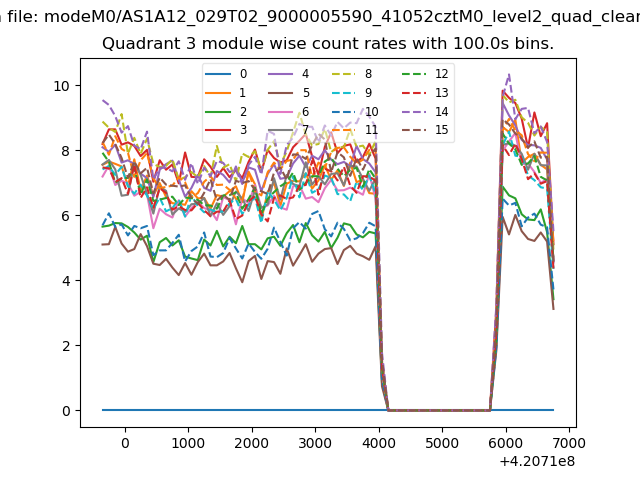
| Module-wise count rates for Quadrant A Data is divided into 100 sec bins |
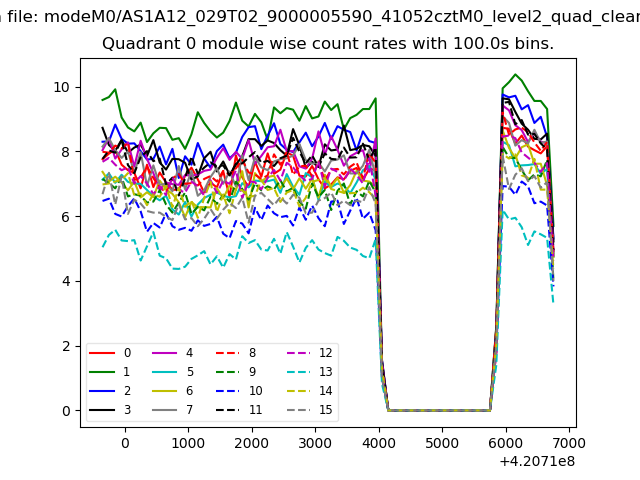 |
 |
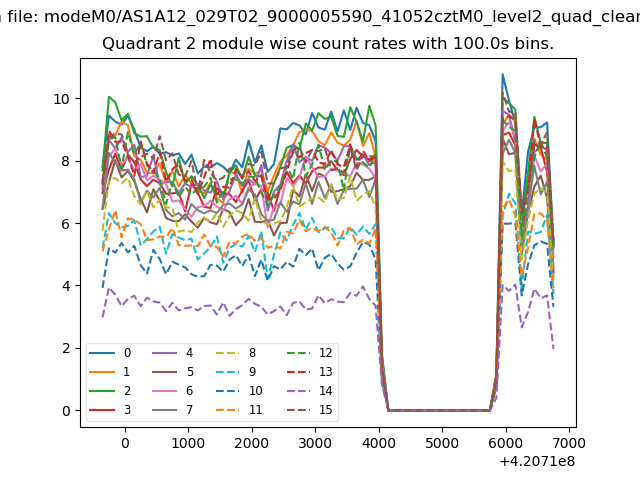
| Module-wise count rates for Quadrant B Data is divided into 100 sec bins |
 |
 |
| Module-wise count rates for Quadrant C Data is divided into 100 sec bins |
 |
 |
| Module-wise count rates for Quadrant D Data is divided into 100 sec bins |
 |
 |
| Parameter | Plot |
|---|---|
| CZT HV Monitor | 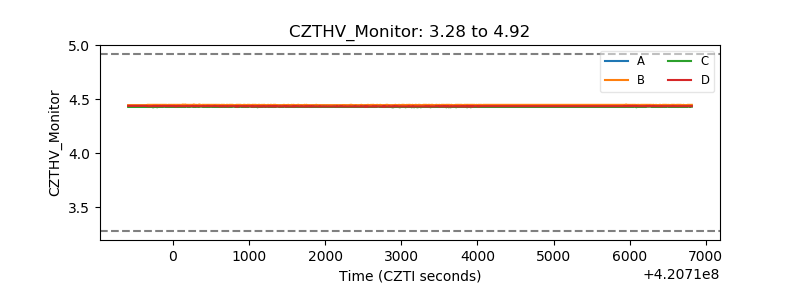 |
| D_VDD | 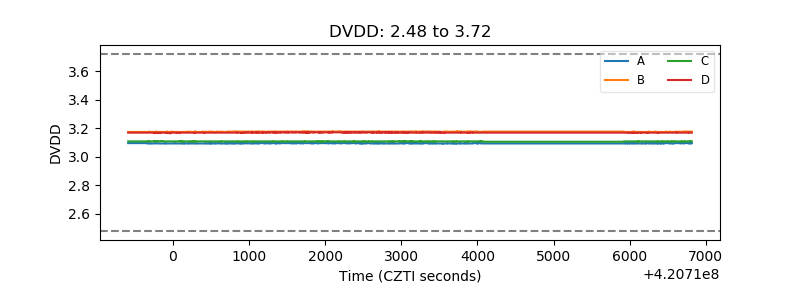 |
| Temperature 1 | 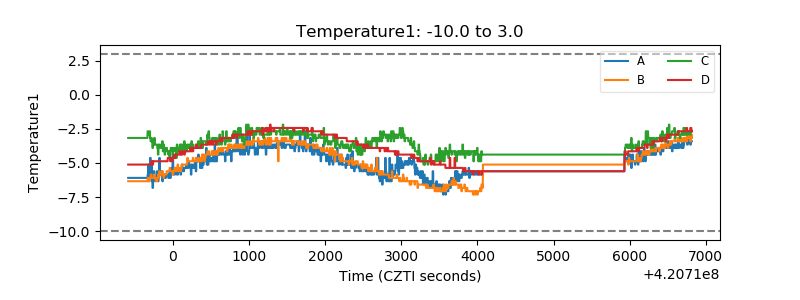 |
| Veto HV Monitor | 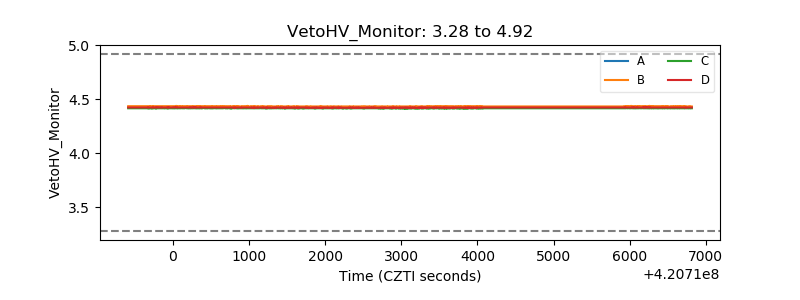 |
| Veto LLD | 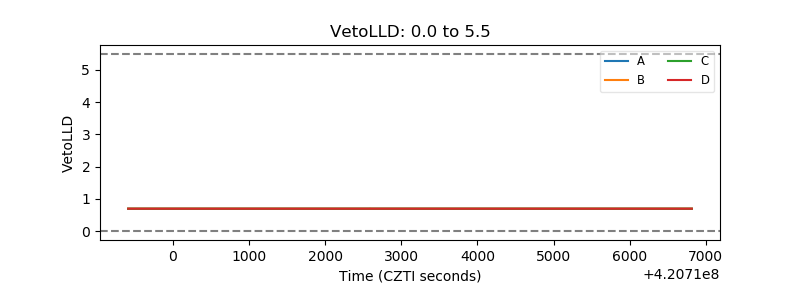 |
| Alpha Counter | 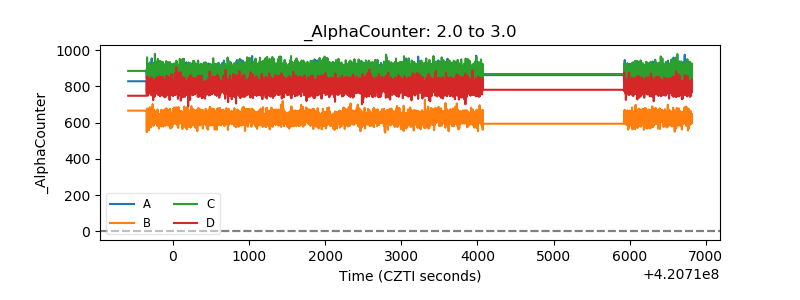 |
| _CPM_Rate | 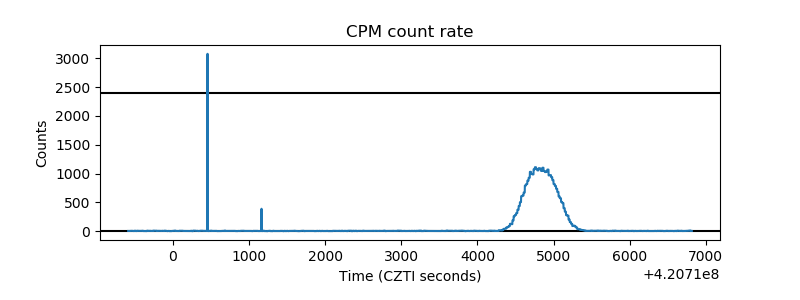 |
| CZT Counter | 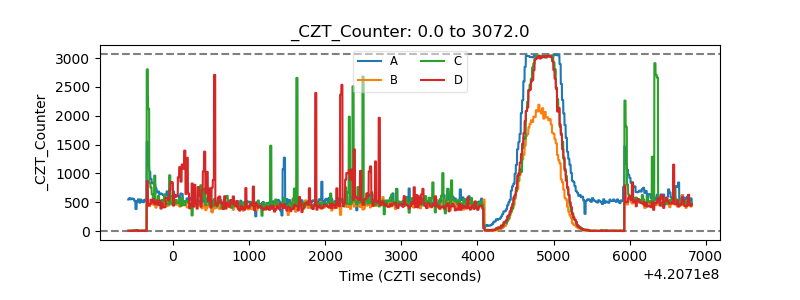 |
| +2.5 Volts monitor |  |
| +5 Volts monitor |  |
| _ROLL_ROT | 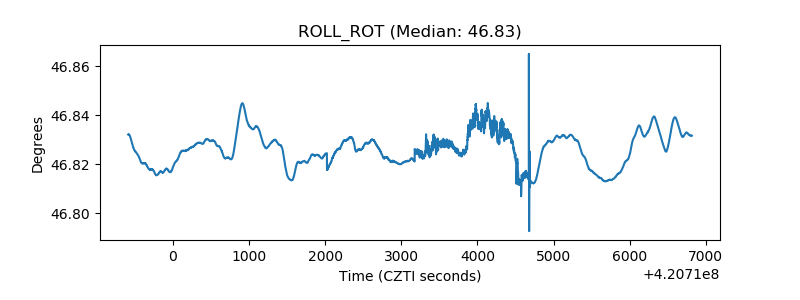 |
| _Roll_DEC | 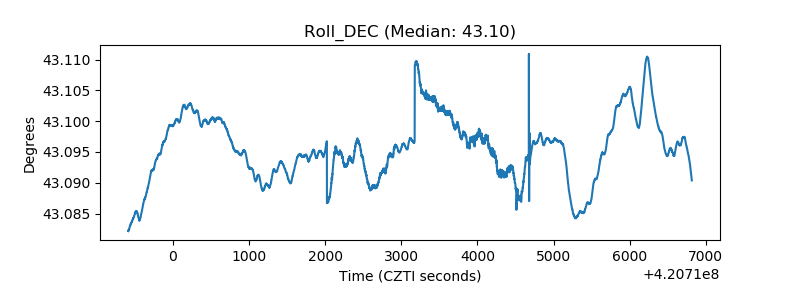 |
| _Roll_RA | 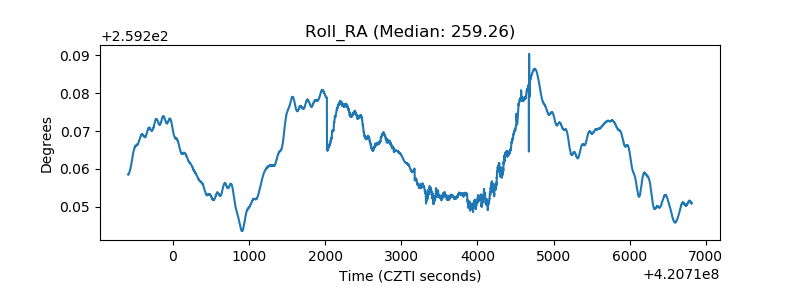 |
| Veto Counter | 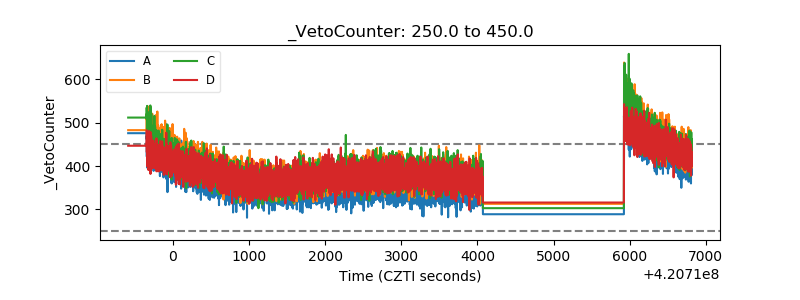 |