| Param | Original file | Final file |
|---|---|---|
| Filename | modeM0/AS1A12_029T02_9000005590_41053cztM0_level2.fits | modeM0/AS1A12_029T02_9000005590_41053cztM0_level2_quad_clean.evt |
| Size (bytes) | 322,899,840 | 96,151,680 |
| Size | 307.9 MB | 91.7 MB |
| Events in quadrant A | 3,023,404 | 660,832 |
| Events in quadrant B | 2,558,805 | 677,423 |
| Events in quadrant C | 3,107,773 | 616,369 |
| Events in quadrant D | 2,848,602 | 584,472 |
| Mode SS | |||
|---|---|---|---|
| Quadrant | BADHDUFLAG | Total packets | Discarded packets |
| A | 0 | 110 | 0 |
| B | 0 | 110 | 0 |
| C | 0 | 110 | 0 |
| D | 0 | 110 | 0 |
| Mode M0 | |||
|---|---|---|---|
| Quadrant | BADHDUFLAG | Total packets | Discarded packets |
| A | 0 | 12170 | 3 |
| B | 0 | 10915 | 2 |
| C | 0 | 12237 | 2 |
| D | 0 | 11965 | 2 |
| Mode M9 | |||
|---|---|---|---|
| Quadrant | BADHDUFLAG | Total packets | Discarded packets |
| A | 0 | 29 | 0 |
| B | 0 | 29 | 0 |
| C | 0 | 29 | 0 |
| D | 0 | 30 | 0 |
| Quadrant | Total seconds | Saturated seconds | Saturation percentage |
|---|---|---|---|
| A | 5314 | 17 | 0.319910% |
| B | 5314 | 16 | 0.301091% |
| C | 5314 | 158 | 2.973278% |
| D | 5314 | 50 | 0.940911% |
Noise dominated data is calculated using 1-second bins in cleaned event files. If a bin has >2000 counts, and if more than 50% of those come from <1% of pixels, then it is considered to be noise-dominated and hence unusable.
| Quadrant | # 1 sec bins | Bins with >0 counts | Bins with >2000 counts | High rate bins dominated by noise | Noise dominated (total time) | Noise dominated (detector-on time) | Marked lightcurve |
|---|---|---|---|---|---|---|---|
| A | 7287 | 5315 | 3 | 3 | 0.04% | 0.06% | 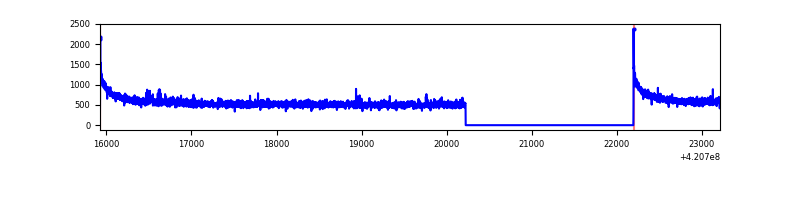 |
| B | 7287 | 5315 | 3 | 3 | 0.04% | 0.06% | 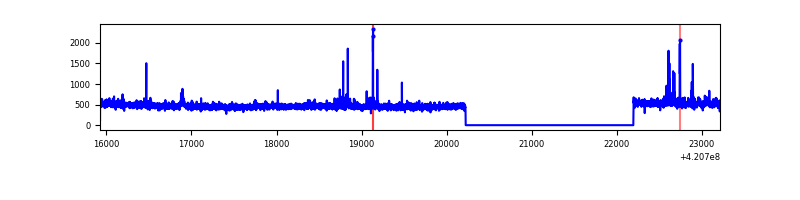 |
| C | 7287 | 5315 | 143 | 143 | 1.96% | 2.69% | 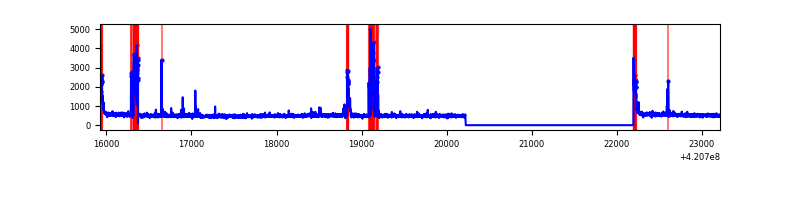 |
| D | 7287 | 5315 | 40 | 40 | 0.55% | 0.75% | 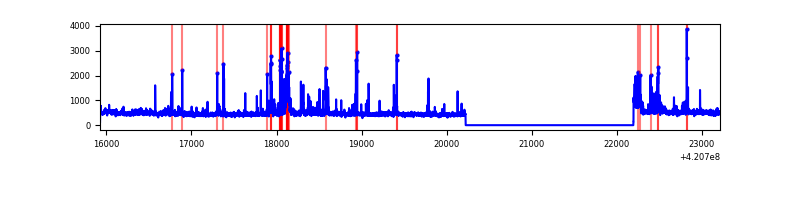 |
Top three noisy pixels from each quadrant. If the there are fewer than three noisy pixels in the level2.evt file, extra rows are filled as -1
| Pixel properties | Quadrant properties | ||||||
|---|---|---|---|---|---|---|---|
| Quadrant | DetID | PixID | Counts | Sigma | Mean | Median | Sigma |
| A | 10 | 83 | 498700 | 3832.2 | 638 | 625 | 130.0 |
| A | 12 | 189 | 54303 | 413.0 | 638 | 625 | 130.0 |
| A | 13 | 254 | 7711 | 54.52 | 638 | 625 | 130.0 |
| B | 0 | 190 | 53143 | 438.37 | 627 | 612 | 119.8 |
| B | 0 | 229 | 27960 | 228.22 | 627 | 612 | 119.8 |
| B | 4 | 81 | 16004 | 128.44 | 627 | 612 | 119.8 |
| C | 14 | 254 | 379785 | 2701.07 | 605 | 610 | 140.4 |
| C | 15 | 214 | 244398 | 1736.63 | 605 | 610 | 140.4 |
| C | 0 | 10 | 124067 | 879.45 | 605 | 610 | 140.4 |
| D | 13 | 249 | 298470 | 1990.99 | 617 | 599 | 149.6 |
| D | 13 | 171 | 48343 | 319.12 | 617 | 599 | 149.6 |
| D | 12 | 79 | 45206 | 298.16 | 617 | 599 | 149.6 |
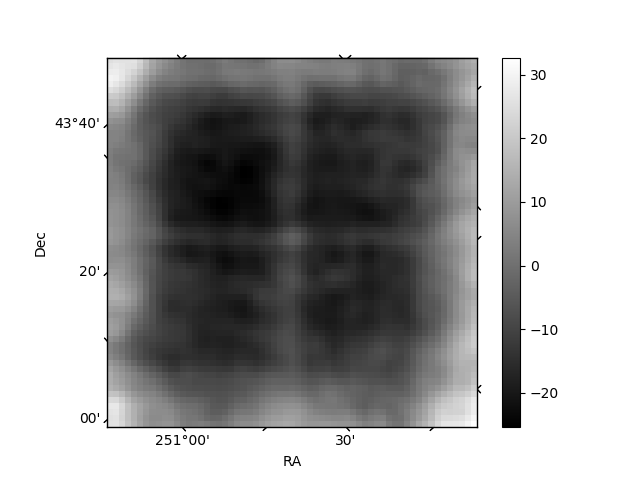
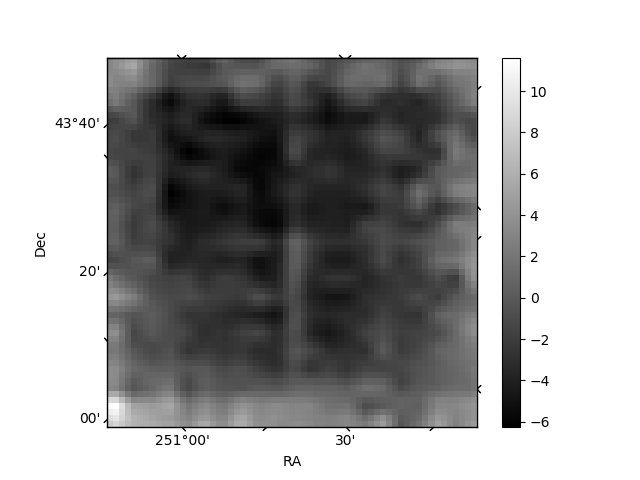
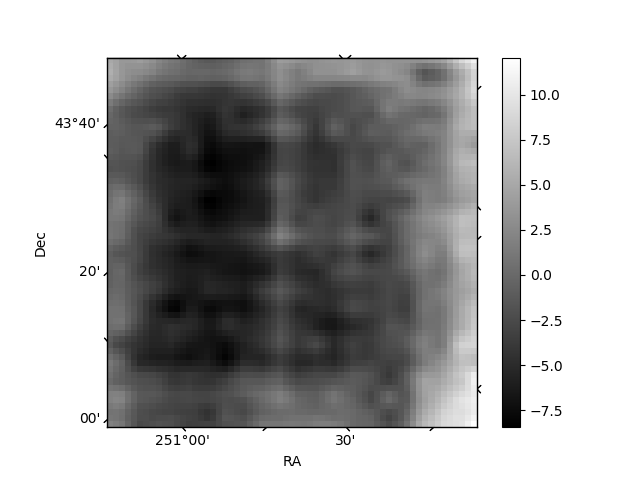
Histogram calculated using DETX and DETY for each event in the final _common_clean file
| Quadrant A | 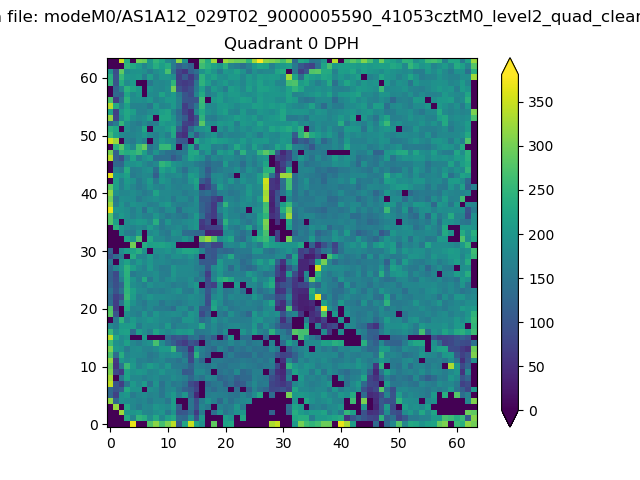 |
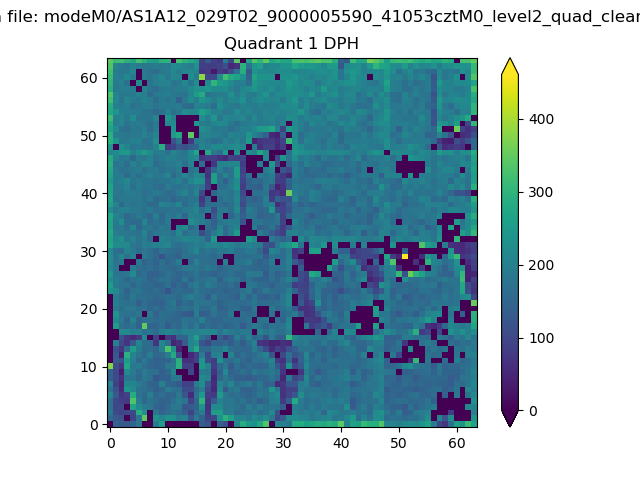 |
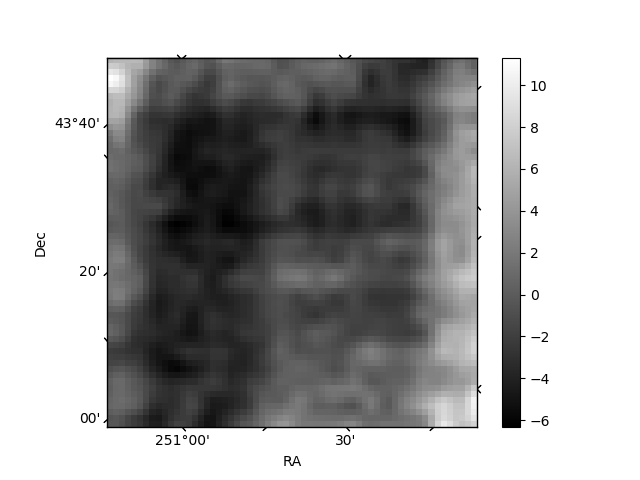
Quadrant B |
|---|---|---|---|
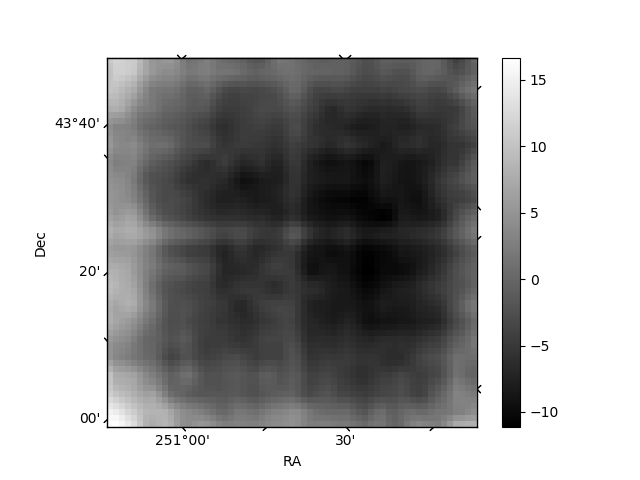
| Quadrant D | 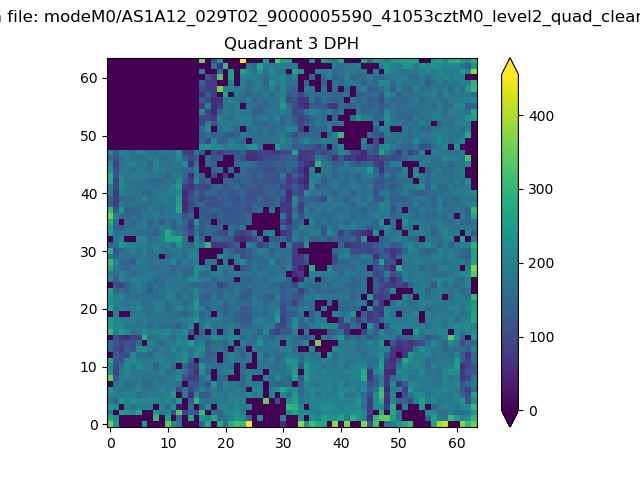 |
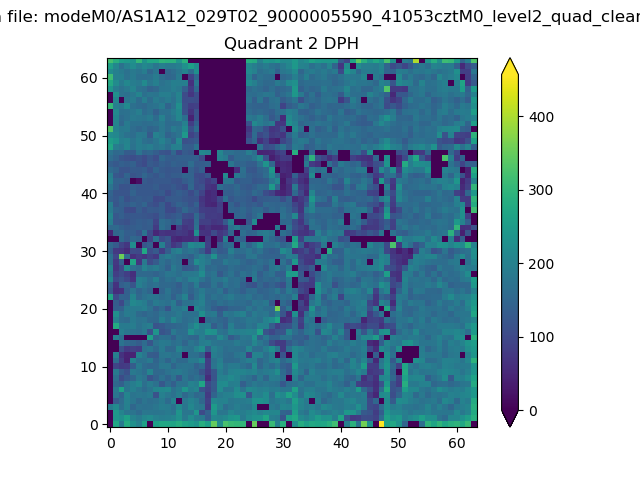 |
Quadrant C |
| Plot type | Count rate plots | Images |
|---|---|---|
| Comparison with Poisson distribution Blue bars denote a histogram of data divided into 1 sec bins. Red curve is a Poisson curve with rate = median count rate of data. |
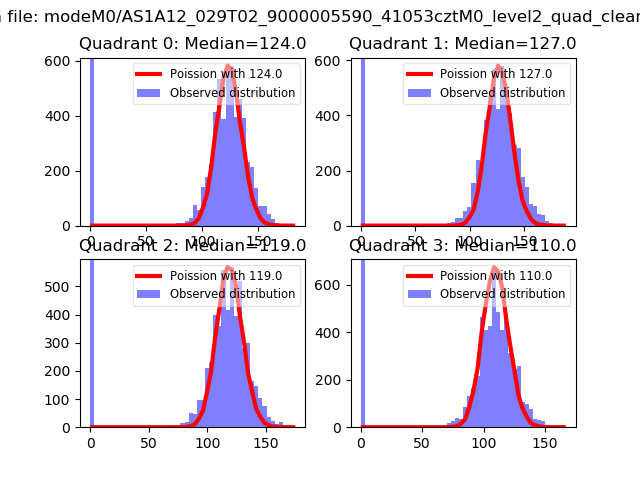 |
 |
| Quadrant-wise count rates Data is divided into 100 sec bins |
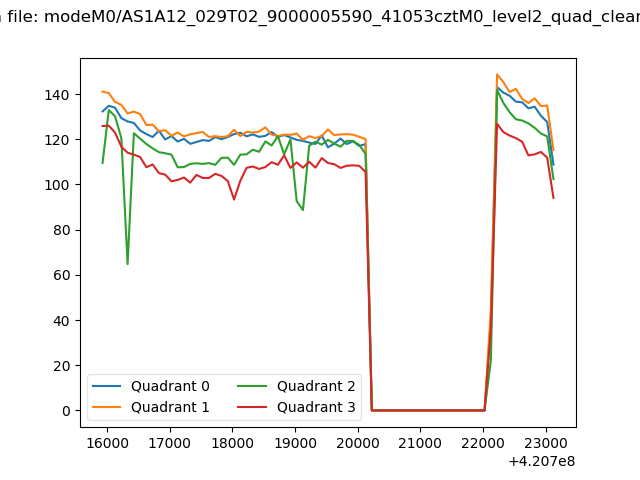 |
|
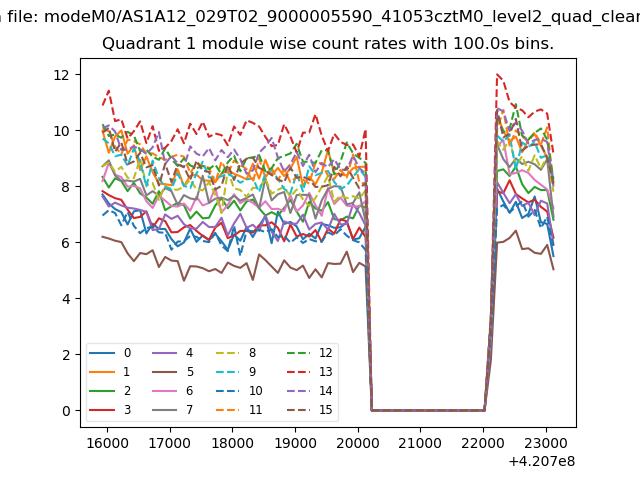
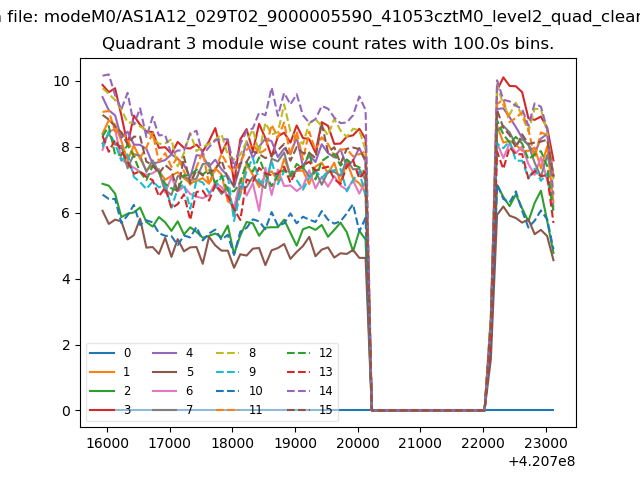
| Module-wise count rates for Quadrant A Data is divided into 100 sec bins |
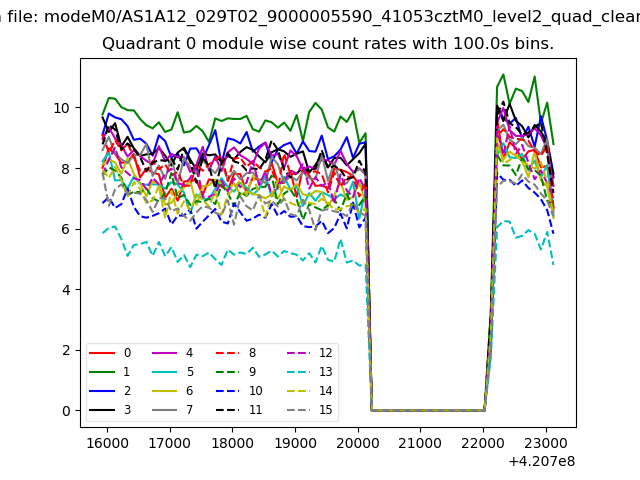 |
 |
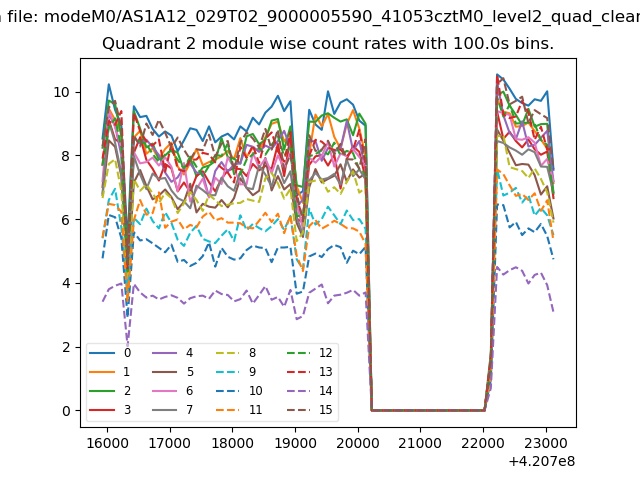
| Module-wise count rates for Quadrant B Data is divided into 100 sec bins |
 |
 |
| Module-wise count rates for Quadrant C Data is divided into 100 sec bins |
 |
 |
| Module-wise count rates for Quadrant D Data is divided into 100 sec bins |
 |
 |
| Parameter | Plot |
|---|---|
| CZT HV Monitor | 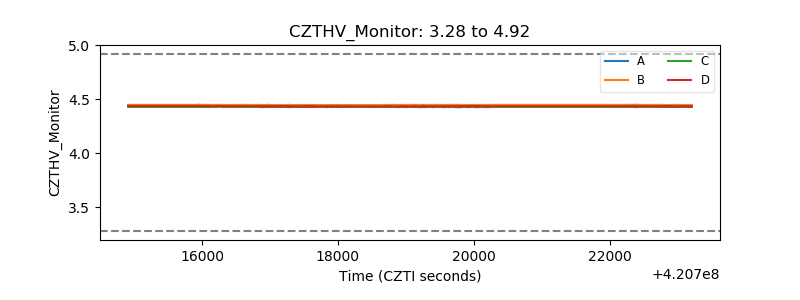 |
| D_VDD | 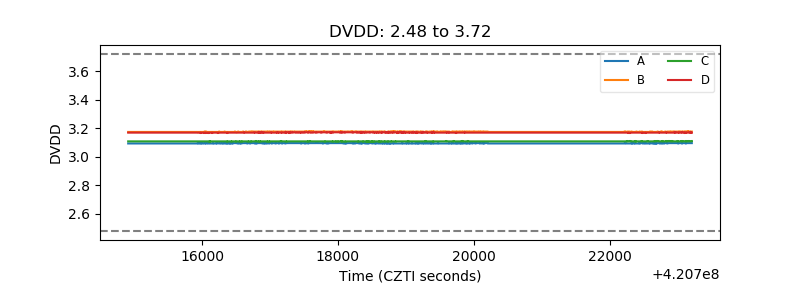 |
| Temperature 1 | 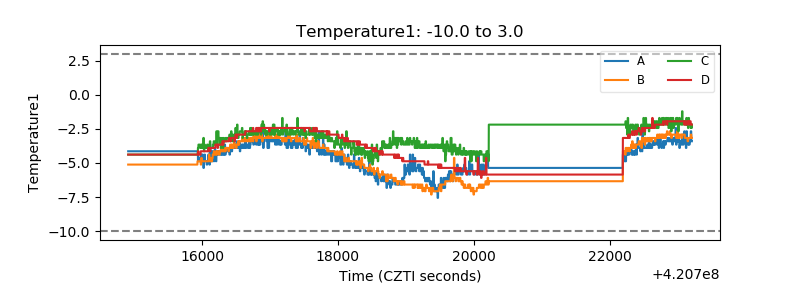 |
| Veto HV Monitor | 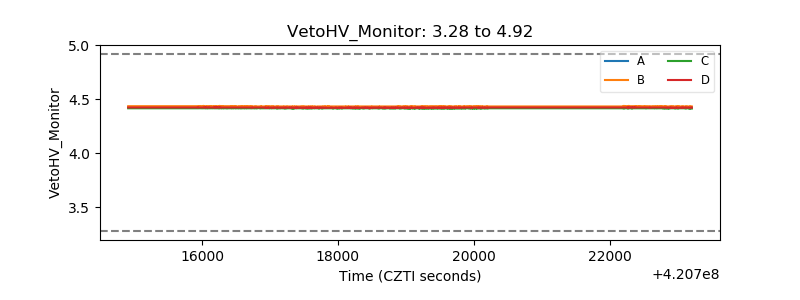 |
| Veto LLD | 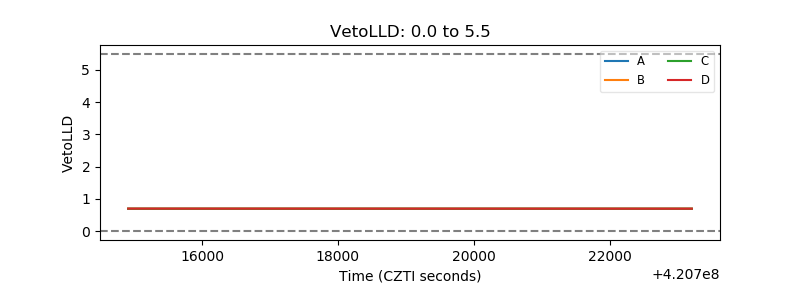 |
| Alpha Counter | 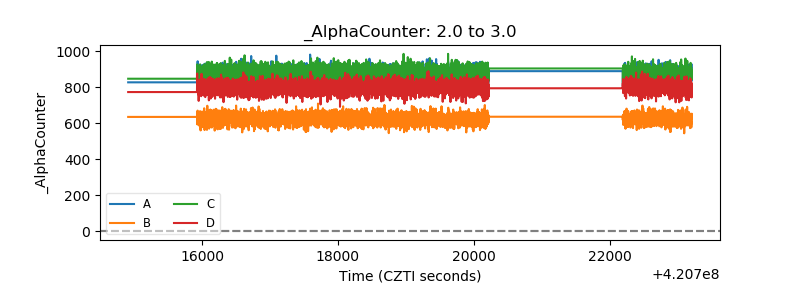 |
| _CPM_Rate | 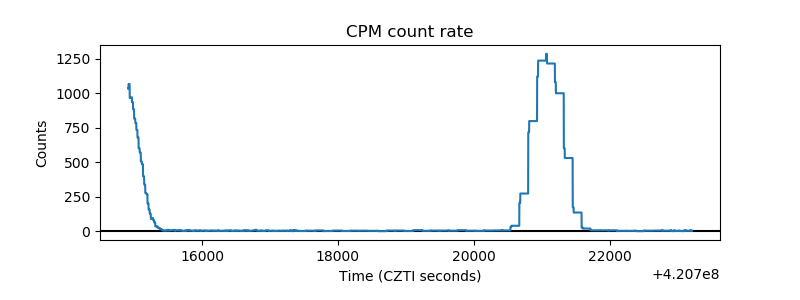 |
| CZT Counter | 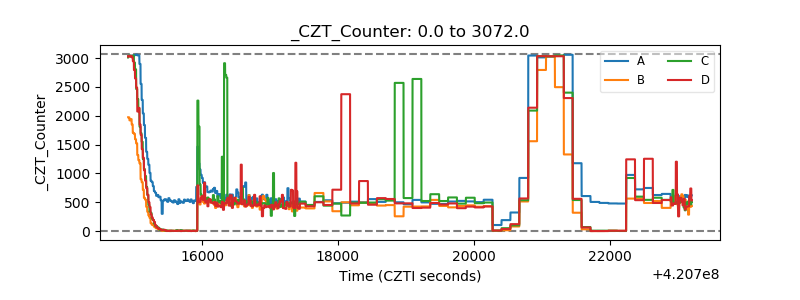 |
| +2.5 Volts monitor |  |
| +5 Volts monitor | 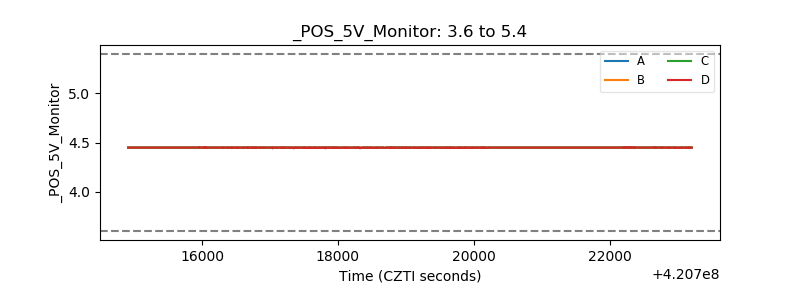 |
| _ROLL_ROT | 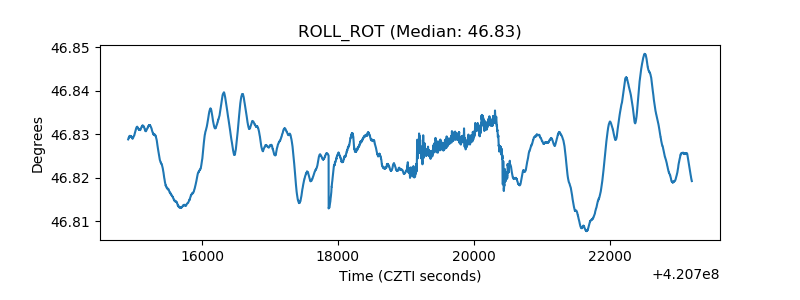 |
| _Roll_DEC | 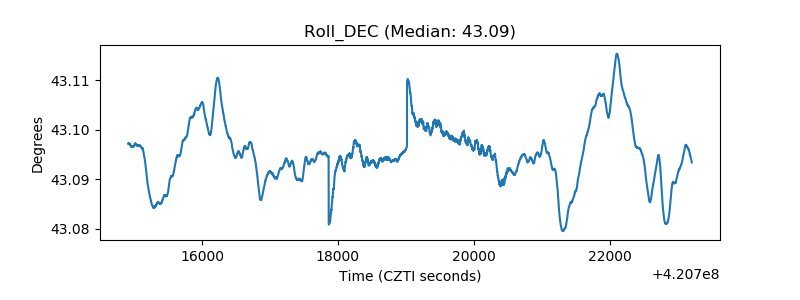 |
| _Roll_RA | 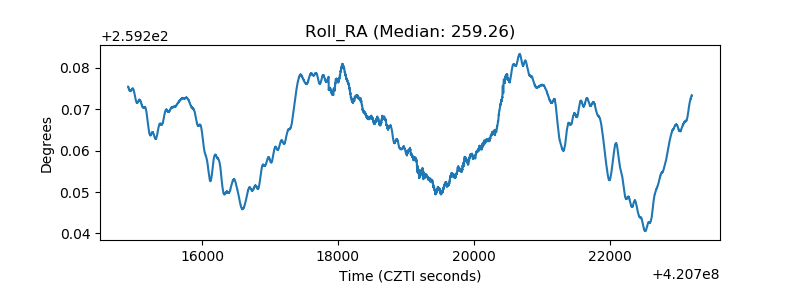 |
| Veto Counter | 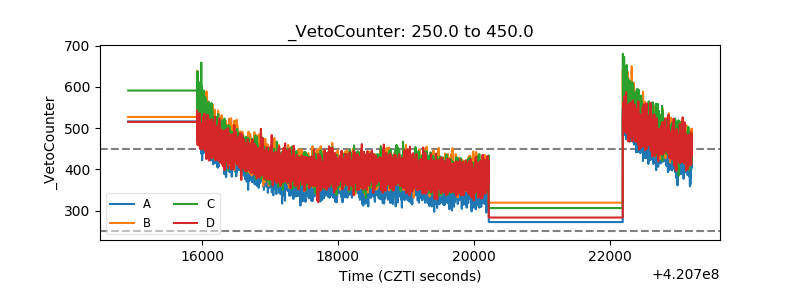 |