| Param | Original file | Final file |
|---|---|---|
| Filename | modeM0/AS1A12_029T02_9000005590_41054cztM0_level2.fits | modeM0/AS1A12_029T02_9000005590_41054cztM0_level2_quad_clean.evt |
| Size (bytes) | 321,652,800 | 95,140,800 |
| Size | 306.8 MB | 90.7 MB |
| Events in quadrant A | 2,970,694 | 655,596 |
| Events in quadrant B | 2,644,249 | 667,703 |
| Events in quadrant C | 2,762,643 | 622,548 |
| Events in quadrant D | 3,130,660 | 577,001 |
| Mode SS | |||
|---|---|---|---|
| Quadrant | BADHDUFLAG | Total packets | Discarded packets |
| A | 0 | 104 | 0 |
| B | 0 | 104 | 0 |
| C | 0 | 104 | 0 |
| D | 0 | 104 | 0 |
| Mode M0 | |||
|---|---|---|---|
| Quadrant | BADHDUFLAG | Total packets | Discarded packets |
| A | 0 | 11953 | 3 |
| B | 0 | 10906 | 2 |
| C | 0 | 10993 | 2 |
| D | 0 | 12506 | 2 |
| Mode M9 | |||
|---|---|---|---|
| Quadrant | BADHDUFLAG | Total packets | Discarded packets |
| A | 0 | 27 | 0 |
| B | 0 | 27 | 0 |
| C | 0 | 27 | 0 |
| D | 0 | 28 | 0 |
| Quadrant | Total seconds | Saturated seconds | Saturation percentage |
|---|---|---|---|
| A | 5114 | 13 | 0.254204% |
| B | 5114 | 42 | 0.821275% |
| C | 5114 | 52 | 1.016817% |
| D | 5114 | 43 | 0.840829% |
Noise dominated data is calculated using 1-second bins in cleaned event files. If a bin has >2000 counts, and if more than 50% of those come from <1% of pixels, then it is considered to be noise-dominated and hence unusable.
| Quadrant | # 1 sec bins | Bins with >0 counts | Bins with >2000 counts | High rate bins dominated by noise | Noise dominated (total time) | Noise dominated (detector-on time) | Marked lightcurve |
|---|---|---|---|---|---|---|---|
| A | 7207 | 5115 | 3 | 3 | 0.04% | 0.06% | 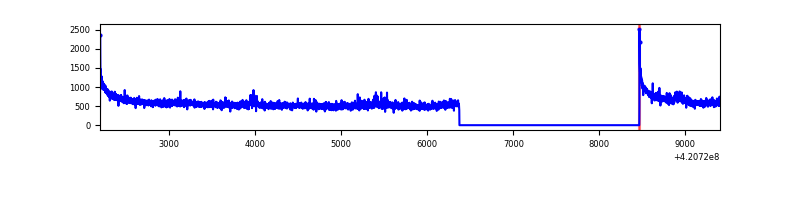 |
| B | 7207 | 5115 | 25 | 25 | 0.35% | 0.49% | 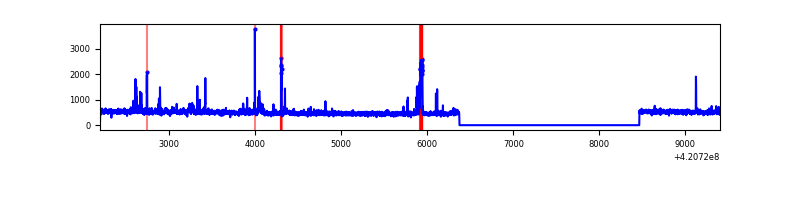 |
| C | 7207 | 5115 | 50 | 50 | 0.69% | 0.98% |  |
| D | 7207 | 5115 | 37 | 37 | 0.51% | 0.72% | 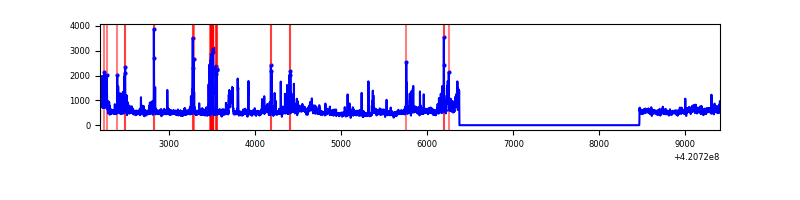 |
Top three noisy pixels from each quadrant. If the there are fewer than three noisy pixels in the level2.evt file, extra rows are filled as -1
| Pixel properties | Quadrant properties | ||||||
|---|---|---|---|---|---|---|---|
| Quadrant | DetID | PixID | Counts | Sigma | Mean | Median | Sigma |
| A | 10 | 83 | 483558 | 3845.75 | 620 | 608 | 125.6 |
| A | 12 | 189 | 83866 | 662.98 | 620 | 608 | 125.6 |
| A | 13 | 254 | 8123 | 59.84 | 620 | 608 | 125.6 |
| B | 0 | 190 | 163750 | 1400.83 | 612 | 596 | 116.5 |
| B | 4 | 81 | 54003 | 458.55 | 612 | 596 | 116.5 |
| B | 0 | 229 | 14846 | 122.35 | 612 | 596 | 116.5 |
| C | 15 | 214 | 236555 | 1696.9 | 600 | 606 | 139.0 |
| C | 0 | 10 | 155589 | 1114.61 | 600 | 606 | 139.0 |
| C | 14 | 254 | 27578 | 193.98 | 600 | 606 | 139.0 |
| D | 13 | 249 | 327972 | 2247.08 | 602 | 587 | 145.7 |
| D | 12 | 79 | 317027 | 2171.96 | 602 | 587 | 145.7 |
| D | 13 | 171 | 59704 | 405.76 | 602 | 587 | 145.7 |
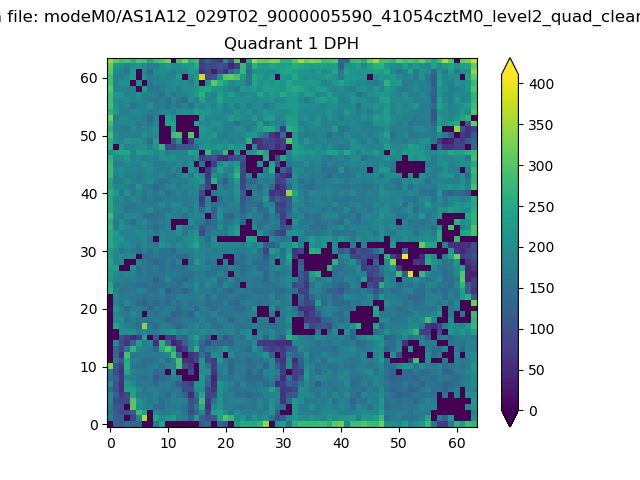
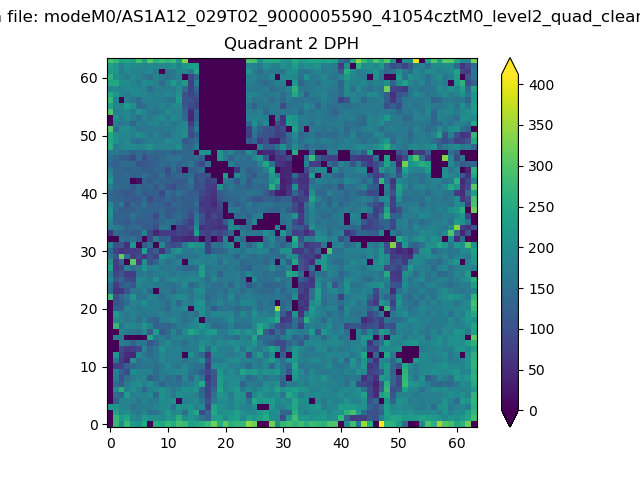
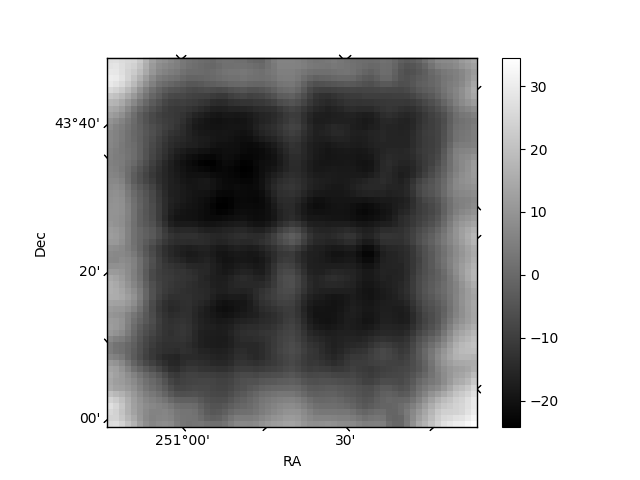
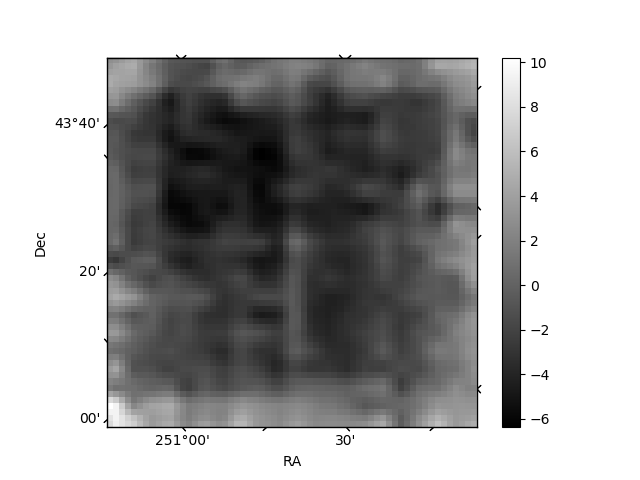
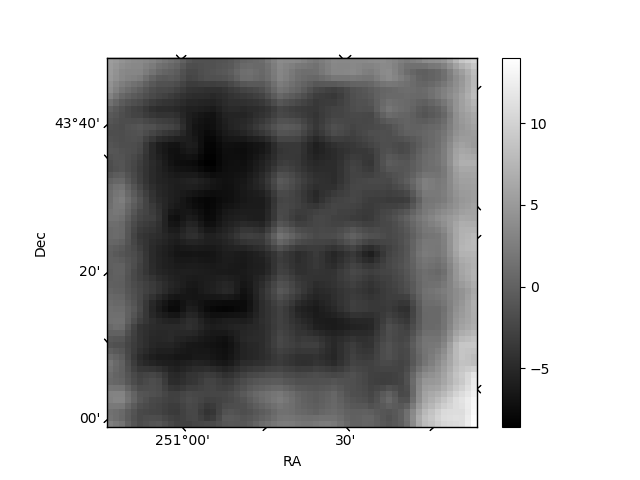
Histogram calculated using DETX and DETY for each event in the final _common_clean file
| Quadrant A | 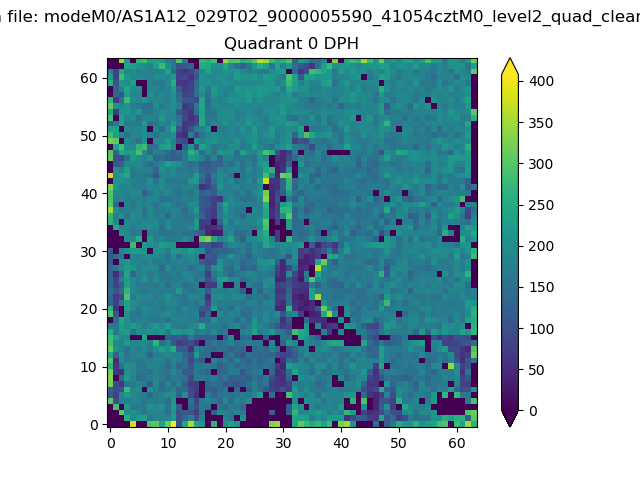 |
 |
Quadrant B |
|---|---|---|---|
| Quadrant D | 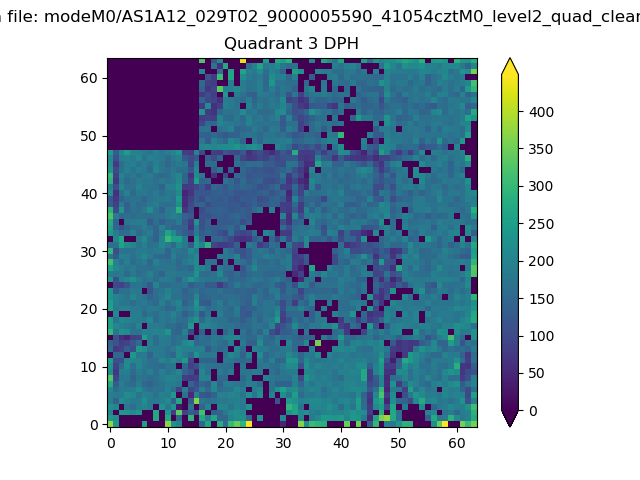 |
 |
Quadrant C |
| Plot type | Count rate plots | Images |
|---|---|---|
| Comparison with Poisson distribution Blue bars denote a histogram of data divided into 1 sec bins. Red curve is a Poisson curve with rate = median count rate of data. |
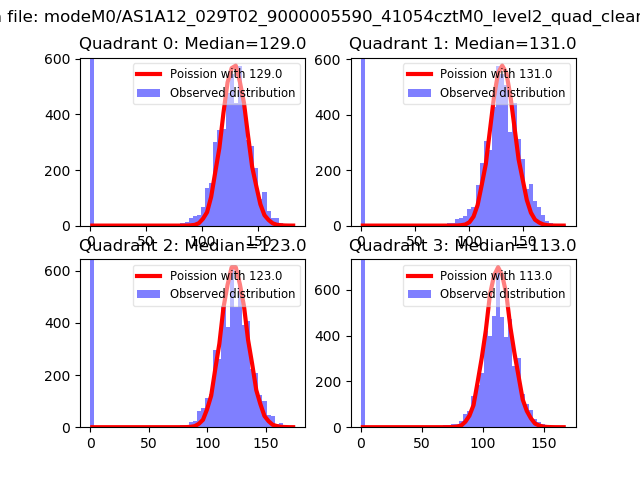 |
 |
| Quadrant-wise count rates Data is divided into 100 sec bins |
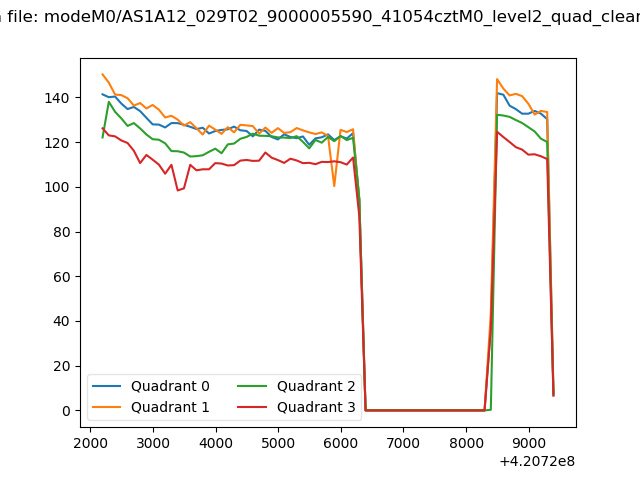 |
|
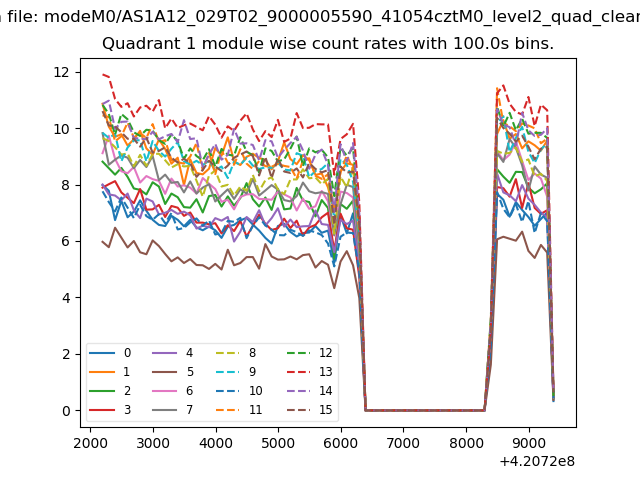
| Module-wise count rates for Quadrant A Data is divided into 100 sec bins |
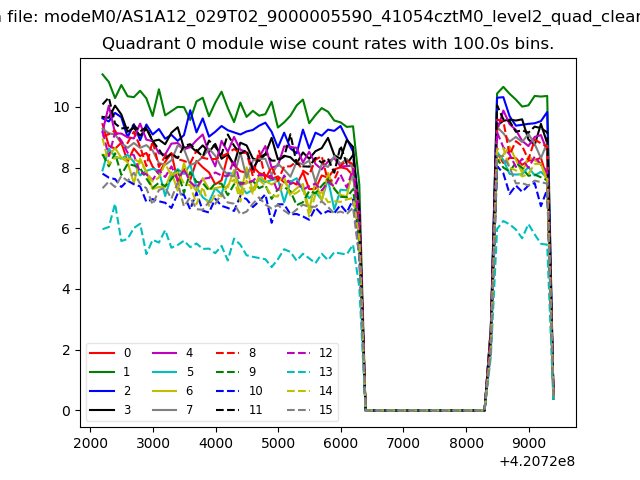 |
 |
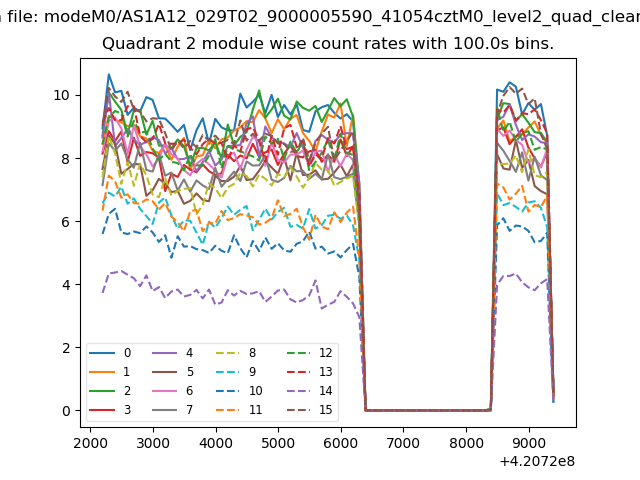
| Module-wise count rates for Quadrant B Data is divided into 100 sec bins |
 |
 |
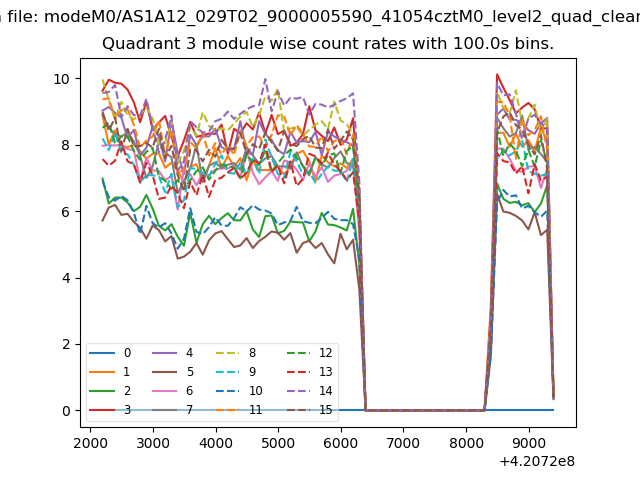
| Module-wise count rates for Quadrant C Data is divided into 100 sec bins |
 |
 |
| Module-wise count rates for Quadrant D Data is divided into 100 sec bins |
 |
 |
| Parameter | Plot |
|---|---|
| CZT HV Monitor | 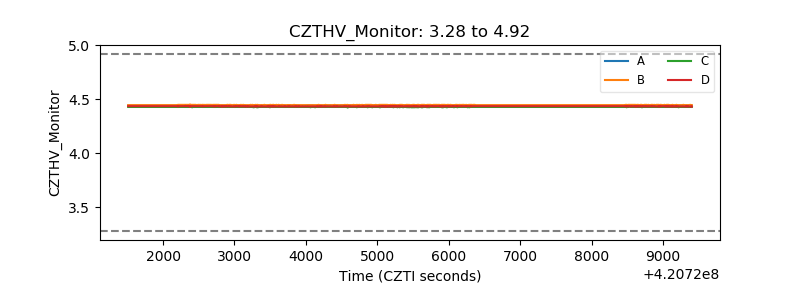 |
| D_VDD | 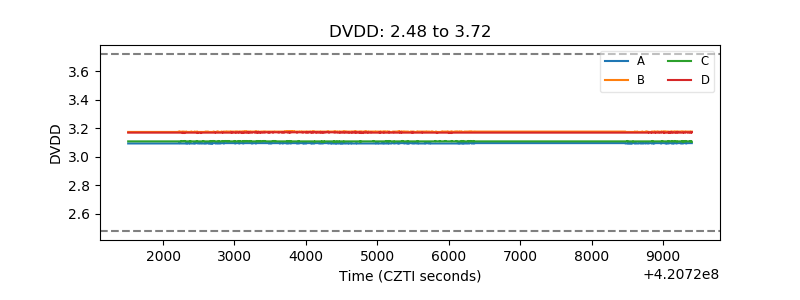 |
| Temperature 1 | 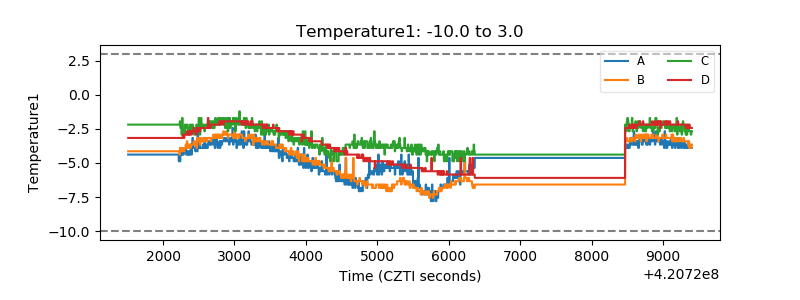 |
| Veto HV Monitor |  |
| Veto LLD | 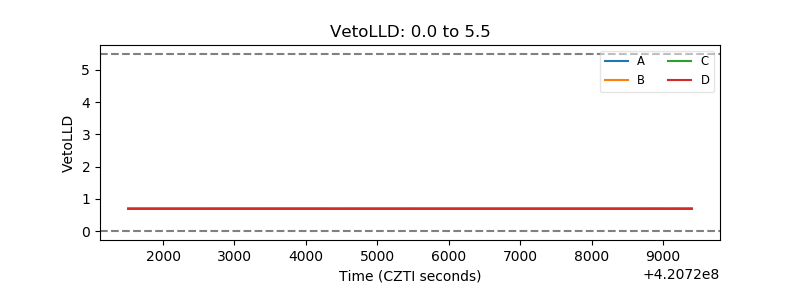 |
| Alpha Counter | 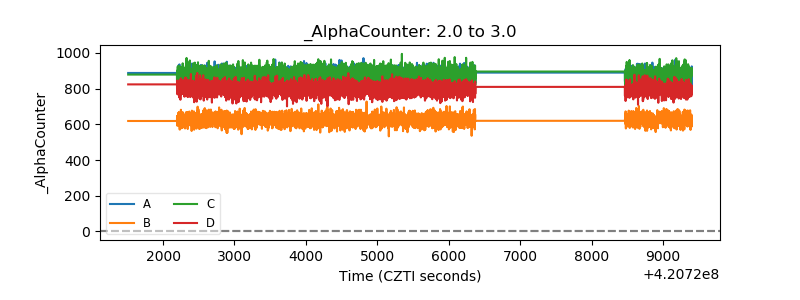 |
| _CPM_Rate | 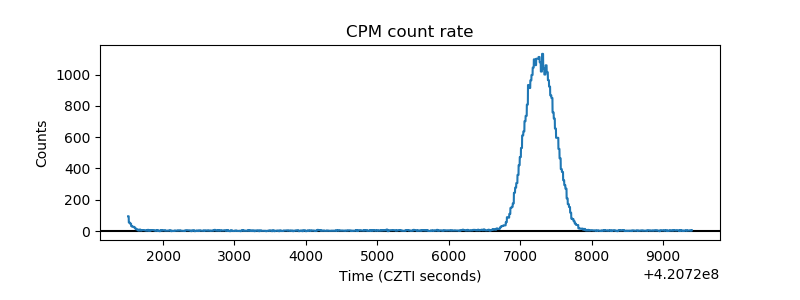 |
| CZT Counter | 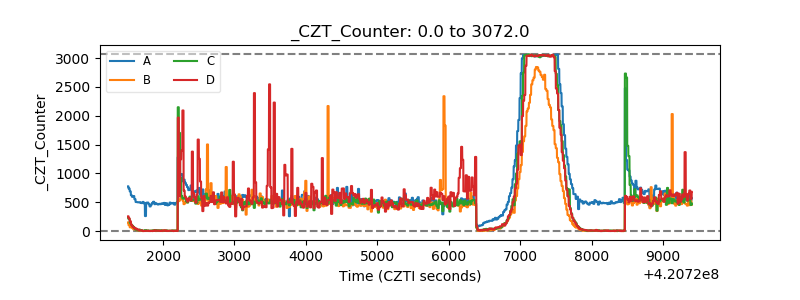 |
| +2.5 Volts monitor |  |
| +5 Volts monitor | 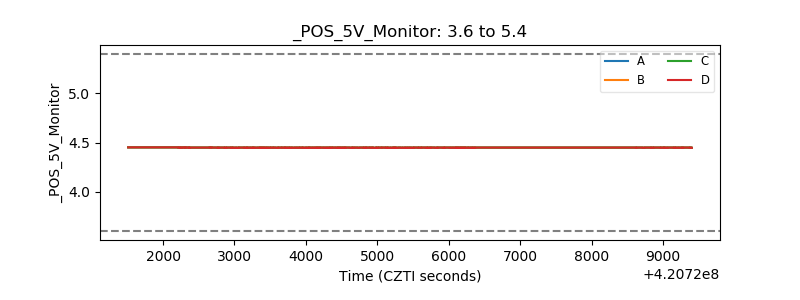 |
| _ROLL_ROT | 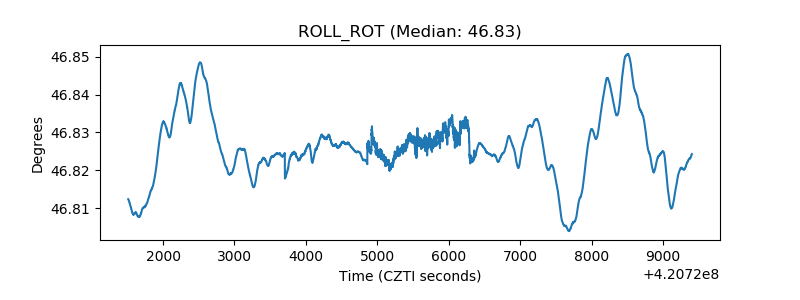 |
| _Roll_DEC | 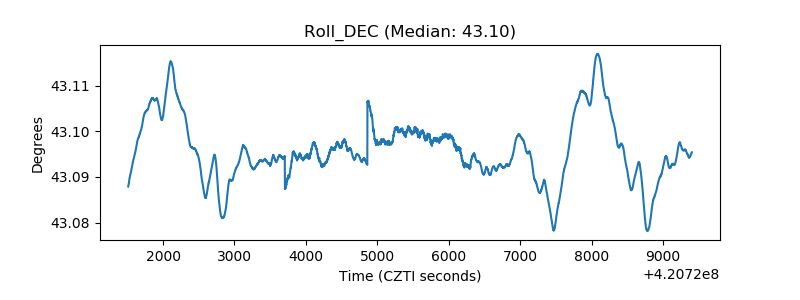 |
| _Roll_RA | 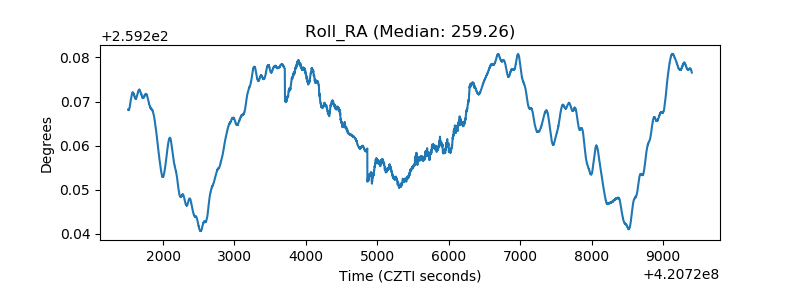 |
| Veto Counter | 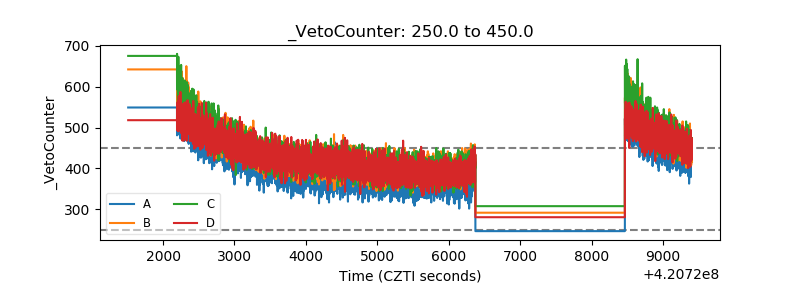 |