| Param | Original file | Final file |
|---|---|---|
| Filename | modeM0/AS1A12_029T02_9000005590_41055cztM0_level2.fits | modeM0/AS1A12_029T02_9000005590_41055cztM0_level2_quad_clean.evt |
| Size (bytes) | 160,070,400 | 47,563,200 |
| Size | 152.7 MB | 45.4 MB |
| Events in quadrant A | 1,501,884 | 328,549 |
| Events in quadrant B | 1,246,487 | 336,423 |
| Events in quadrant C | 1,500,437 | 304,218 |
| Events in quadrant D | 1,476,328 | 289,177 |
| Mode SS | |||
|---|---|---|---|
| Quadrant | BADHDUFLAG | Total packets | Discarded packets |
| A | 0 | 50 | 0 |
| B | 0 | 50 | 0 |
| C | 0 | 50 | 0 |
| D | 0 | 50 | 0 |
| Mode M0 | |||
|---|---|---|---|
| Quadrant | BADHDUFLAG | Total packets | Discarded packets |
| A | 0 | 6032 | 1 |
| B | 0 | 5285 | 1 |
| C | 0 | 5839 | 1 |
| D | 0 | 5970 | 1 |
| Mode M9 | |||
|---|---|---|---|
| Quadrant | BADHDUFLAG | Total packets | Discarded packets |
| A | 0 | 12 | 0 |
| B | 0 | 12 | 0 |
| C | 0 | 12 | 0 |
| D | 0 | 13 | 0 |
| Quadrant | Total seconds | Saturated seconds | Saturation percentage |
|---|---|---|---|
| A | 2545 | 7 | 0.275049% |
| B | 2545 | 4 | 0.157171% |
| C | 2545 | 70 | 2.750491% |
| D | 2545 | 8 | 0.314342% |
Noise dominated data is calculated using 1-second bins in cleaned event files. If a bin has >2000 counts, and if more than 50% of those come from <1% of pixels, then it is considered to be noise-dominated and hence unusable.
| Quadrant | # 1 sec bins | Bins with >0 counts | Bins with >2000 counts | High rate bins dominated by noise | Noise dominated (total time) | Noise dominated (detector-on time) | Marked lightcurve |
|---|---|---|---|---|---|---|---|
| A | 2545 | 2545 | 3 | 3 | 0.12% | 0.12% | 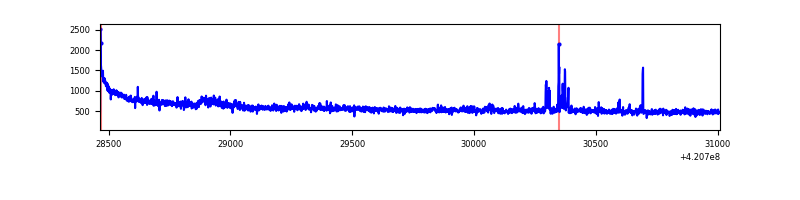 |
| B | 2545 | 2545 | 0 | 0 | 0.00% | 0.00% | 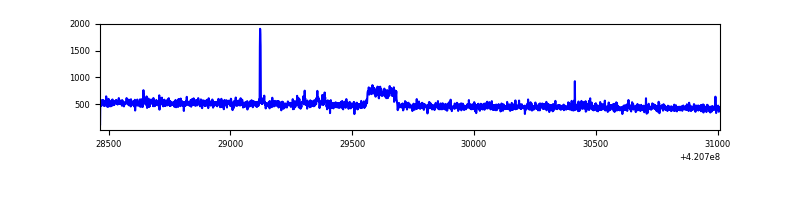 |
| C | 2545 | 2545 | 57 | 57 | 2.24% | 2.24% | 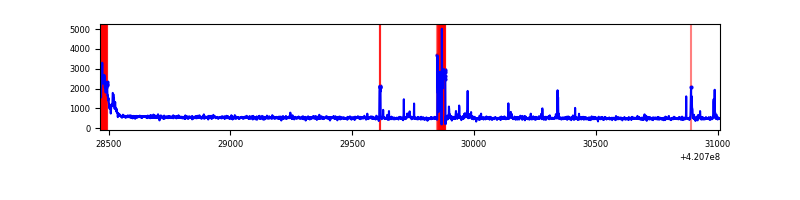 |
| D | 2545 | 2545 | 7 | 7 | 0.28% | 0.28% | 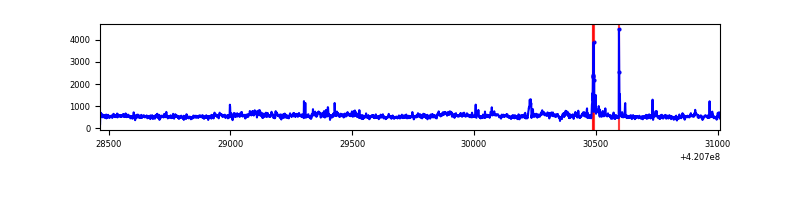 |
Top three noisy pixels from each quadrant. If the there are fewer than three noisy pixels in the level2.evt file, extra rows are filled as -1
| Pixel properties | Quadrant properties | ||||||
|---|---|---|---|---|---|---|---|
| Quadrant | DetID | PixID | Counts | Sigma | Mean | Median | Sigma |
| A | 10 | 83 | 244853 | 3862.89 | 309 | 303 | 63.3 |
| A | 12 | 189 | 57440 | 902.53 | 309 | 303 | 63.3 |
| A | 13 | 6 | 4784 | 70.78 | 309 | 303 | 63.3 |
| B | 0 | 229 | 38759 | 650.82 | 304 | 296 | 59.1 |
| B | 12 | 111 | 7039 | 114.1 | 304 | 296 | 59.1 |
| B | 8 | 128 | 6807 | 110.17 | 304 | 296 | 59.1 |
| C | 14 | 254 | 135850 | 1950.33 | 296 | 299 | 69.5 |
| C | 15 | 214 | 116613 | 1673.55 | 296 | 299 | 69.5 |
| C | 0 | 10 | 92540 | 1327.18 | 296 | 299 | 69.5 |
| D | 12 | 79 | 247175 | 3307.11 | 302 | 293 | 74.7 |
| D | 13 | 249 | 62163 | 828.78 | 302 | 293 | 74.7 |
| D | 2 | 234 | 10329 | 134.44 | 302 | 293 | 74.7 |
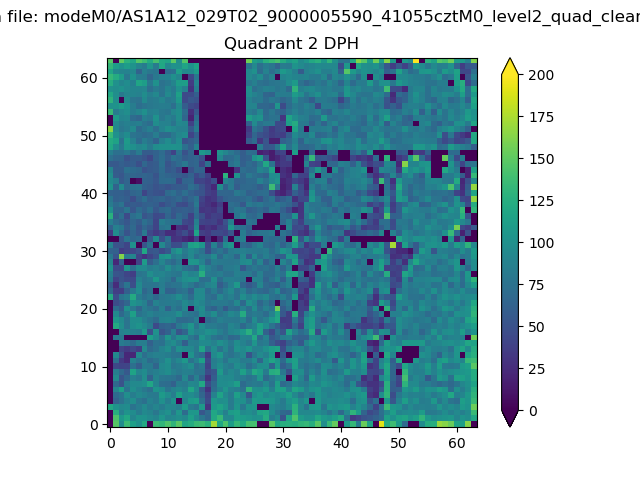
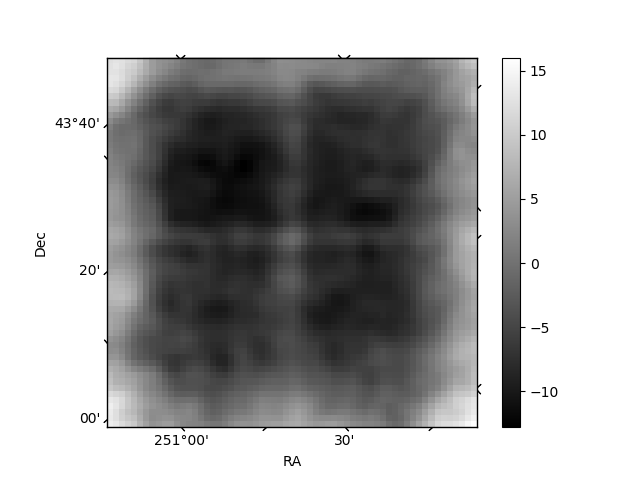
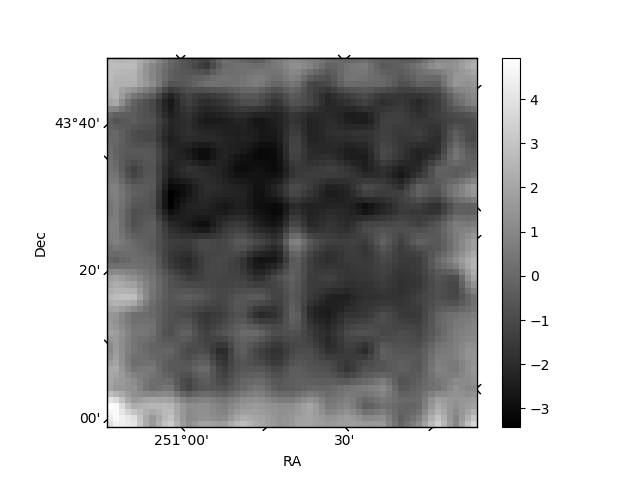
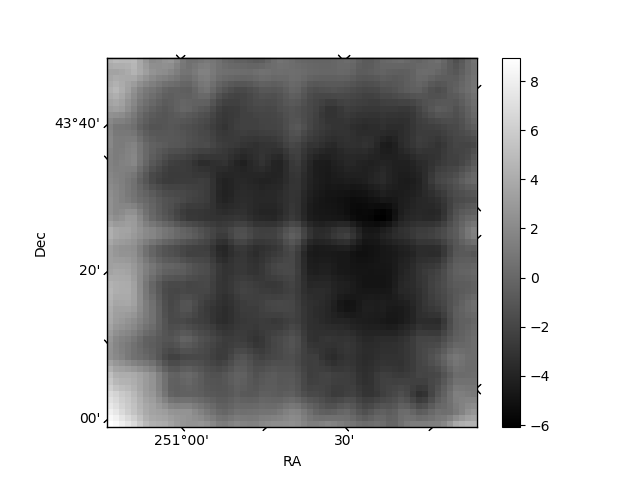
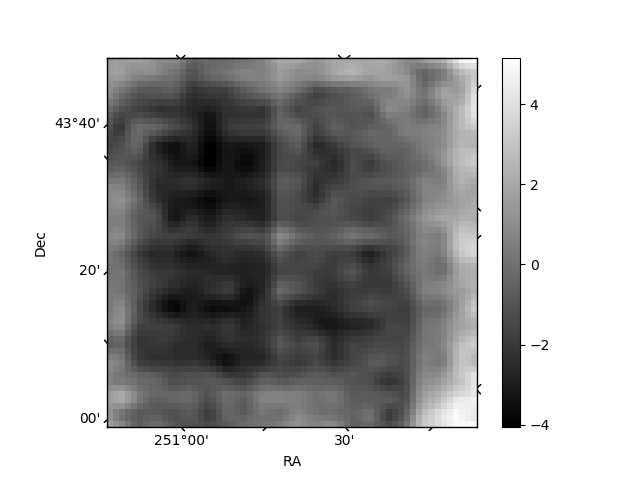
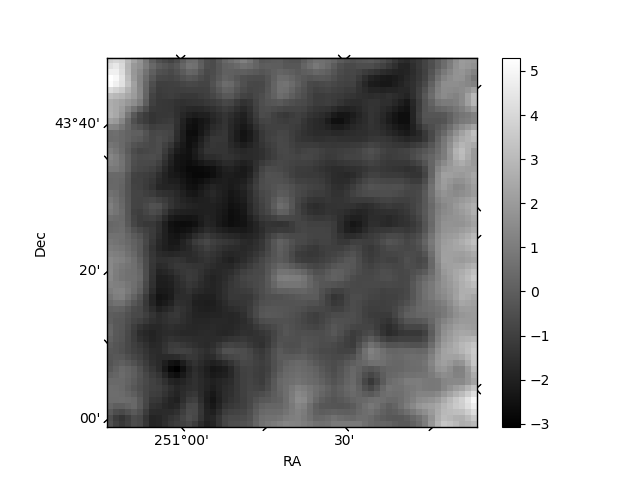
Histogram calculated using DETX and DETY for each event in the final _common_clean file
| Quadrant A | 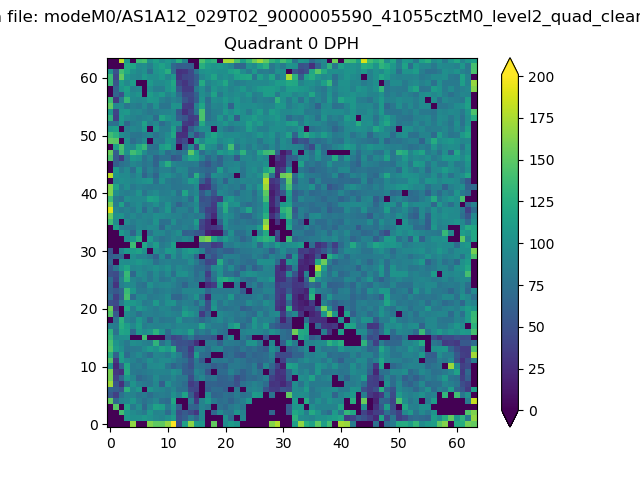 |
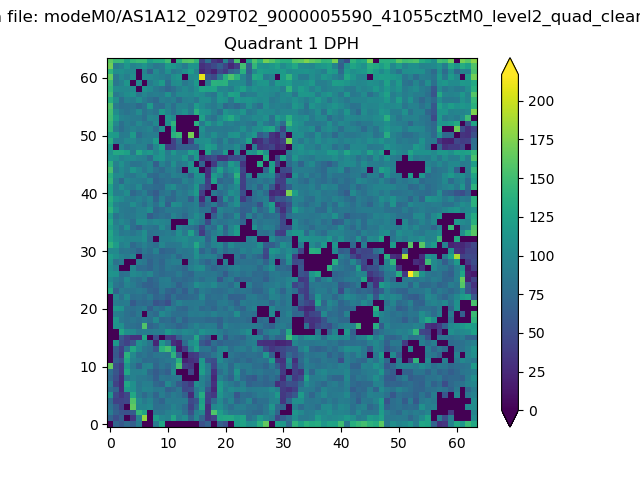 |
Quadrant B |
|---|---|---|---|
| Quadrant D | 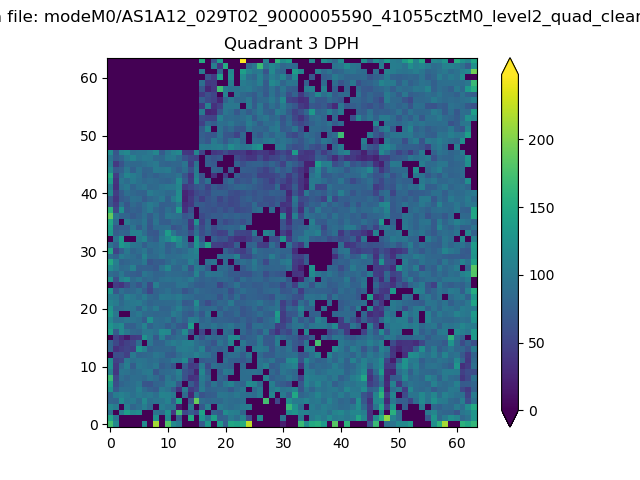 |
 |
Quadrant C |
| Plot type | Count rate plots | Images |
|---|---|---|
| Comparison with Poisson distribution Blue bars denote a histogram of data divided into 1 sec bins. Red curve is a Poisson curve with rate = median count rate of data. |
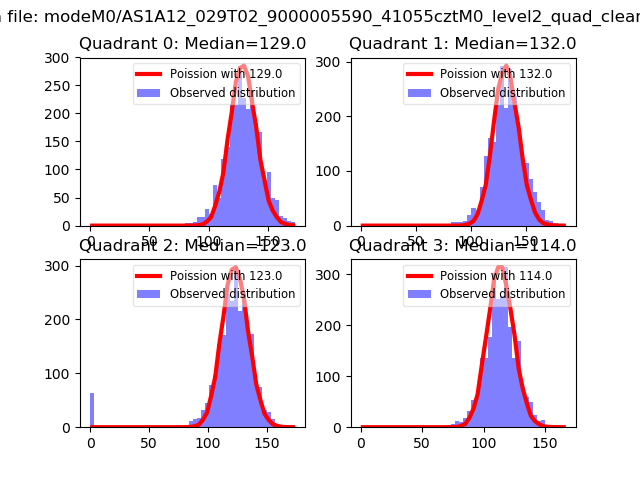 |
 |
| Quadrant-wise count rates Data is divided into 100 sec bins |
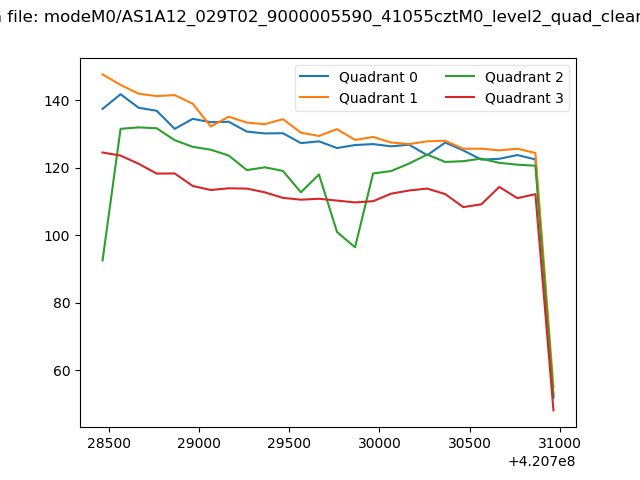 |
|
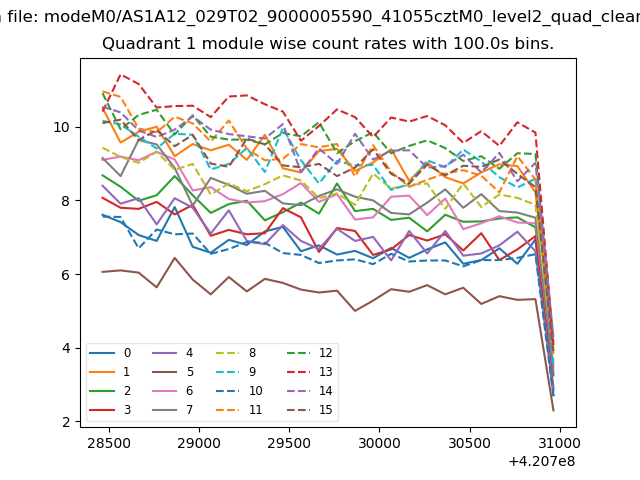
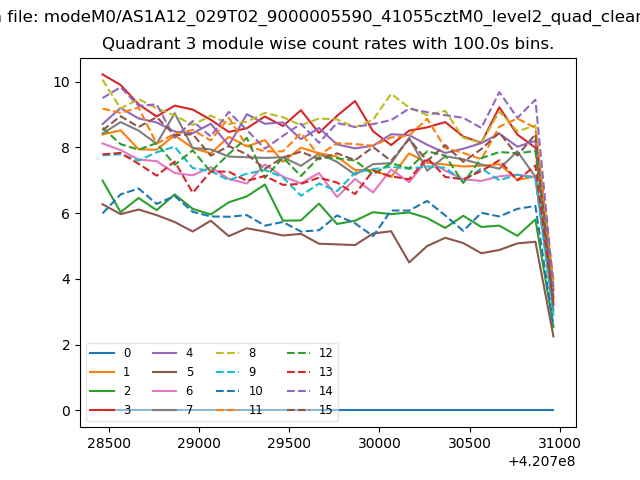
| Module-wise count rates for Quadrant A Data is divided into 100 sec bins |
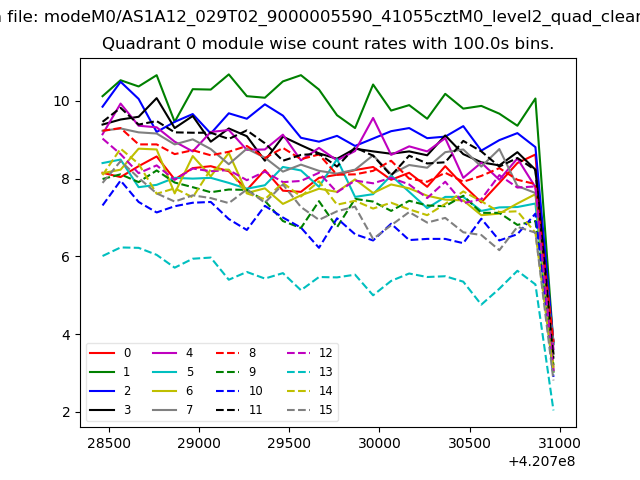 |
 |
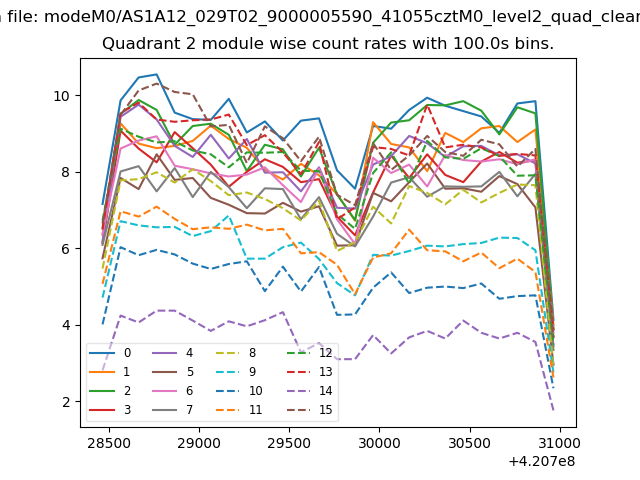
| Module-wise count rates for Quadrant B Data is divided into 100 sec bins |
 |
 |
| Module-wise count rates for Quadrant C Data is divided into 100 sec bins |
 |
 |
| Module-wise count rates for Quadrant D Data is divided into 100 sec bins |
 |
 |
| Parameter | Plot |
|---|---|
| CZT HV Monitor | 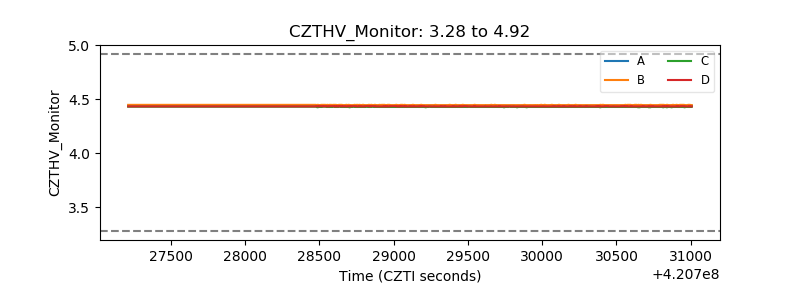 |
| D_VDD | 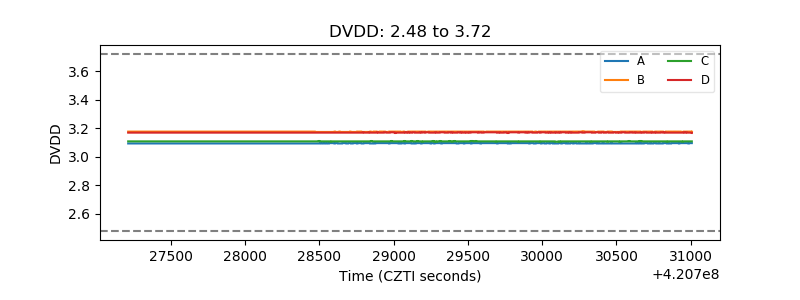 |
| Temperature 1 | 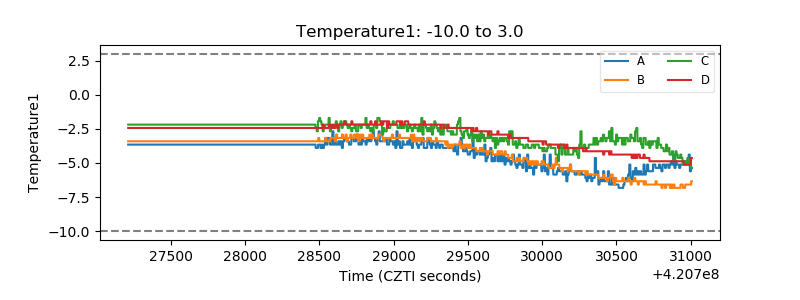 |
| Veto HV Monitor | 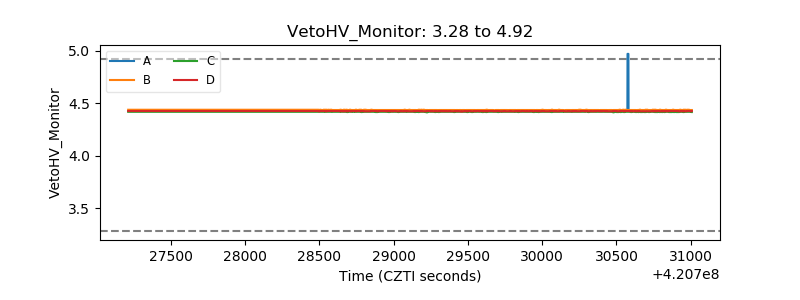 |
| Veto LLD | 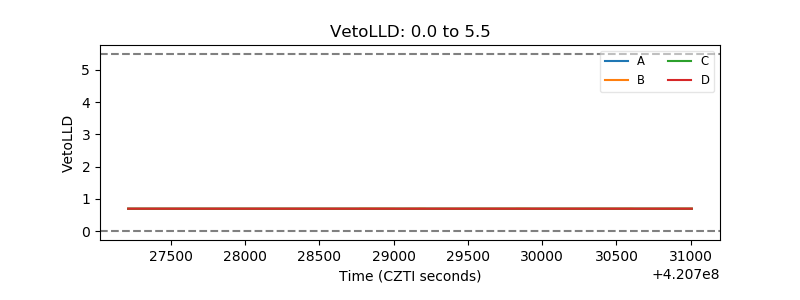 |
| Alpha Counter | 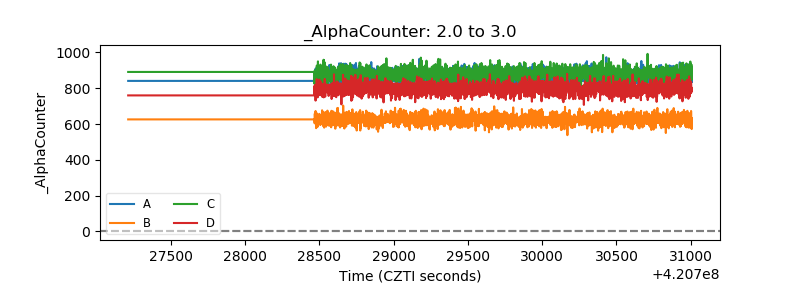 |
| _CPM_Rate | 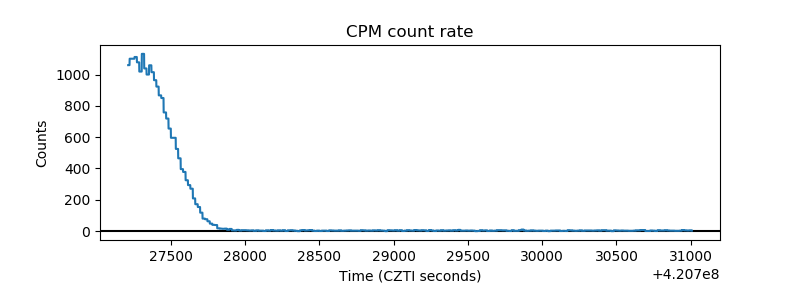 |
| CZT Counter | 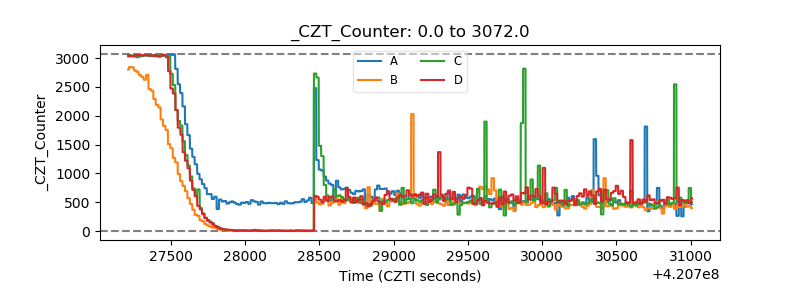 |
| +2.5 Volts monitor |  |
| +5 Volts monitor | 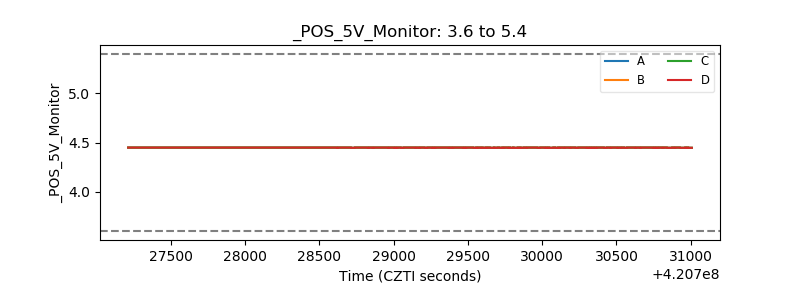 |
| _ROLL_ROT | 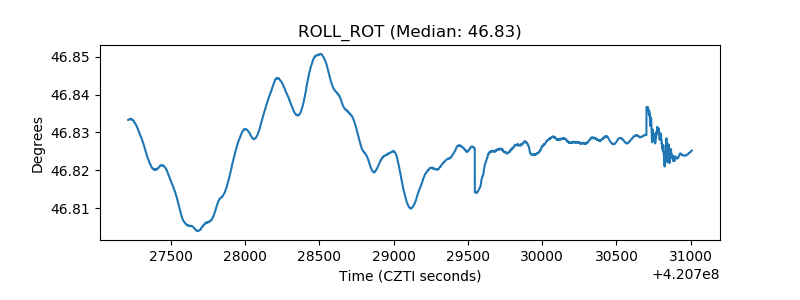 |
| _Roll_DEC | 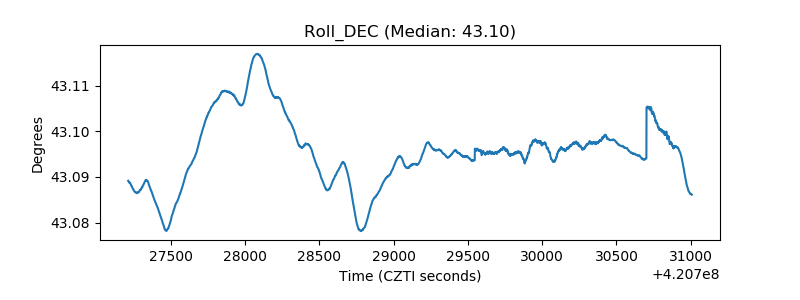 |
| _Roll_RA | 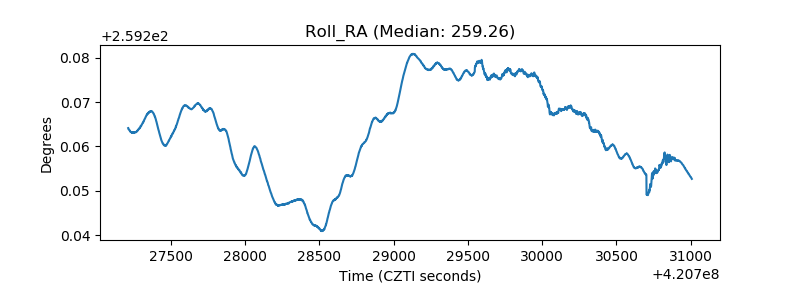 |
| Veto Counter | 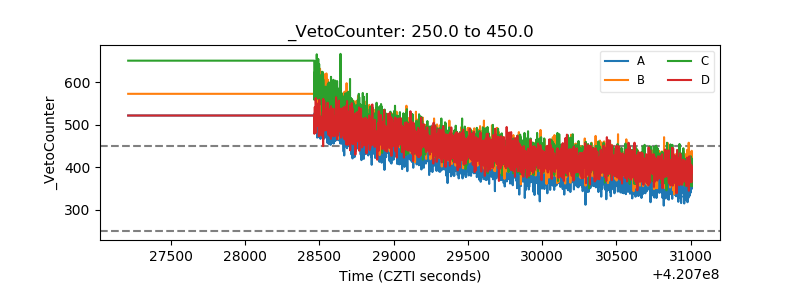 |