| Param | Original file | Final file |
|---|---|---|
| Filename | modeM0/AS1A12_042T01_9000005588_41005cztM0_level2.fits | modeM0/AS1A12_042T01_9000005588_41005cztM0_level2_quad_clean.evt |
| Size (bytes) | 319,890,240 | 93,090,240 |
| Size | 305.1 MB | 88.8 MB |
| Events in quadrant A | 3,054,491 | 620,669 |
| Events in quadrant B | 2,613,859 | 641,385 |
| Events in quadrant C | 2,701,206 | 604,090 |
| Events in quadrant D | 3,025,569 | 551,831 |
| Mode SS | |||
|---|---|---|---|
| Quadrant | BADHDUFLAG | Total packets | Discarded packets |
| A | 0 | 120 | 0 |
| B | 0 | 120 | 0 |
| C | 0 | 120 | 0 |
| D | 0 | 120 | 0 |
| Mode M0 | |||
|---|---|---|---|
| Quadrant | BADHDUFLAG | Total packets | Discarded packets |
| A | 0 | 12381 | 3 |
| B | 0 | 11762 | 2 |
| C | 0 | 11697 | 2 |
| D | 0 | 13141 | 2 |
| Mode M9 | |||
|---|---|---|---|
| Quadrant | BADHDUFLAG | Total packets | Discarded packets |
| A | 0 | 29 | 0 |
| B | 0 | 29 | 0 |
| C | 0 | 29 | 0 |
| D | 0 | 29 | 0 |
| Quadrant | Total seconds | Saturated seconds | Saturation percentage |
|---|---|---|---|
| A | 5725 | 11 | 0.192140% |
| B | 5725 | 14 | 0.244541% |
| C | 5725 | 16 | 0.279476% |
| D | 5725 | 108 | 1.886463% |
Noise dominated data is calculated using 1-second bins in cleaned event files. If a bin has >2000 counts, and if more than 50% of those come from <1% of pixels, then it is considered to be noise-dominated and hence unusable.
| Quadrant | # 1 sec bins | Bins with >0 counts | Bins with >2000 counts | High rate bins dominated by noise | Noise dominated (total time) | Noise dominated (detector-on time) | Marked lightcurve |
|---|---|---|---|---|---|---|---|
| A | 7248 | 5726 | 4 | 4 | 0.06% | 0.07% | 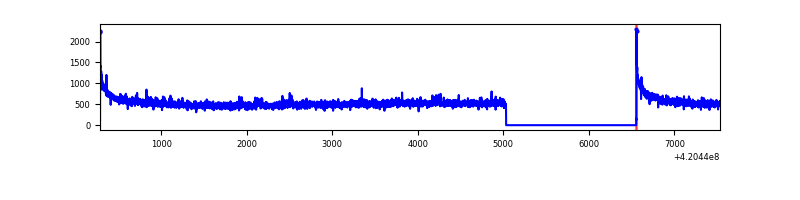 |
| B | 7248 | 5726 | 9 | 9 | 0.12% | 0.16% | 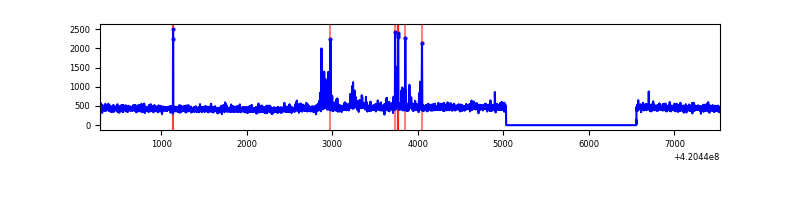 |
| C | 7248 | 5726 | 11 | 11 | 0.15% | 0.19% | 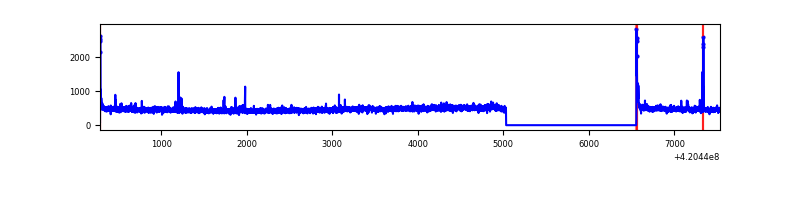 |
| D | 7248 | 5726 | 99 | 99 | 1.37% | 1.73% | 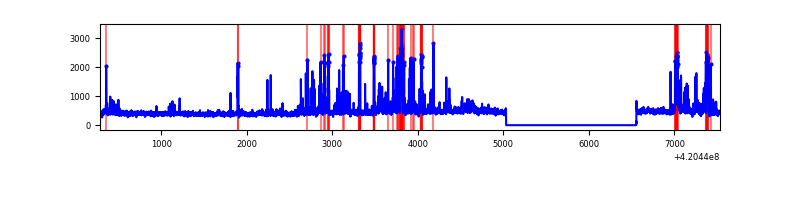 |
Top three noisy pixels from each quadrant. If the there are fewer than three noisy pixels in the level2.evt file, extra rows are filled as -1
| Pixel properties | Quadrant properties | ||||||
|---|---|---|---|---|---|---|---|
| Quadrant | DetID | PixID | Counts | Sigma | Mean | Median | Sigma |
| A | 10 | 83 | 560326 | 4342.88 | 629 | 616 | 128.9 |
| A | 12 | 189 | 59620 | 457.82 | 629 | 616 | 128.9 |
| A | 13 | 254 | 9696 | 70.45 | 629 | 616 | 128.9 |
| B | 15 | 85 | 59301 | 482.67 | 627 | 609 | 121.6 |
| B | 0 | 186 | 35429 | 286.35 | 627 | 609 | 121.6 |
| B | 0 | 199 | 29004 | 233.52 | 627 | 609 | 121.6 |
| C | 15 | 214 | 245464 | 1704.87 | 610 | 611 | 143.6 |
| C | 0 | 10 | 38212 | 261.81 | 610 | 611 | 143.6 |
| C | 12 | 249 | 30724 | 209.67 | 610 | 611 | 143.6 |
| D | 2 | 249 | 202979 | 1382.8 | 605 | 587 | 146.4 |
| D | 13 | 249 | 197497 | 1345.35 | 605 | 587 | 146.4 |
| D | 2 | 153 | 103744 | 704.8 | 605 | 587 | 146.4 |
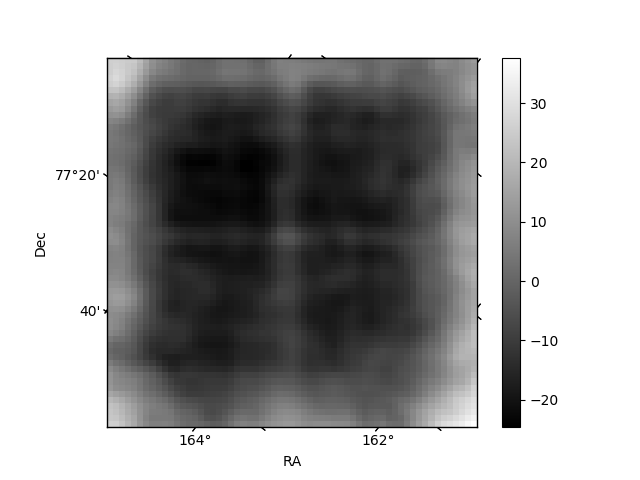
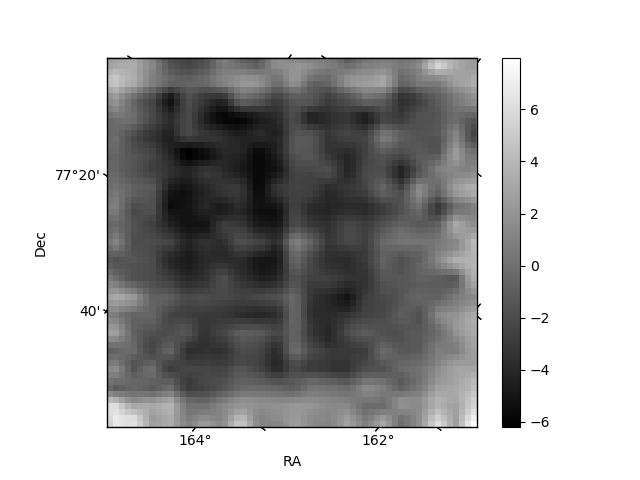
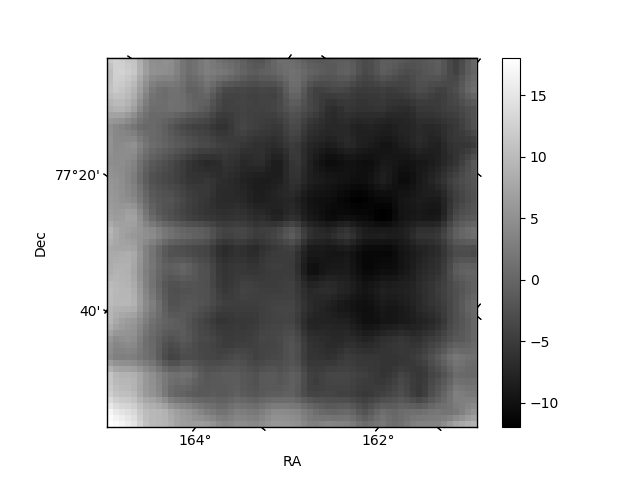
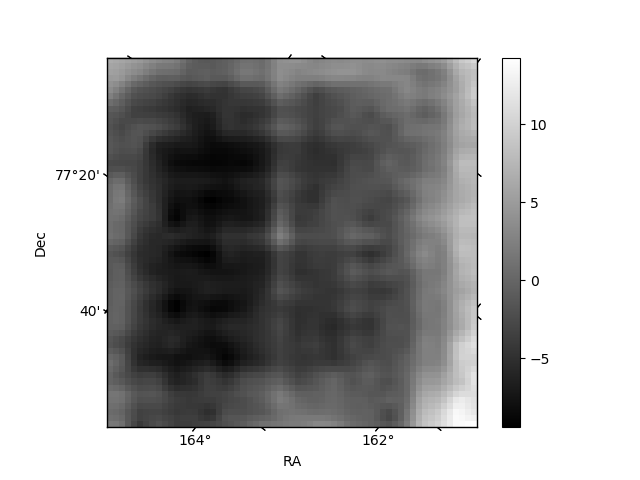
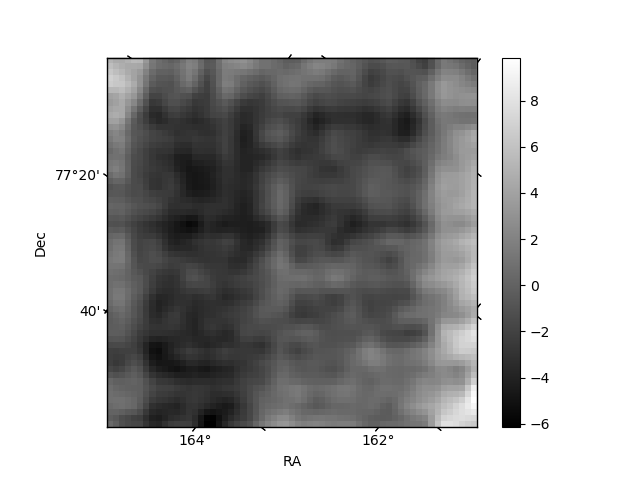
Histogram calculated using DETX and DETY for each event in the final _common_clean file
| Quadrant A | 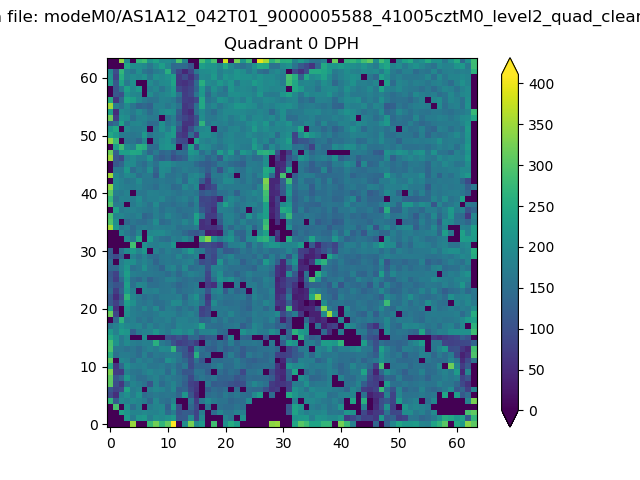 |
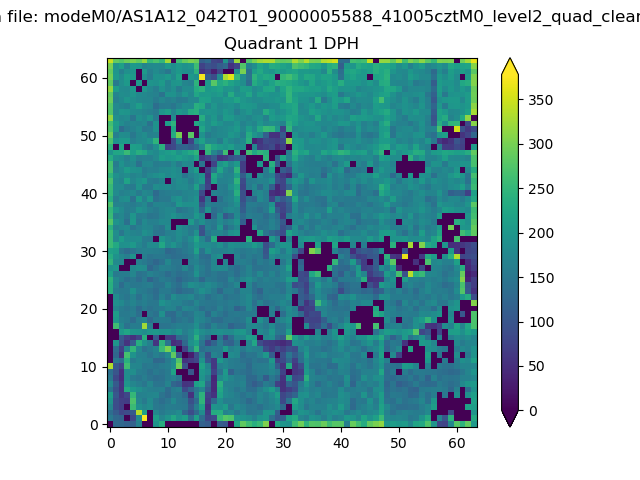 |
Quadrant B |
|---|---|---|---|
| Quadrant D | 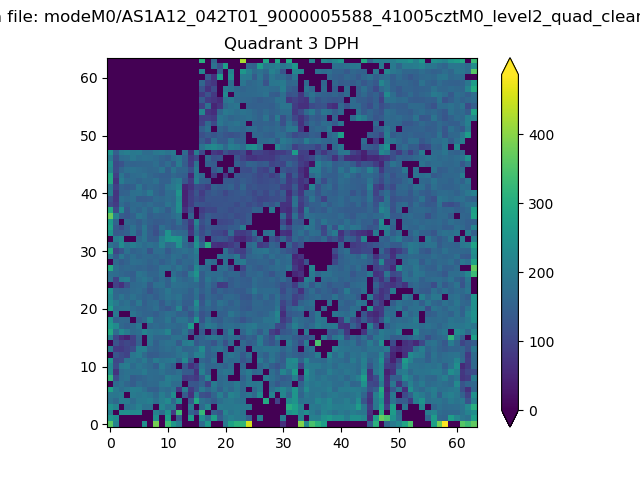 |
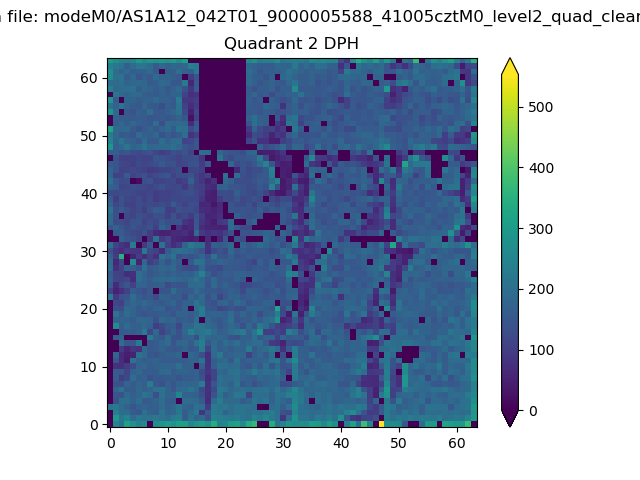 |
Quadrant C |
| Plot type | Count rate plots | Images |
|---|---|---|
| Comparison with Poisson distribution Blue bars denote a histogram of data divided into 1 sec bins. Red curve is a Poisson curve with rate = median count rate of data. |
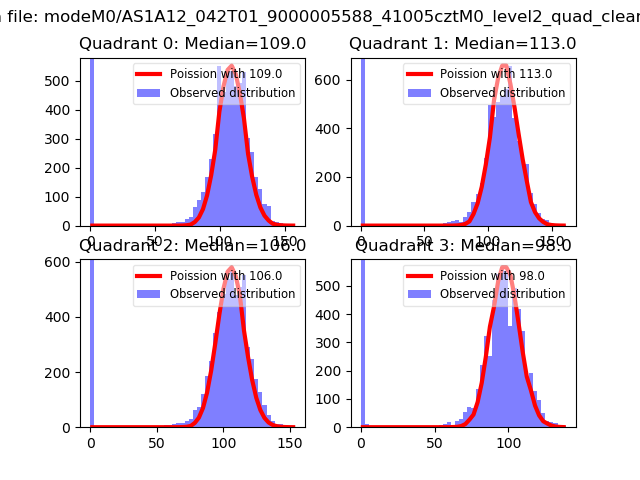 |
 |
| Quadrant-wise count rates Data is divided into 100 sec bins |
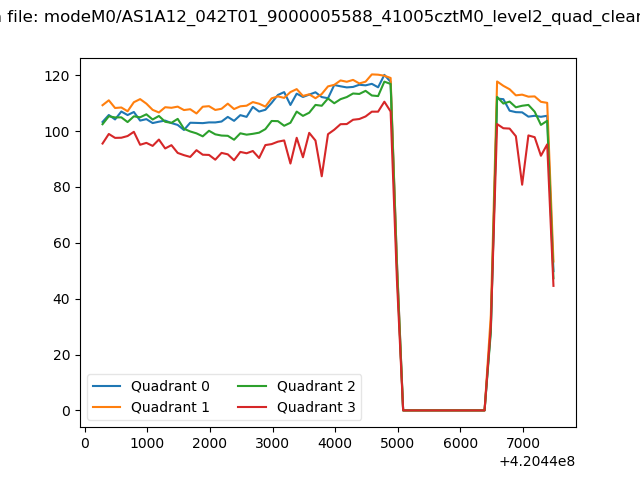 |
|
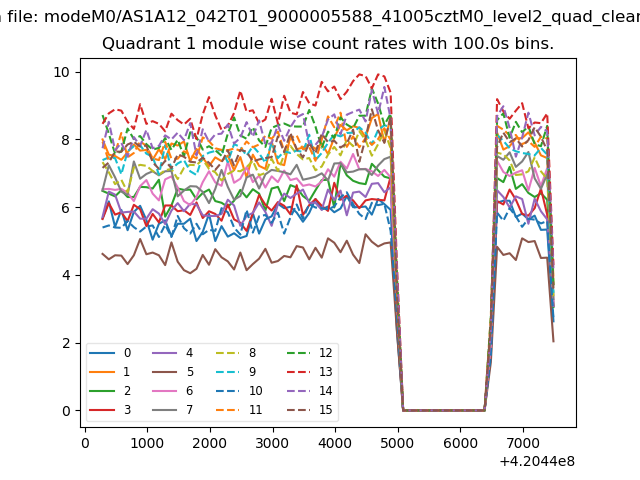
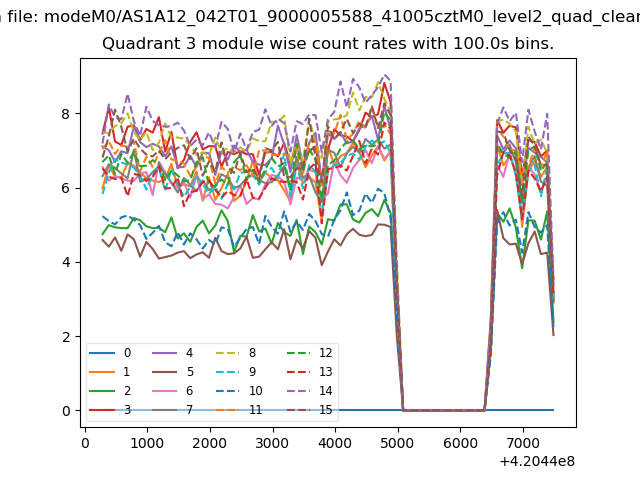
| Module-wise count rates for Quadrant A Data is divided into 100 sec bins |
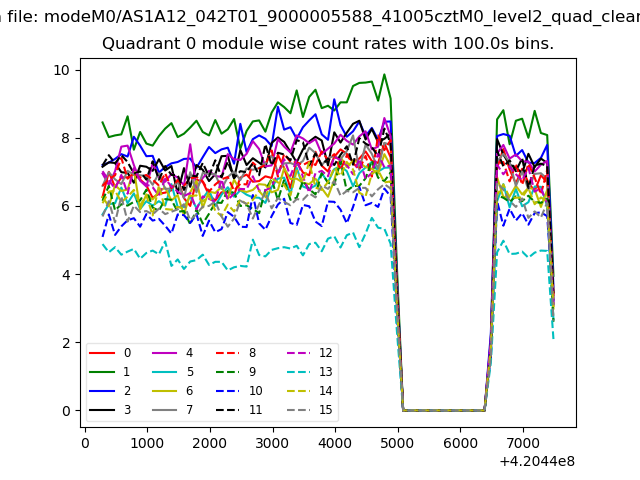 |
 |
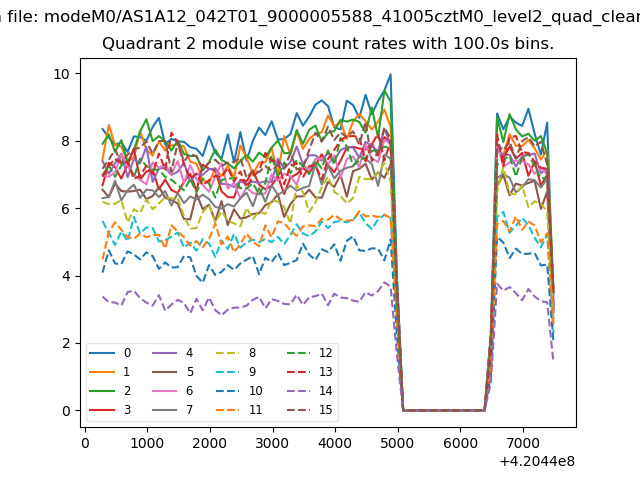
| Module-wise count rates for Quadrant B Data is divided into 100 sec bins |
 |
 |
| Module-wise count rates for Quadrant C Data is divided into 100 sec bins |
 |
 |
| Module-wise count rates for Quadrant D Data is divided into 100 sec bins |
 |
 |
| Parameter | Plot |
|---|---|
| CZT HV Monitor | 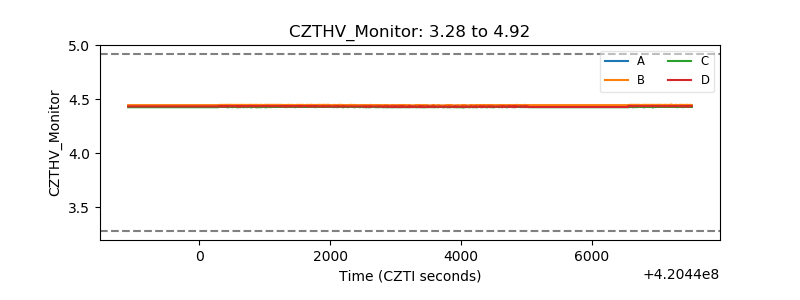 |
| D_VDD | 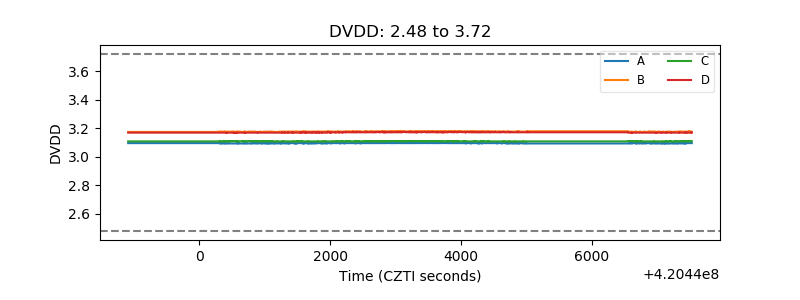 |
| Temperature 1 | 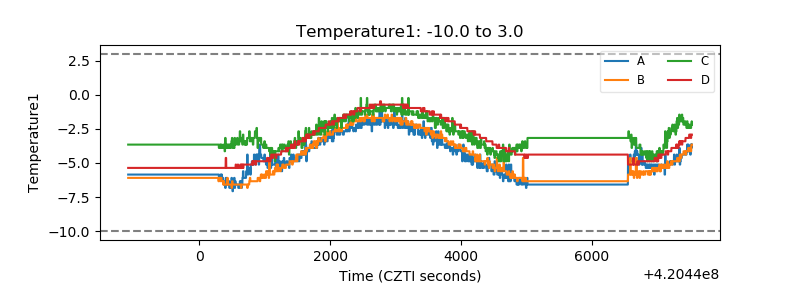 |
| Veto HV Monitor | 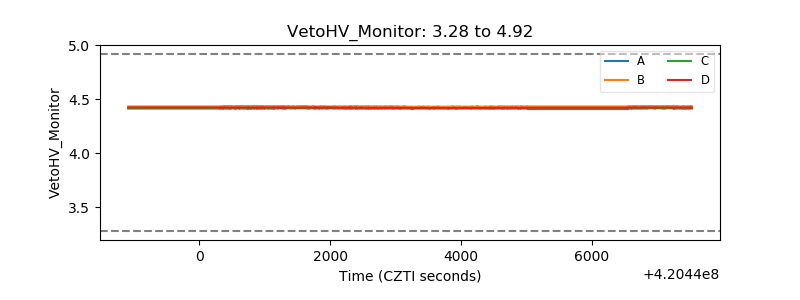 |
| Veto LLD | 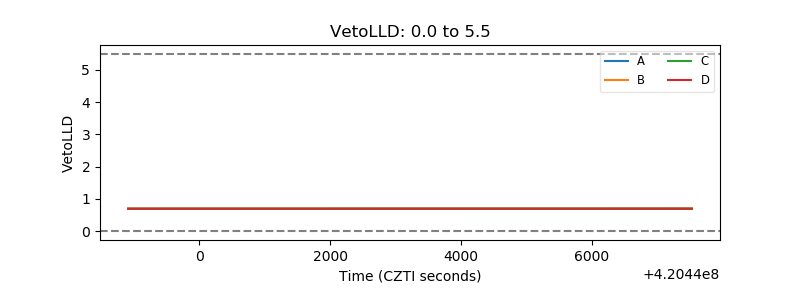 |
| Alpha Counter | 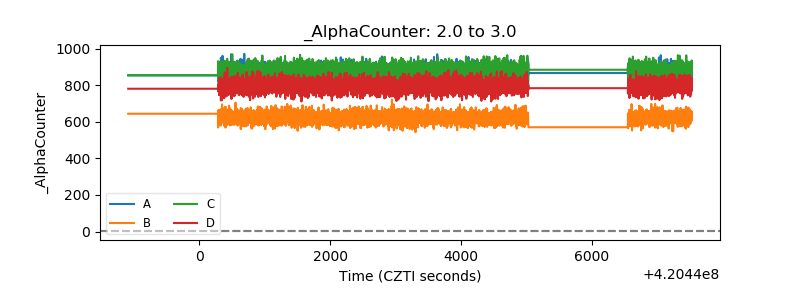 |
| _CPM_Rate | 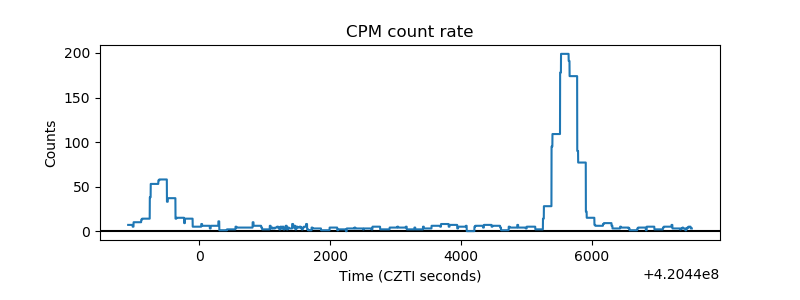 |
| CZT Counter | 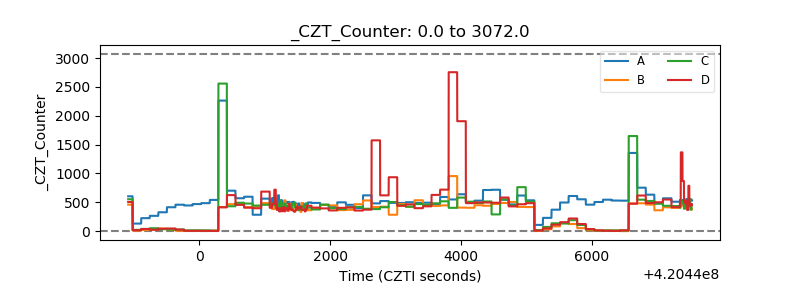 |
| +2.5 Volts monitor | 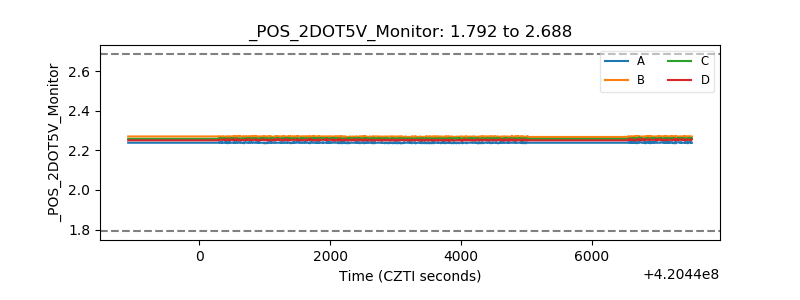 |
| +5 Volts monitor | 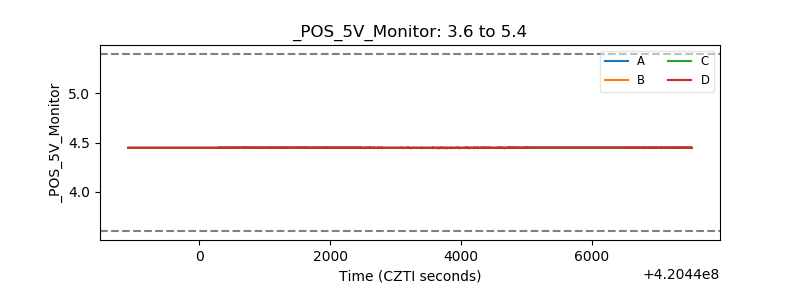 |
| _ROLL_ROT | 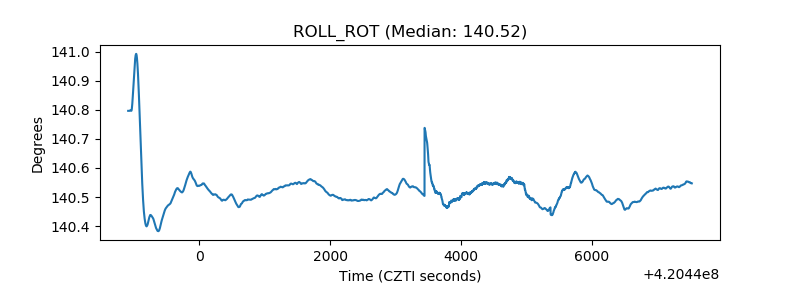 |
| _Roll_DEC |  |
| _Roll_RA | 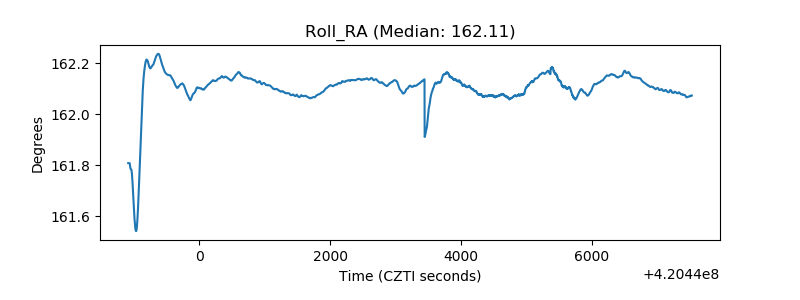 |
| Veto Counter | 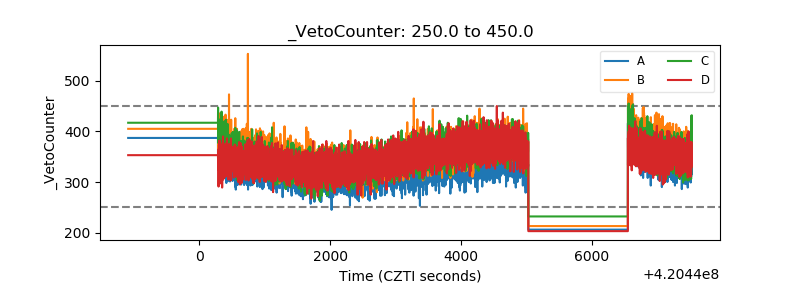 |