| Param | Original file | Final file |
|---|---|---|
| Filename | modeM0/AS1A12_042T01_9000005588_41006cztM0_level2.fits | modeM0/AS1A12_042T01_9000005588_41006cztM0_level2_quad_clean.evt |
| Size (bytes) | 316,428,480 | 91,834,560 |
| Size | 301.8 MB | 87.6 MB |
| Events in quadrant A | 3,010,181 | 613,426 |
| Events in quadrant B | 2,478,094 | 636,844 |
| Events in quadrant C | 2,702,656 | 596,396 |
| Events in quadrant D | 3,086,663 | 543,130 |
| Mode SS | |||
|---|---|---|---|
| Quadrant | BADHDUFLAG | Total packets | Discarded packets |
| A | 0 | 114 | 0 |
| B | 0 | 114 | 0 |
| C | 0 | 114 | 0 |
| D | 0 | 114 | 0 |
| Mode M0 | |||
|---|---|---|---|
| Quadrant | BADHDUFLAG | Total packets | Discarded packets |
| A | 0 | 12215 | 3 |
| B | 0 | 11237 | 2 |
| C | 0 | 11592 | 2 |
| D | 0 | 12987 | 2 |
| Mode M9 | |||
|---|---|---|---|
| Quadrant | BADHDUFLAG | Total packets | Discarded packets |
| A | 0 | 26 | 0 |
| B | 0 | 26 | 0 |
| C | 0 | 26 | 0 |
| D | 0 | 27 | 0 |
| Quadrant | Total seconds | Saturated seconds | Saturation percentage |
|---|---|---|---|
| A | 5586 | 11 | 0.196921% |
| B | 5586 | 8 | 0.143215% |
| C | 5586 | 20 | 0.358038% |
| D | 5586 | 113 | 2.022914% |
Noise dominated data is calculated using 1-second bins in cleaned event files. If a bin has >2000 counts, and if more than 50% of those come from <1% of pixels, then it is considered to be noise-dominated and hence unusable.
| Quadrant | # 1 sec bins | Bins with >0 counts | Bins with >2000 counts | High rate bins dominated by noise | Noise dominated (total time) | Noise dominated (detector-on time) | Marked lightcurve |
|---|---|---|---|---|---|---|---|
| A | 7228 | 5587 | 4 | 4 | 0.06% | 0.07% | 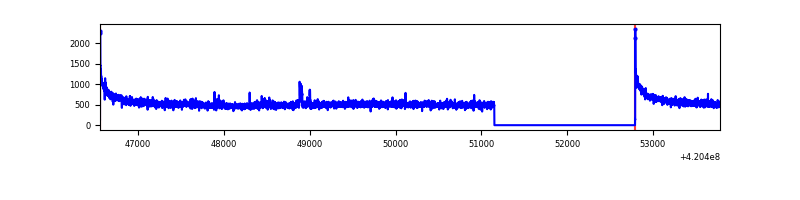 |
| B | 7228 | 5587 | 0 | 0 | 0.00% | 0.00% | 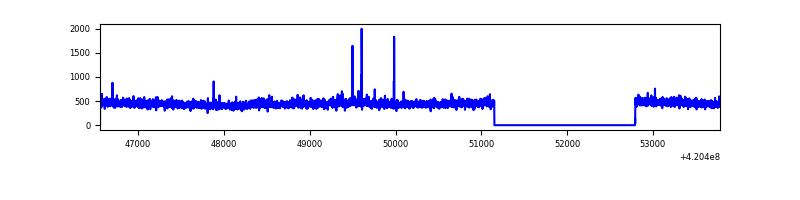 |
| C | 7228 | 5587 | 15 | 15 | 0.21% | 0.27% | 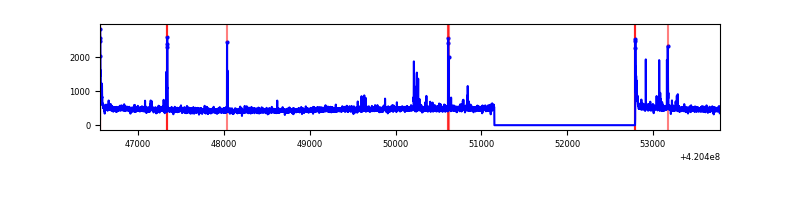 |
| D | 7228 | 5587 | 101 | 101 | 1.40% | 1.81% | 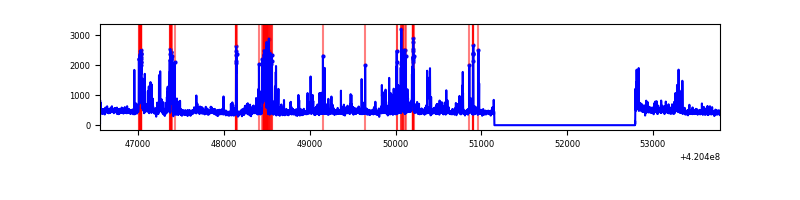 |
Top three noisy pixels from each quadrant. If the there are fewer than three noisy pixels in the level2.evt file, extra rows are filled as -1
| Pixel properties | Quadrant properties | ||||||
|---|---|---|---|---|---|---|---|
| Quadrant | DetID | PixID | Counts | Sigma | Mean | Median | Sigma |
| A | 10 | 83 | 552110 | 4331.29 | 616 | 602 | 127.3 |
| A | 12 | 189 | 71776 | 558.97 | 616 | 602 | 127.3 |
| A | 13 | 254 | 8508 | 62.09 | 616 | 602 | 127.3 |
| B | 0 | 186 | 45206 | 374.89 | 614 | 598 | 119.0 |
| B | 12 | 111 | 15152 | 122.31 | 614 | 598 | 119.0 |
| B | 11 | 111 | 13689 | 110.02 | 614 | 598 | 119.0 |
| C | 15 | 214 | 243687 | 1741.91 | 596 | 598 | 139.6 |
| C | 12 | 249 | 60380 | 428.38 | 596 | 598 | 139.6 |
| C | 0 | 10 | 47418 | 335.5 | 596 | 598 | 139.6 |
| D | 13 | 249 | 358599 | 2506.76 | 592 | 576 | 142.8 |
| D | 12 | 233 | 137008 | 955.25 | 592 | 576 | 142.8 |
| D | 2 | 153 | 119586 | 833.27 | 592 | 576 | 142.8 |
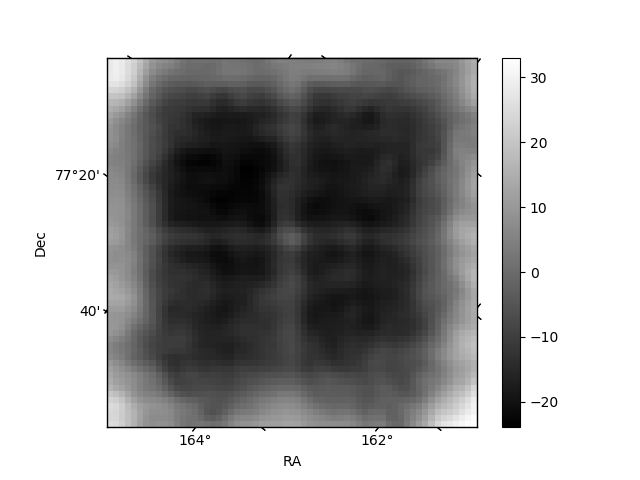
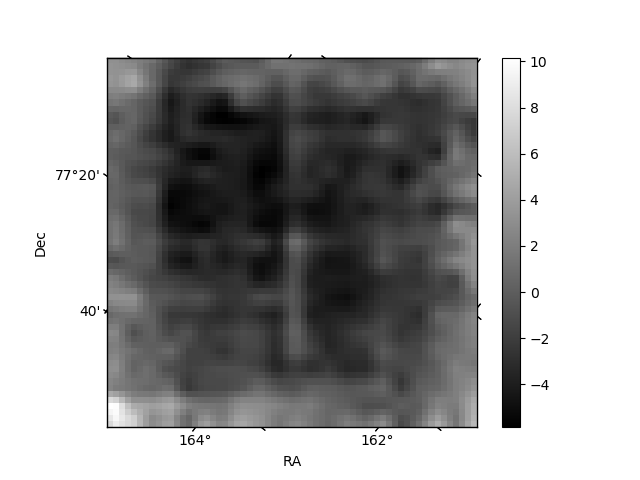
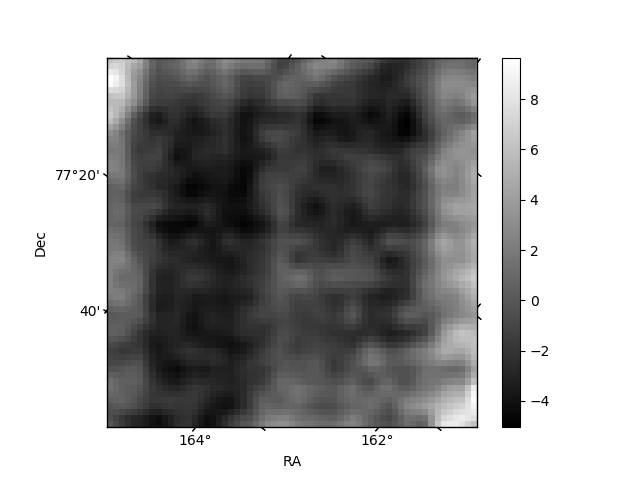
Histogram calculated using DETX and DETY for each event in the final _common_clean file
| Quadrant A | 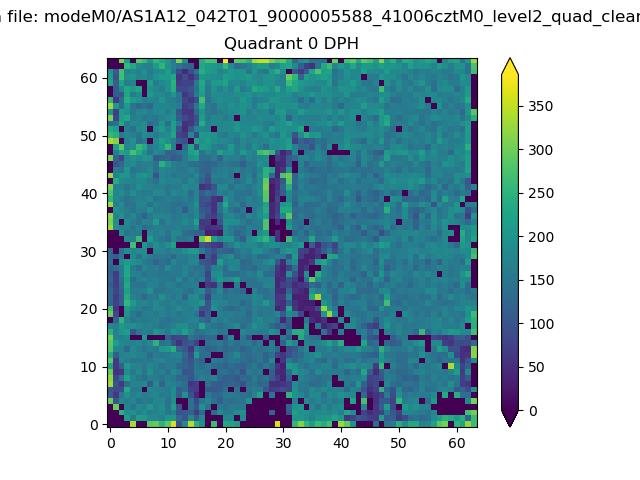 |
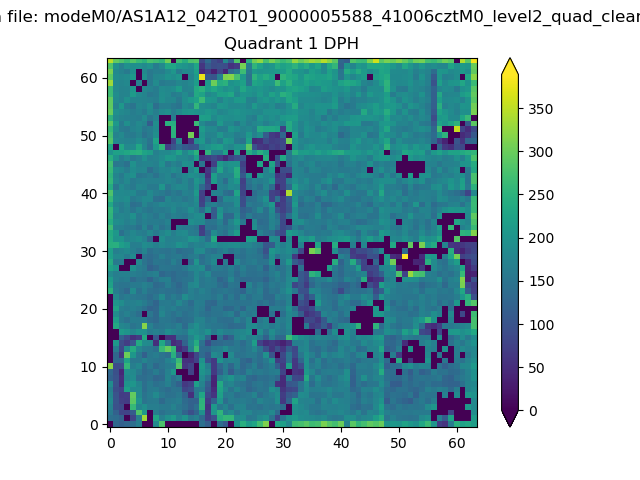 |
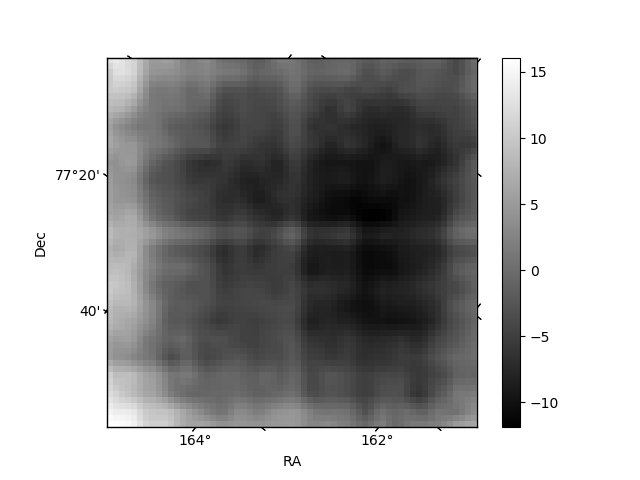
Quadrant B |
|---|---|---|---|
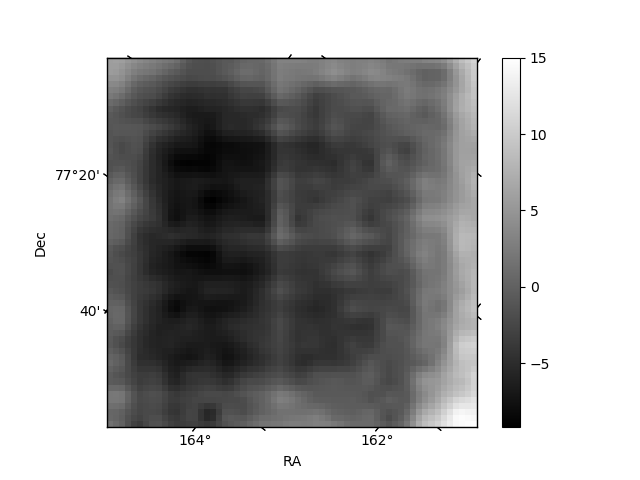
| Quadrant D | 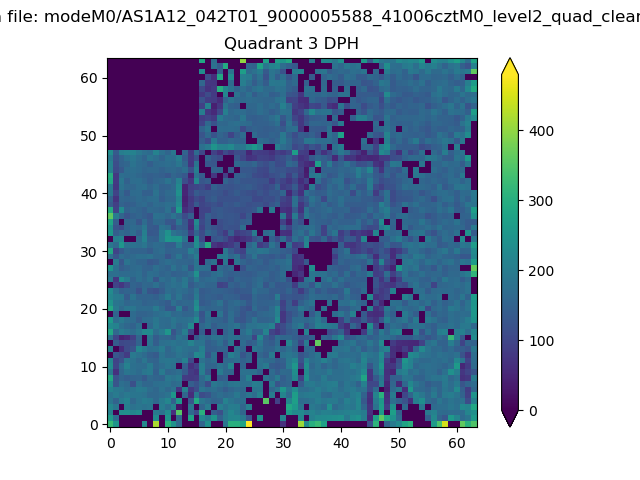 |
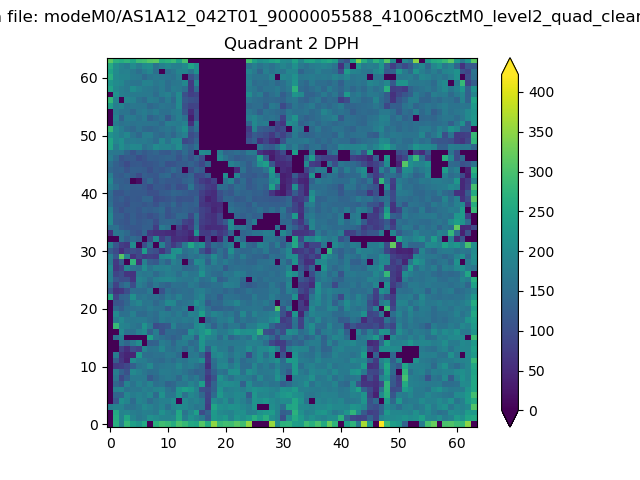 |
Quadrant C |
| Plot type | Count rate plots | Images |
|---|---|---|
| Comparison with Poisson distribution Blue bars denote a histogram of data divided into 1 sec bins. Red curve is a Poisson curve with rate = median count rate of data. |
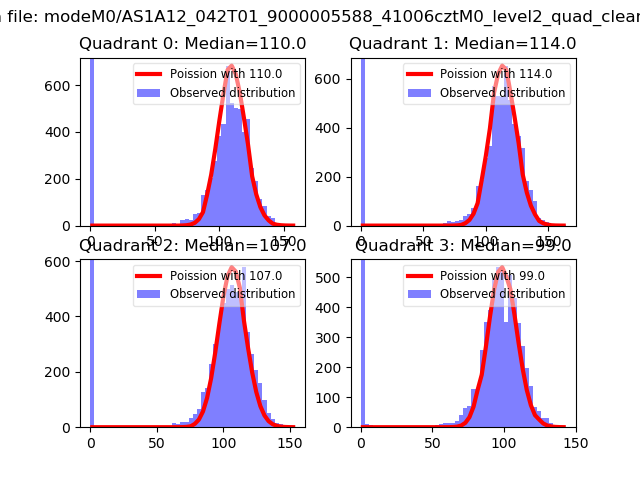 |
 |
| Quadrant-wise count rates Data is divided into 100 sec bins |
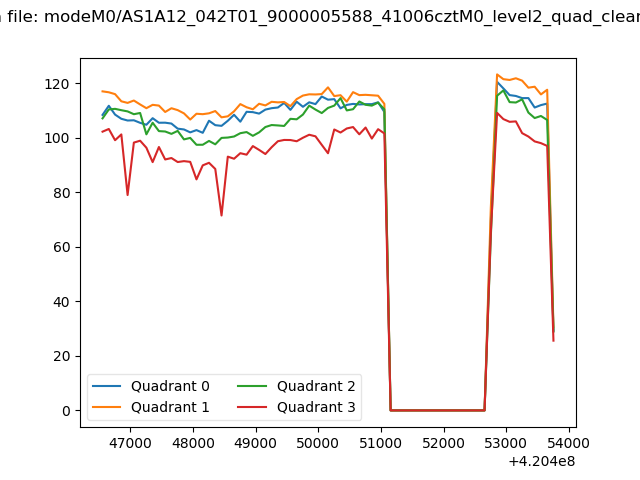 |
|
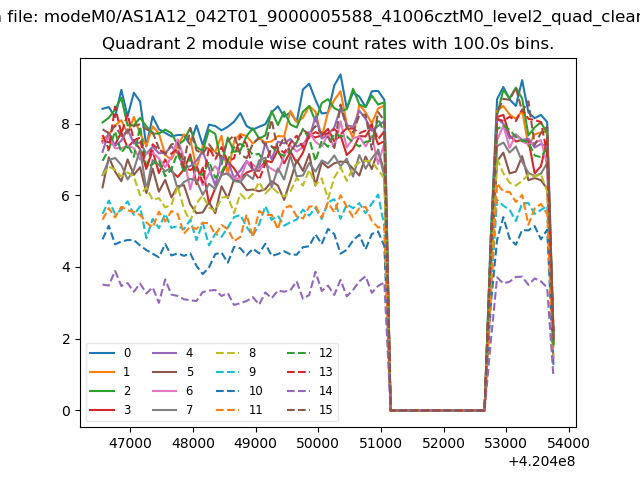
| Module-wise count rates for Quadrant A Data is divided into 100 sec bins |
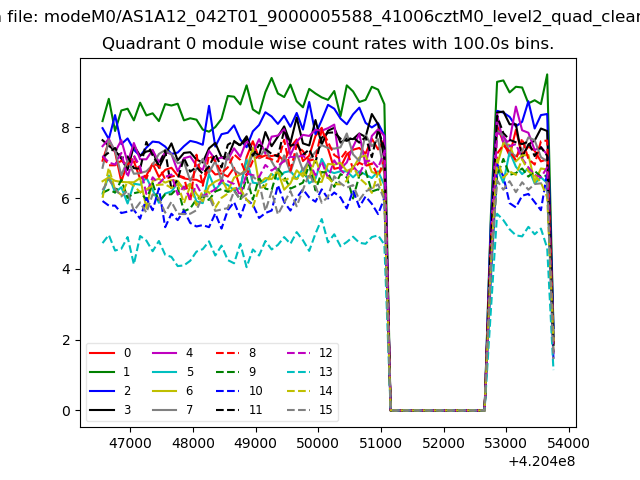 |
 |
| Module-wise count rates for Quadrant B Data is divided into 100 sec bins |
 |
 |
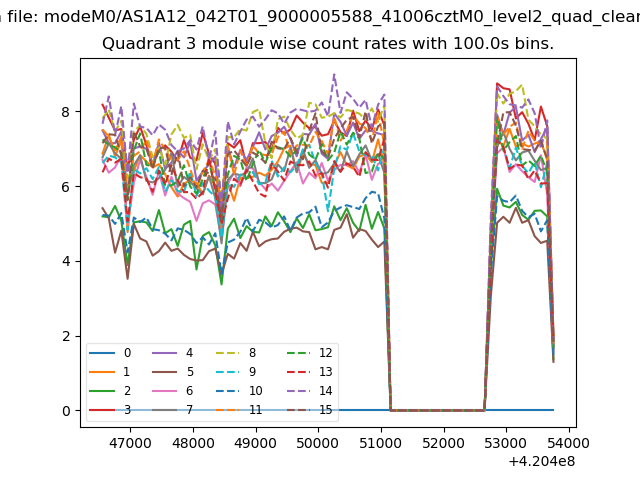
| Module-wise count rates for Quadrant C Data is divided into 100 sec bins |
 |
 |
| Module-wise count rates for Quadrant D Data is divided into 100 sec bins |
 |
 |
| Parameter | Plot |
|---|---|
| CZT HV Monitor | 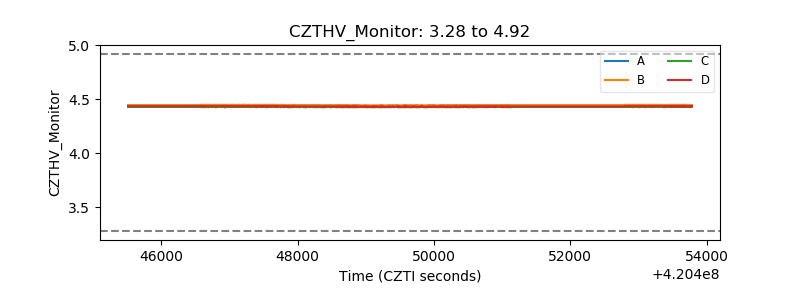 |
| D_VDD | 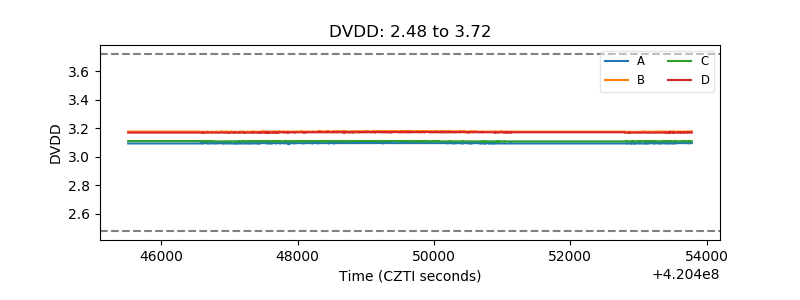 |
| Temperature 1 | 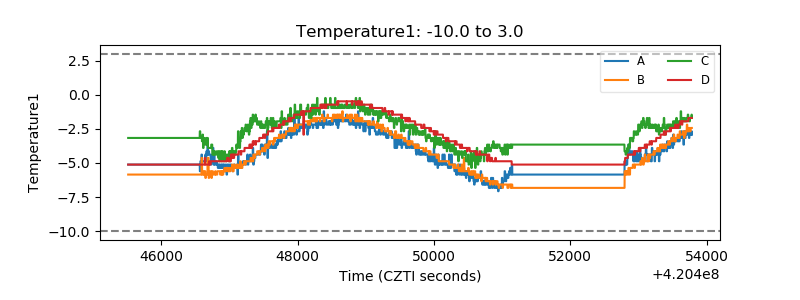 |
| Veto HV Monitor |  |
| Veto LLD | 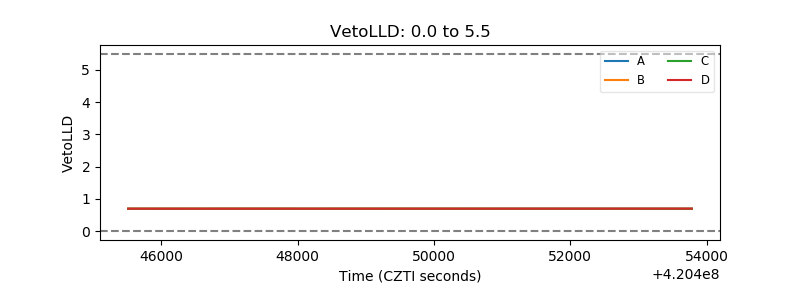 |
| Alpha Counter | 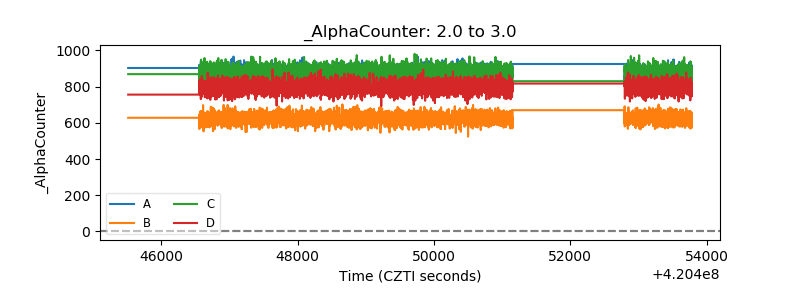 |
| _CPM_Rate |  |
| CZT Counter | 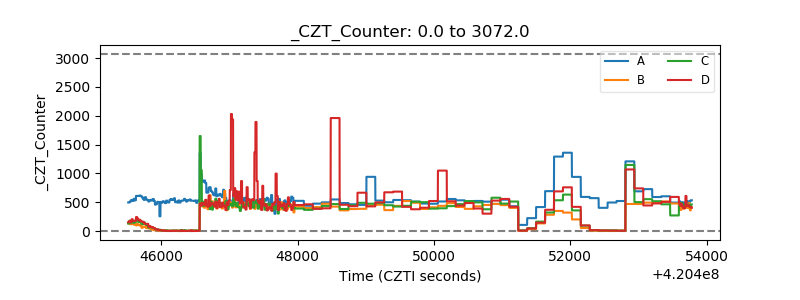 |
| +2.5 Volts monitor | 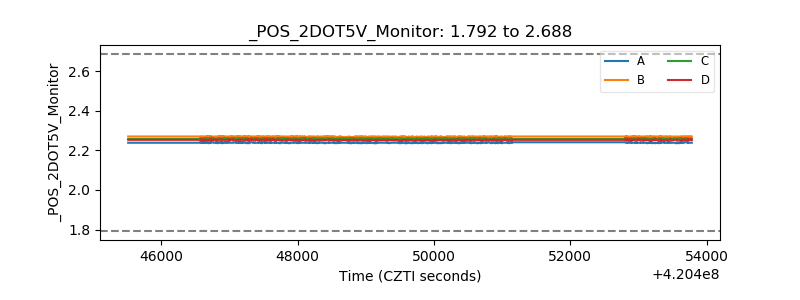 |
| +5 Volts monitor |  |
| _ROLL_ROT | 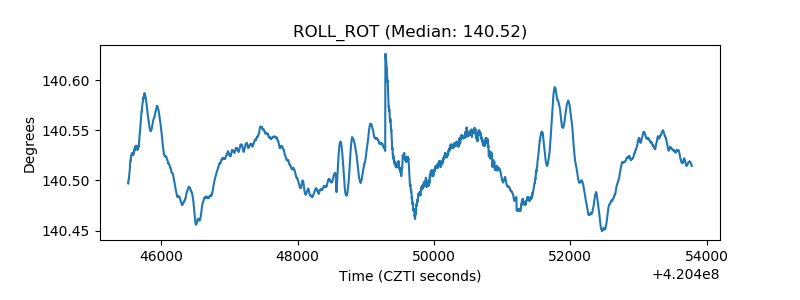 |
| _Roll_DEC | 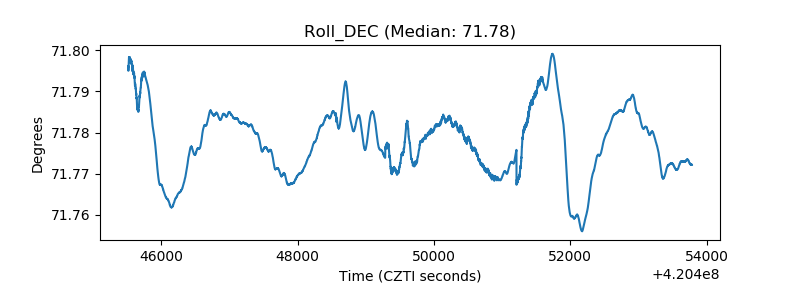 |
| _Roll_RA | 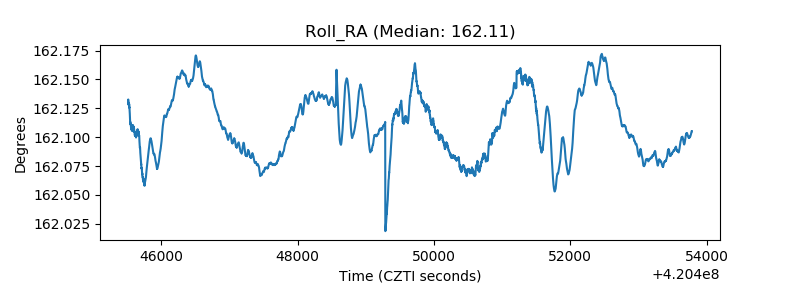 |
| Veto Counter | 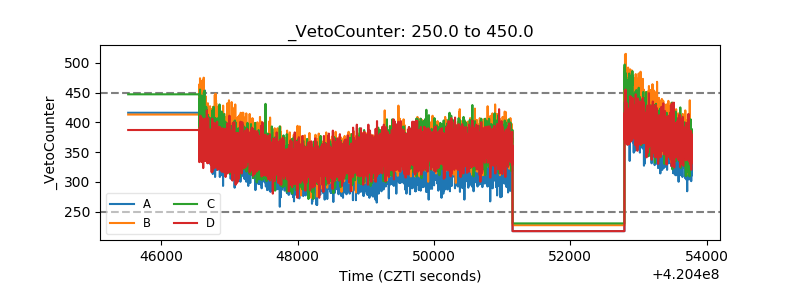 |