| Param | Original file | Final file |
|---|---|---|
| Filename | modeM0/AS1A12_042T01_9000005588_41008cztM0_level2.fits | modeM0/AS1A12_042T01_9000005588_41008cztM0_level2_quad_clean.evt |
| Size (bytes) | 310,446,720 | 90,561,600 |
| Size | 296.1 MB | 86.4 MB |
| Events in quadrant A | 2,935,132 | 612,580 |
| Events in quadrant B | 2,403,089 | 627,942 |
| Events in quadrant C | 2,792,381 | 586,630 |
| Events in quadrant D | 2,941,513 | 537,975 |
| Mode SS | |||
|---|---|---|---|
| Quadrant | BADHDUFLAG | Total packets | Discarded packets |
| A | 0 | 110 | 0 |
| B | 0 | 110 | 0 |
| C | 0 | 110 | 0 |
| D | 0 | 110 | 0 |
| Mode M0 | |||
|---|---|---|---|
| Quadrant | BADHDUFLAG | Total packets | Discarded packets |
| A | 0 | 11934 | 3 |
| B | 0 | 10838 | 2 |
| C | 0 | 11666 | 2 |
| D | 0 | 12460 | 2 |
| Mode M9 | |||
|---|---|---|---|
| Quadrant | BADHDUFLAG | Total packets | Discarded packets |
| A | 0 | 23 | 0 |
| B | 0 | 23 | 0 |
| C | 0 | 23 | 0 |
| D | 0 | 24 | 0 |
| Quadrant | Total seconds | Saturated seconds | Saturation percentage |
|---|---|---|---|
| A | 5384 | 8 | 0.148588% |
| B | 5384 | 11 | 0.204309% |
| C | 5384 | 34 | 0.631501% |
| D | 5384 | 100 | 1.857355% |
Noise dominated data is calculated using 1-second bins in cleaned event files. If a bin has >2000 counts, and if more than 50% of those come from <1% of pixels, then it is considered to be noise-dominated and hence unusable.
| Quadrant | # 1 sec bins | Bins with >0 counts | Bins with >2000 counts | High rate bins dominated by noise | Noise dominated (total time) | Noise dominated (detector-on time) | Marked lightcurve |
|---|---|---|---|---|---|---|---|
| A | 7147 | 5385 | 4 | 4 | 0.06% | 0.07% | 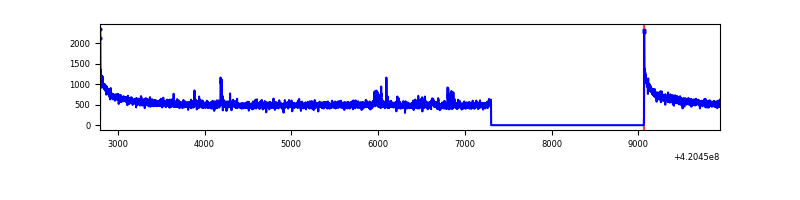 |
| B | 7147 | 5385 | 3 | 3 | 0.04% | 0.06% | 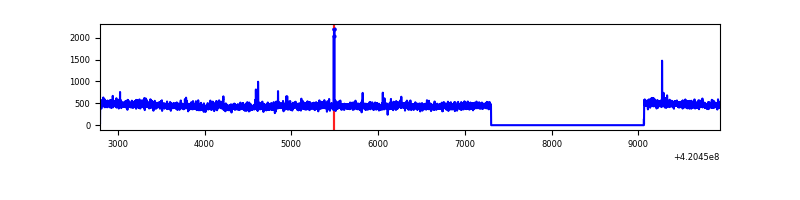 |
| C | 7147 | 5385 | 34 | 34 | 0.48% | 0.63% | 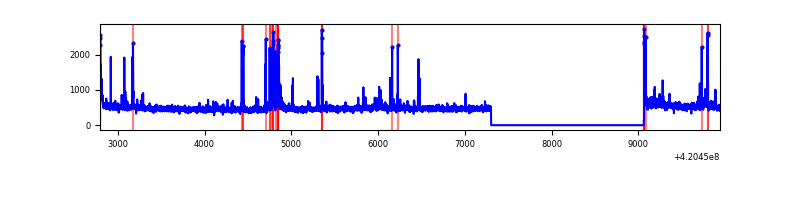 |
| D | 7147 | 5385 | 94 | 94 | 1.32% | 1.75% | 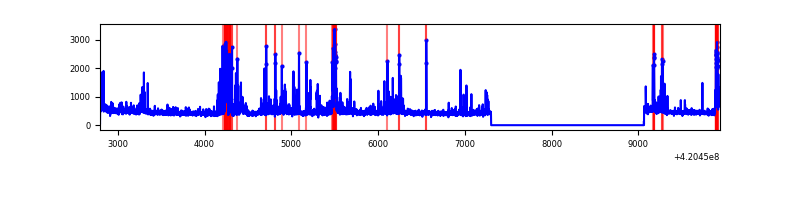 |
Top three noisy pixels from each quadrant. If the there are fewer than three noisy pixels in the level2.evt file, extra rows are filled as -1
| Pixel properties | Quadrant properties | ||||||
|---|---|---|---|---|---|---|---|
| Quadrant | DetID | PixID | Counts | Sigma | Mean | Median | Sigma |
| A | 10 | 83 | 539359 | 4368.39 | 601 | 588 | 123.3 |
| A | 12 | 189 | 68884 | 553.75 | 601 | 588 | 123.3 |
| A | 13 | 254 | 8330 | 62.77 | 601 | 588 | 123.3 |
| B | 0 | 186 | 22966 | 194.82 | 597 | 580 | 114.9 |
| B | 5 | 255 | 16683 | 140.14 | 597 | 580 | 114.9 |
| B | 12 | 111 | 14479 | 120.96 | 597 | 580 | 114.9 |
| C | 15 | 214 | 233482 | 1735.81 | 580 | 583 | 134.2 |
| C | 12 | 249 | 144635 | 1073.63 | 580 | 583 | 134.2 |
| C | 14 | 254 | 72859 | 538.68 | 580 | 583 | 134.2 |
| D | 13 | 249 | 234254 | 1688.63 | 578 | 562 | 138.4 |
| D | 12 | 233 | 183481 | 1321.75 | 578 | 562 | 138.4 |
| D | 2 | 249 | 59243 | 424.02 | 578 | 562 | 138.4 |
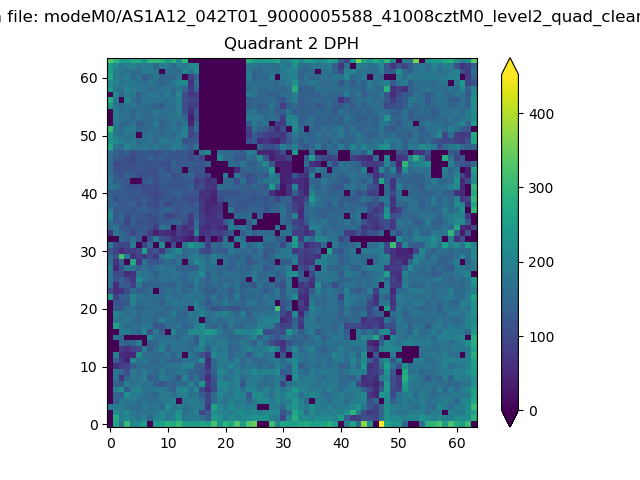
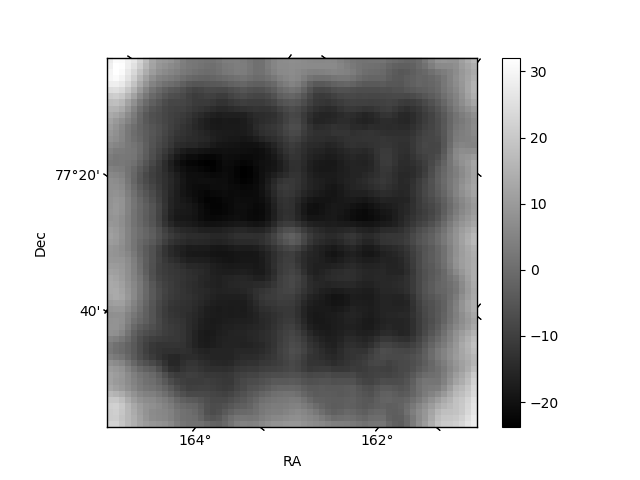
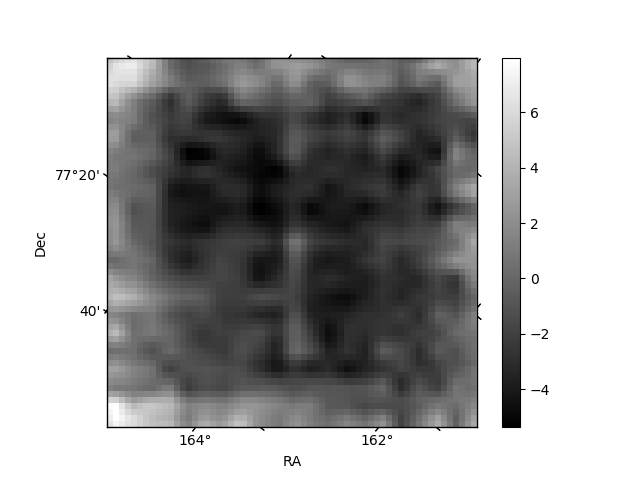
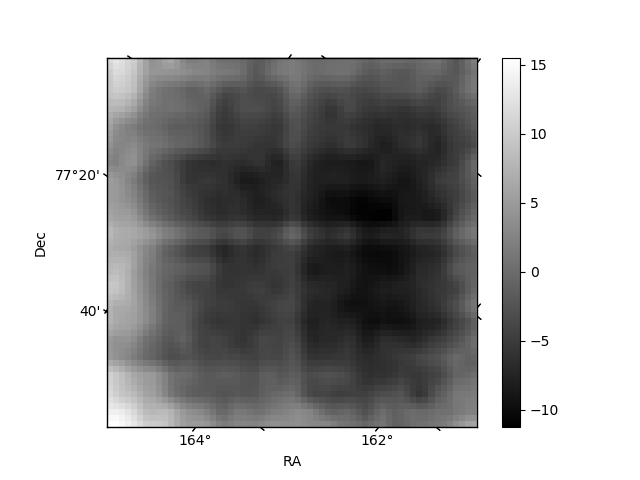
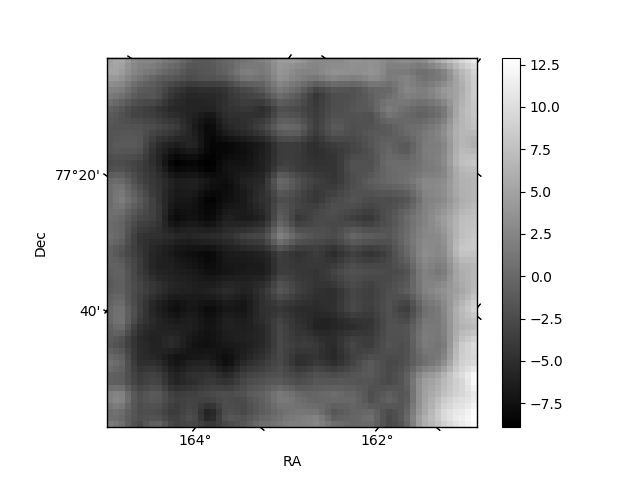
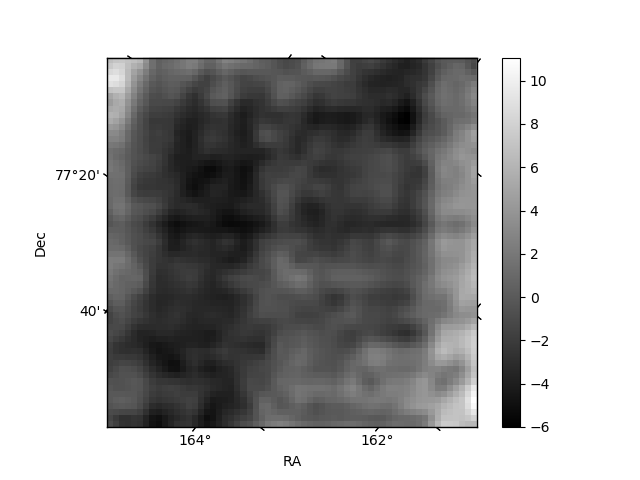
Histogram calculated using DETX and DETY for each event in the final _common_clean file
| Quadrant A | 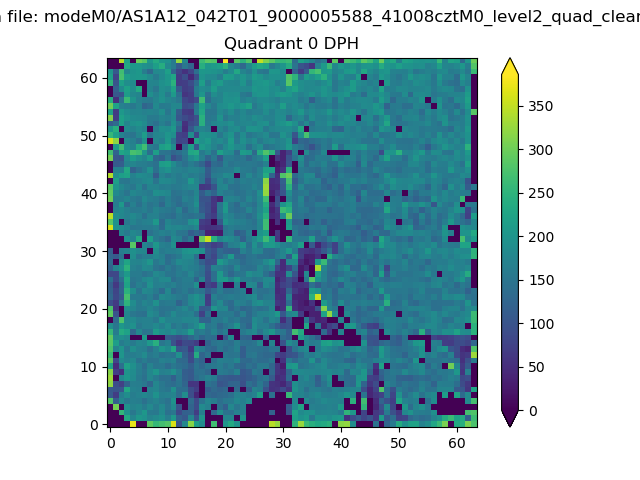 |
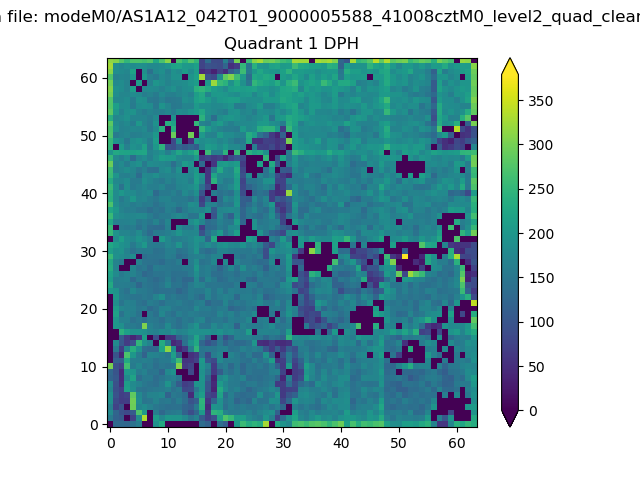 |
Quadrant B |
|---|---|---|---|
| Quadrant D | 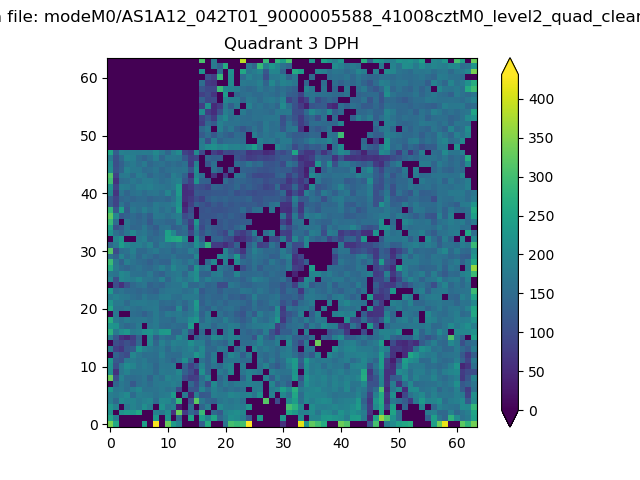 |
 |
Quadrant C |
| Plot type | Count rate plots | Images |
|---|---|---|
| Comparison with Poisson distribution Blue bars denote a histogram of data divided into 1 sec bins. Red curve is a Poisson curve with rate = median count rate of data. |
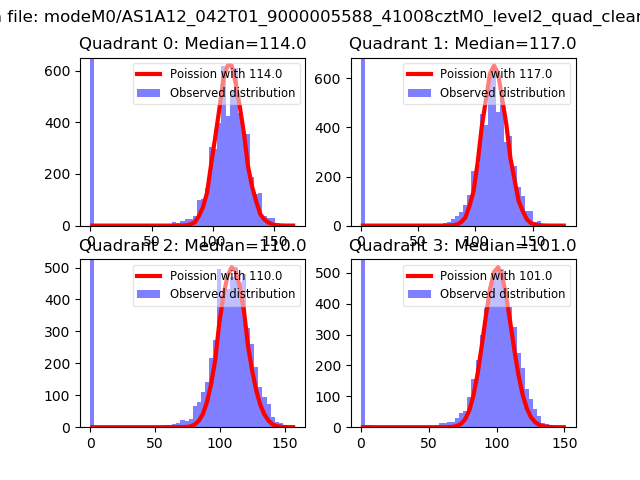 |
 |
| Quadrant-wise count rates Data is divided into 100 sec bins |
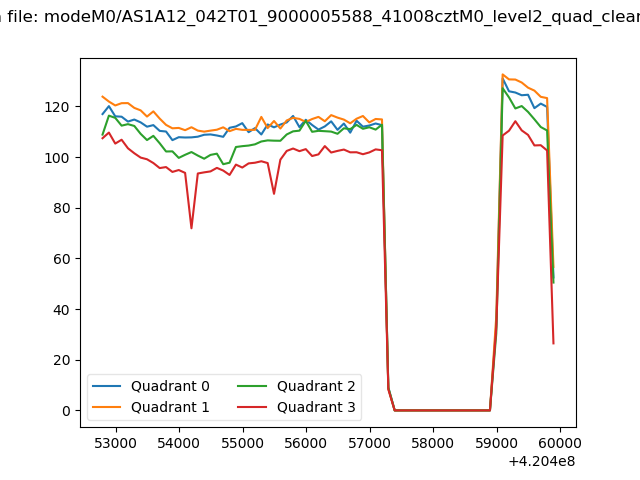 |
|
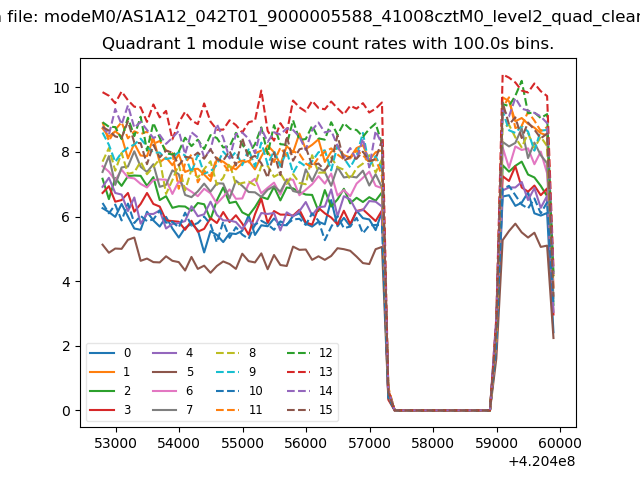
| Module-wise count rates for Quadrant A Data is divided into 100 sec bins |
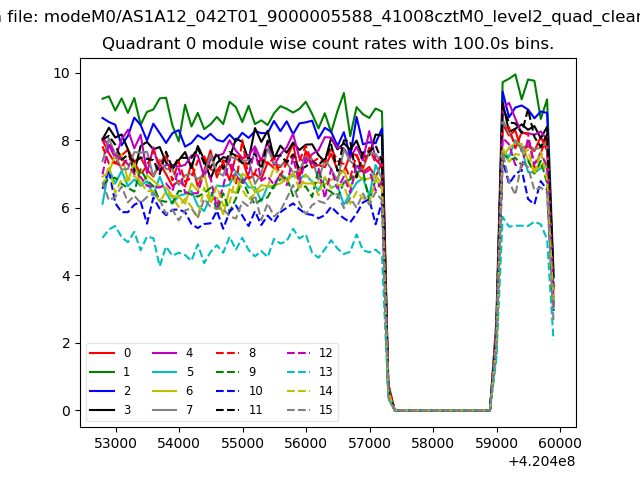 |
 |
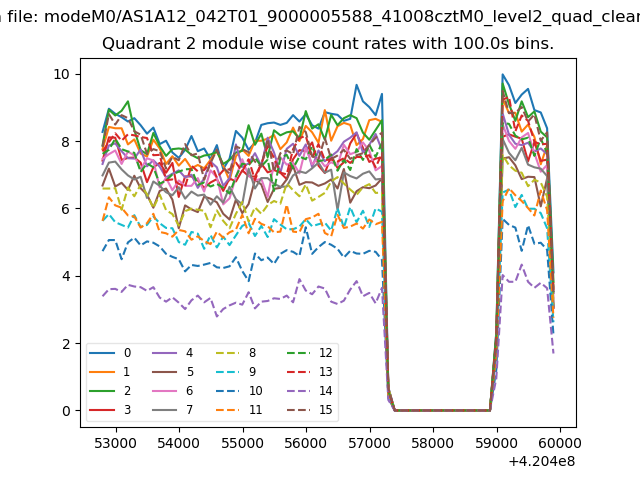
| Module-wise count rates for Quadrant B Data is divided into 100 sec bins |
 |
 |
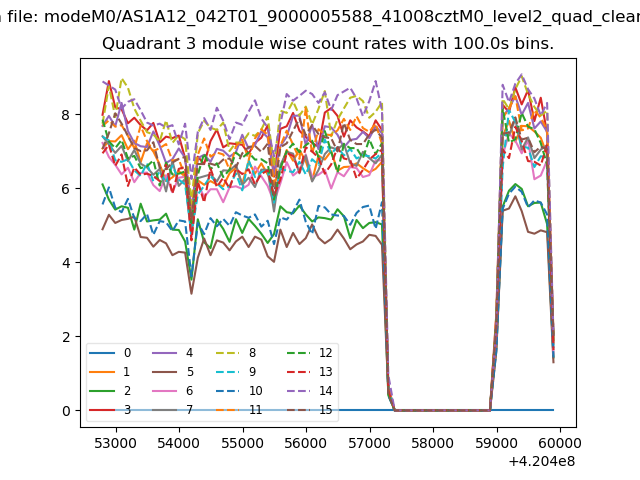
| Module-wise count rates for Quadrant C Data is divided into 100 sec bins |
 |
 |
| Module-wise count rates for Quadrant D Data is divided into 100 sec bins |
 |
 |
| Parameter | Plot |
|---|---|
| CZT HV Monitor | 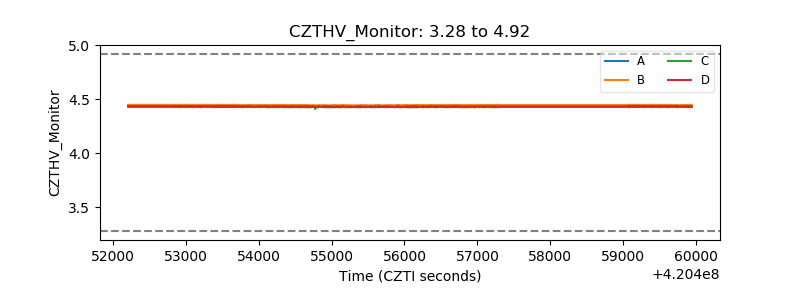 |
| D_VDD | 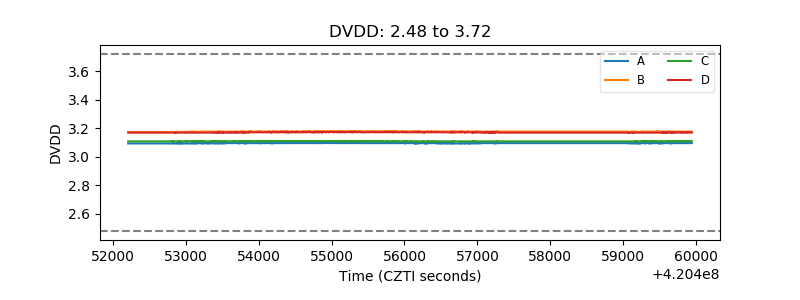 |
| Temperature 1 | 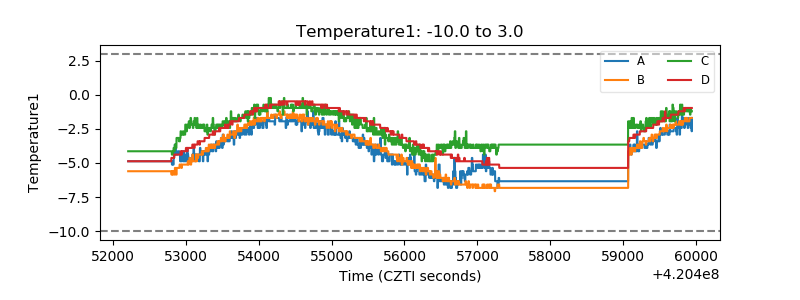 |
| Veto HV Monitor | 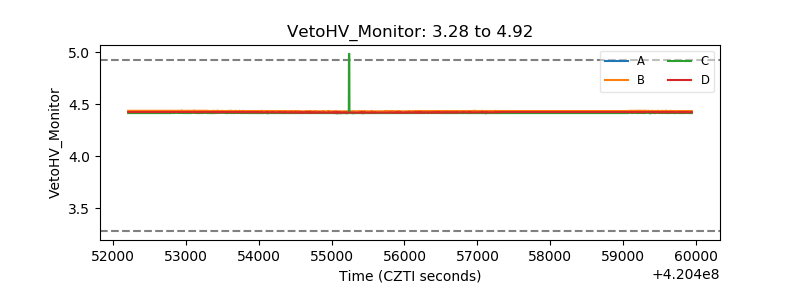 |
| Veto LLD | 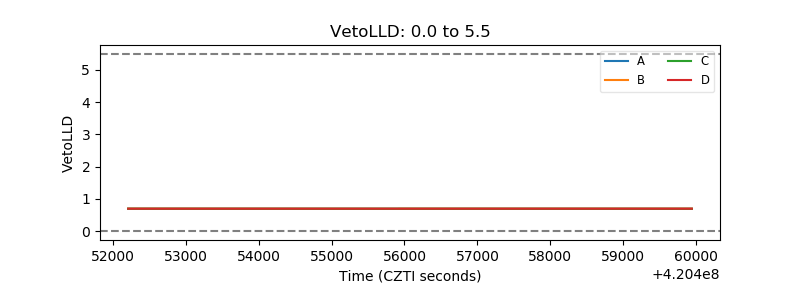 |
| Alpha Counter | 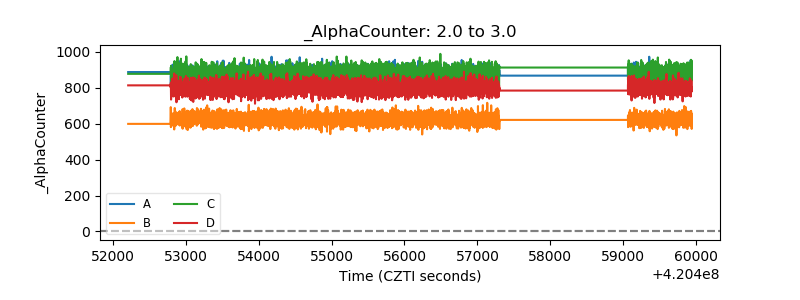 |
| _CPM_Rate | 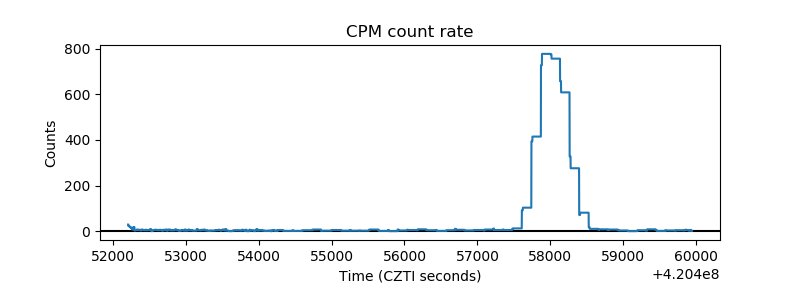 |
| CZT Counter | 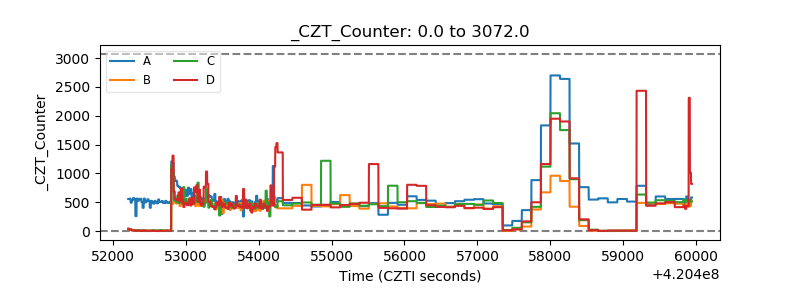 |
| +2.5 Volts monitor | 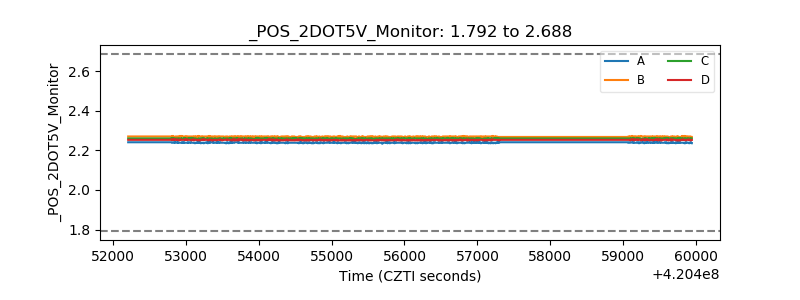 |
| +5 Volts monitor | 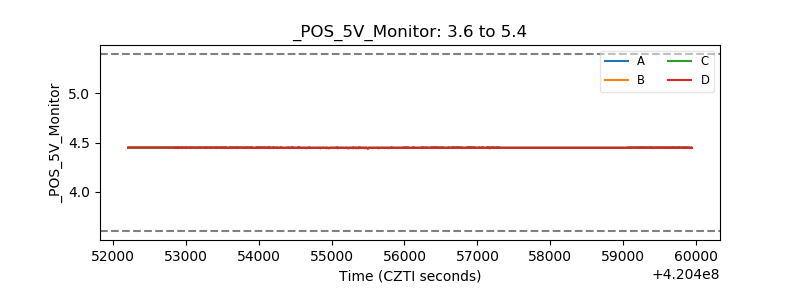 |
| _ROLL_ROT | 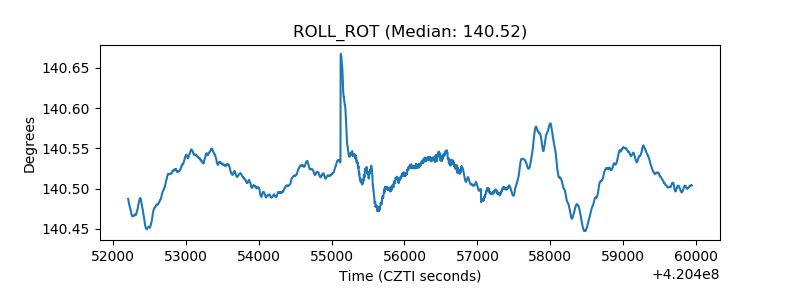 |
| _Roll_DEC | 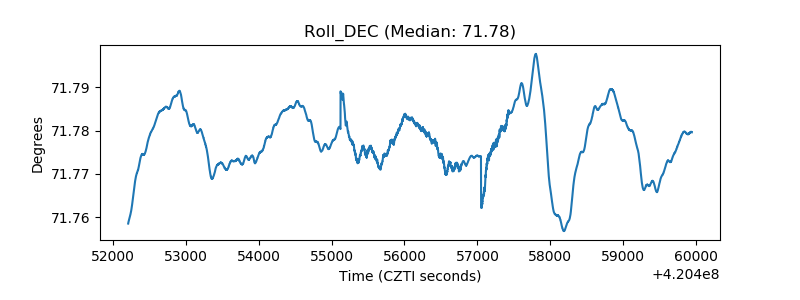 |
| _Roll_RA | 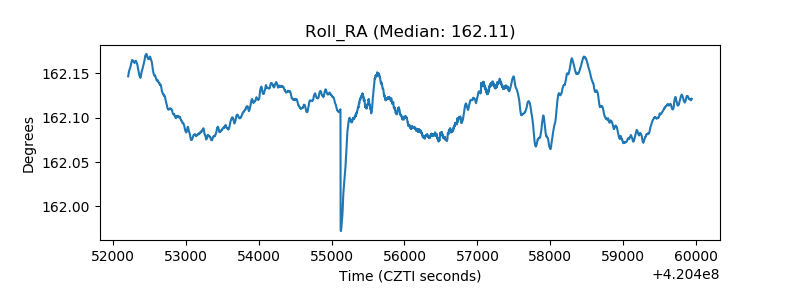 |
| Veto Counter | 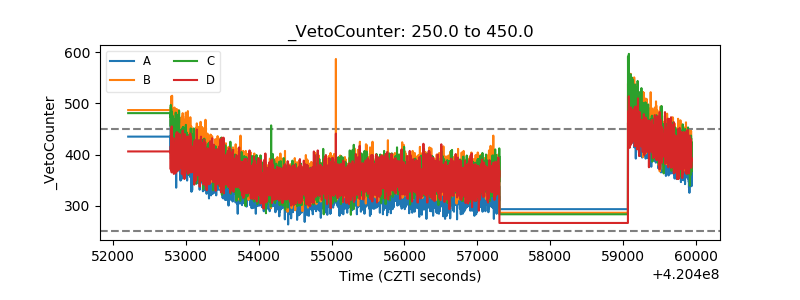 |