| Param | Original file | Final file |
|---|---|---|
| Filename | modeM0/AS1A12_042T01_9000005588_41010cztM0_level2.fits | modeM0/AS1A12_042T01_9000005588_41010cztM0_level2_quad_clean.evt |
| Size (bytes) | 302,990,400 | 89,400,960 |
| Size | 289.0 MB | 85.3 MB |
| Events in quadrant A | 2,747,864 | 610,220 |
| Events in quadrant B | 2,445,307 | 619,939 |
| Events in quadrant C | 2,964,049 | 583,997 |
| Events in quadrant D | 2,668,157 | 541,794 |
| Mode SS | |||
|---|---|---|---|
| Quadrant | BADHDUFLAG | Total packets | Discarded packets |
| A | 0 | 102 | 0 |
| B | 0 | 102 | 0 |
| C | 0 | 102 | 0 |
| D | 0 | 102 | 0 |
| Mode M0 | |||
|---|---|---|---|
| Quadrant | BADHDUFLAG | Total packets | Discarded packets |
| A | 0 | 11137 | 2 |
| B | 0 | 10555 | 1 |
| C | 0 | 11941 | 1 |
| D | 0 | 11292 | 1 |
| Mode M9 | |||
|---|---|---|---|
| Quadrant | BADHDUFLAG | Total packets | Discarded packets |
| A | 0 | 20 | 0 |
| B | 0 | 20 | 0 |
| C | 0 | 20 | 0 |
| D | 0 | 20 | 0 |
| Quadrant | Total seconds | Saturated seconds | Saturation percentage |
|---|---|---|---|
| A | 5010 | 8 | 0.159681% |
| B | 5010 | 12 | 0.239521% |
| C | 5010 | 15 | 0.299401% |
| D | 5010 | 39 | 0.778443% |
Noise dominated data is calculated using 1-second bins in cleaned event files. If a bin has >2000 counts, and if more than 50% of those come from <1% of pixels, then it is considered to be noise-dominated and hence unusable.
| Quadrant | # 1 sec bins | Bins with >0 counts | Bins with >2000 counts | High rate bins dominated by noise | Noise dominated (total time) | Noise dominated (detector-on time) | Marked lightcurve |
|---|---|---|---|---|---|---|---|
| A | 7044 | 5011 | 2 | 2 | 0.03% | 0.04% | 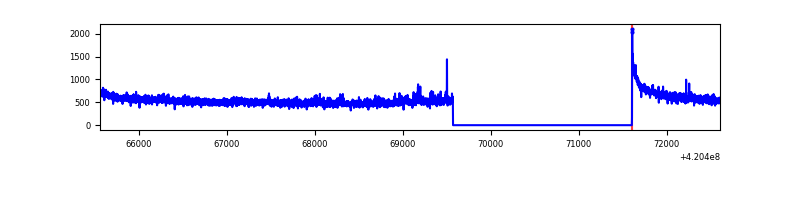 |
| B | 7044 | 5011 | 3 | 3 | 0.04% | 0.06% | 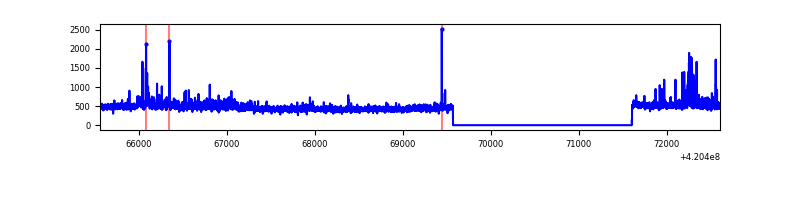 |
| C | 7044 | 5011 | 9 | 9 | 0.13% | 0.18% | 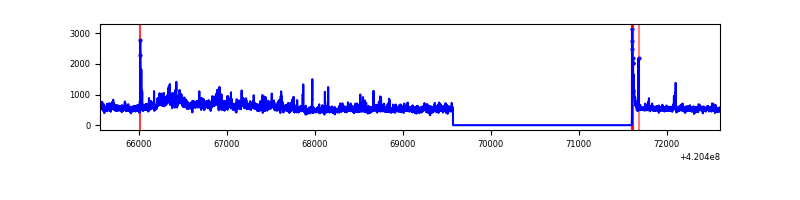 |
| D | 7044 | 5011 | 28 | 28 | 0.40% | 0.56% | 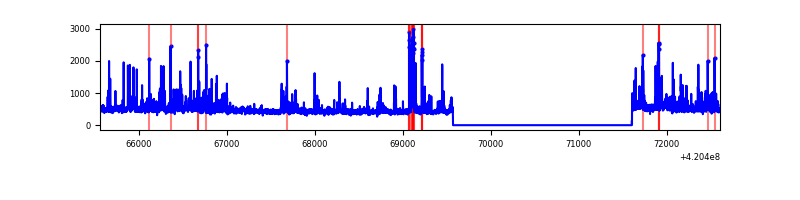 |
Top three noisy pixels from each quadrant. If the there are fewer than three noisy pixels in the level2.evt file, extra rows are filled as -1
| Pixel properties | Quadrant properties | ||||||
|---|---|---|---|---|---|---|---|
| Quadrant | DetID | PixID | Counts | Sigma | Mean | Median | Sigma |
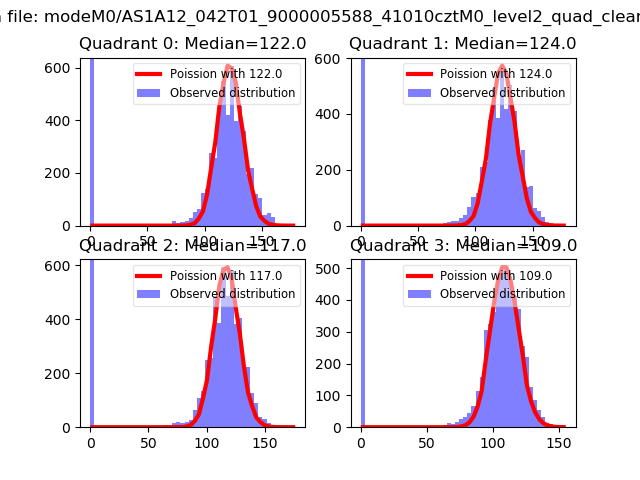
| A | 10 | 83 | 468355 | 4034.27 | 569 | 559 | 116.0 |
| A | 12 | 189 | 74322 | 636.13 | 569 | 559 | 116.0 |
| A | 13 | 254 | 7846 | 62.84 | 569 | 559 | 116.0 |
| B | 0 | 186 | 180567 | 1694.35 | 562 | 546 | 106.2 |
| B | 5 | 255 | 33222 | 307.55 | 562 | 546 | 106.2 |
| B | 12 | 111 | 12968 | 116.92 | 562 | 546 | 106.2 |
| C | 3 | 233 | 309589 | 2408.21 | 556 | 561 | 128.3 |
| C | 15 | 214 | 213744 | 1661.3 | 556 | 561 | 128.3 |
| C | 10 | 70 | 179736 | 1396.28 | 556 | 561 | 128.3 |
| D | 13 | 171 | 93726 | 690.96 | 557 | 541 | 134.9 |
| D | 12 | 233 | 83466 | 614.88 | 557 | 541 | 134.9 |
| D | 2 | 153 | 78587 | 578.71 | 557 | 541 | 134.9 |
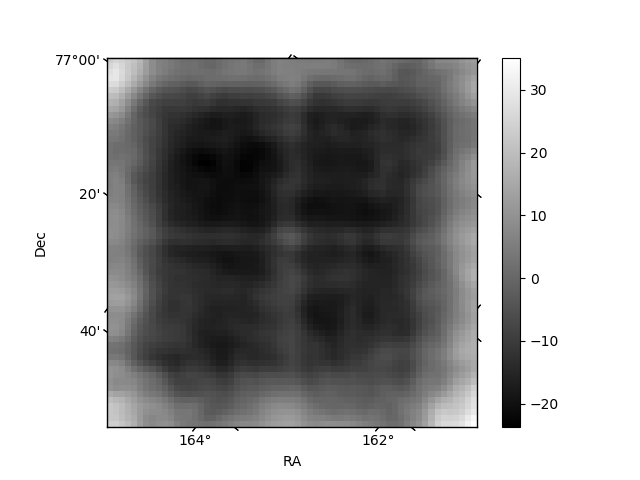
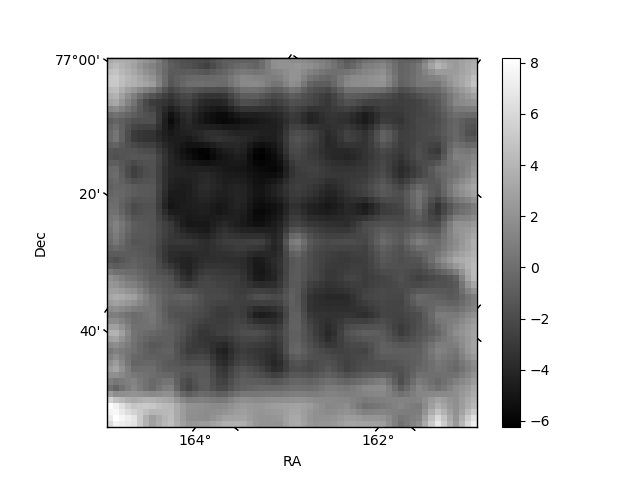
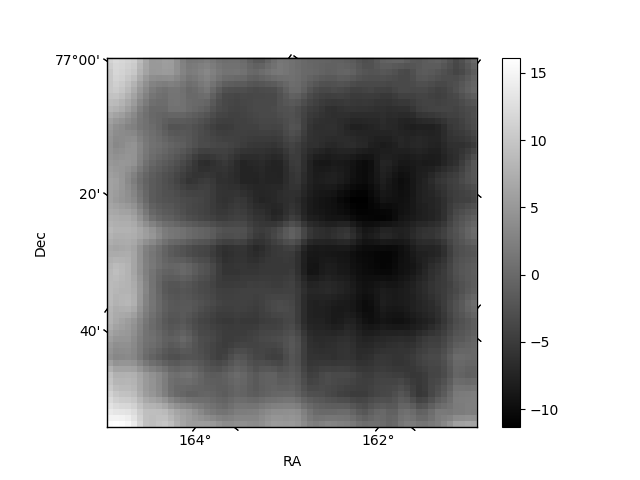
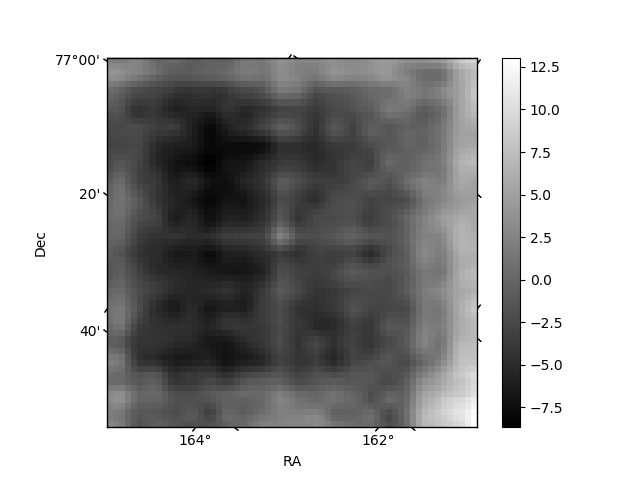
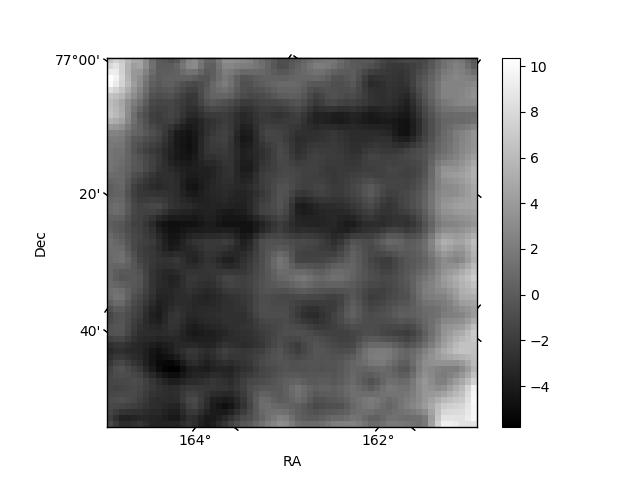
Histogram calculated using DETX and DETY for each event in the final _common_clean file
| Quadrant A | 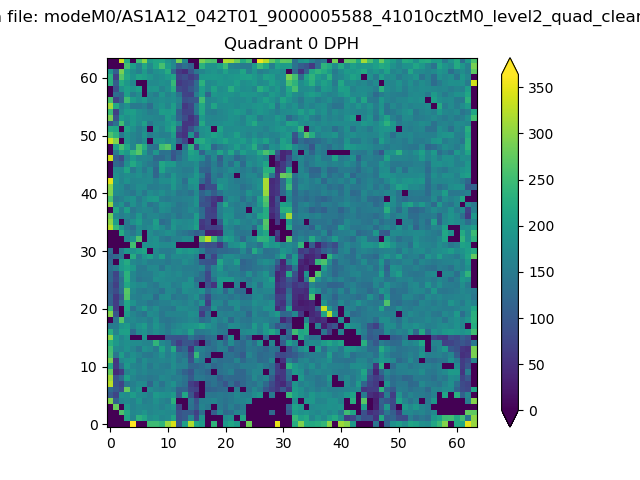 |
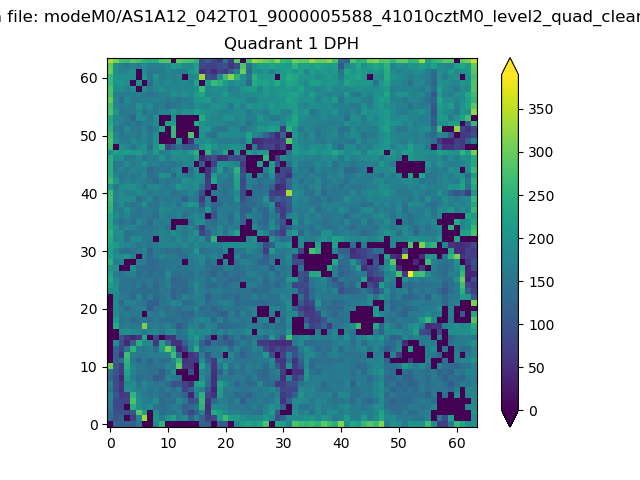 |
Quadrant B |
|---|---|---|---|
| Quadrant D | 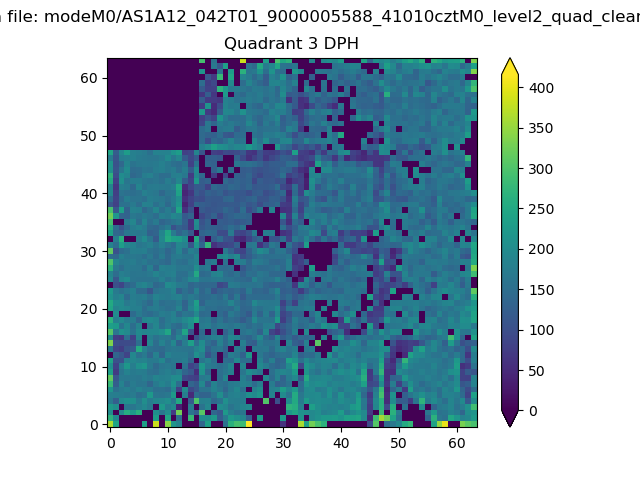 |
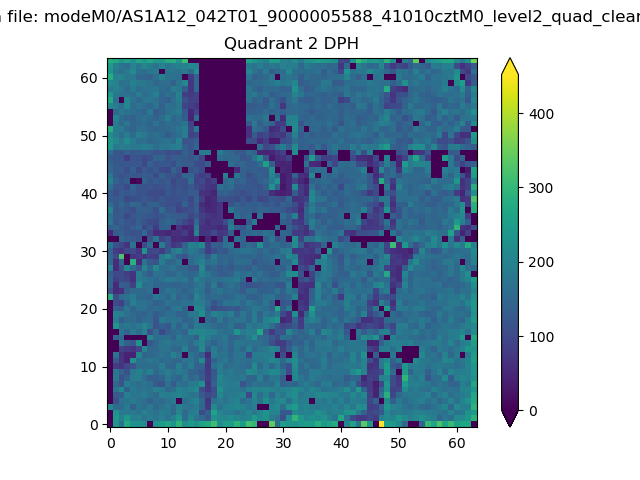 |
Quadrant C |
| Plot type | Count rate plots | Images |
|---|---|---|
| Comparison with Poisson distribution Blue bars denote a histogram of data divided into 1 sec bins. Red curve is a Poisson curve with rate = median count rate of data. |
 |
 |
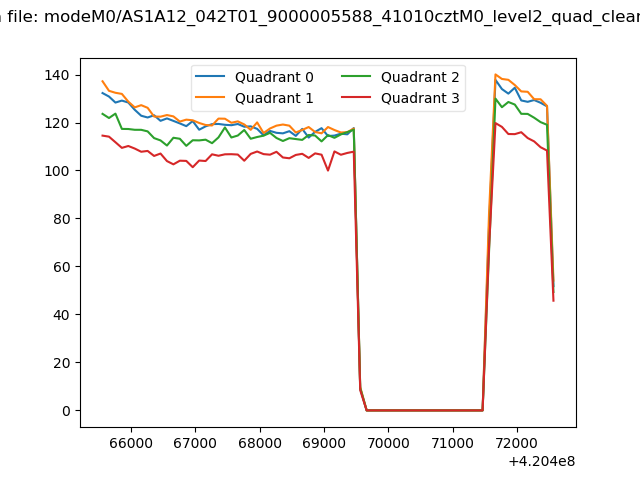
| Quadrant-wise count rates Data is divided into 100 sec bins |
 |
|
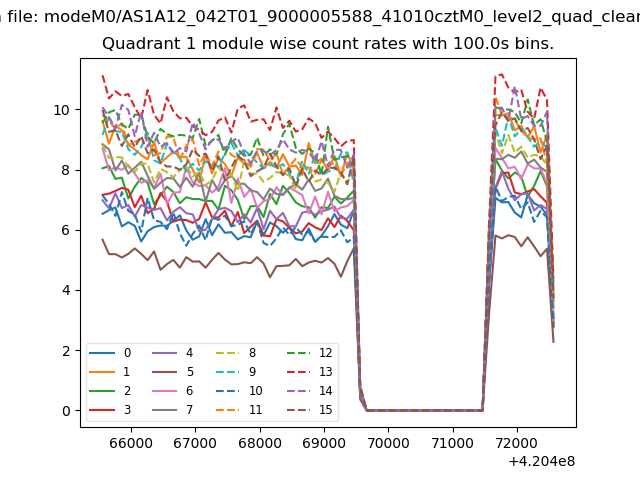
| Module-wise count rates for Quadrant A Data is divided into 100 sec bins |
 |
 |
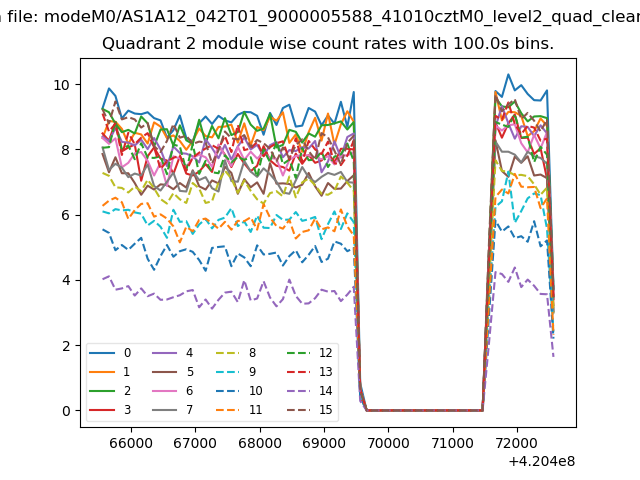
| Module-wise count rates for Quadrant B Data is divided into 100 sec bins |
 |
 |
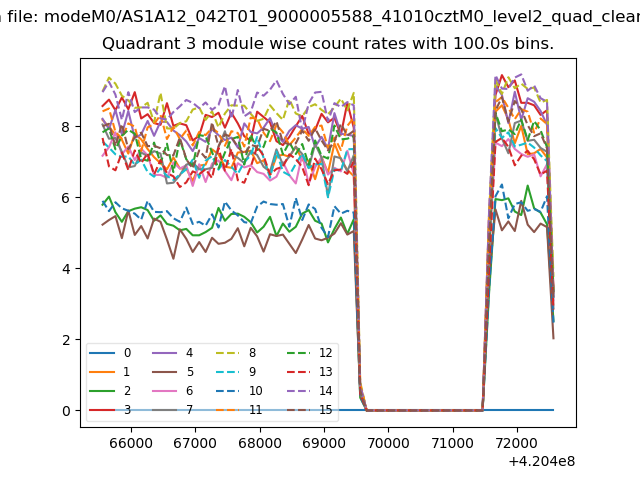
| Module-wise count rates for Quadrant C Data is divided into 100 sec bins |
 |
 |
| Module-wise count rates for Quadrant D Data is divided into 100 sec bins |
 |
 |
| Parameter | Plot |
|---|---|
| CZT HV Monitor | 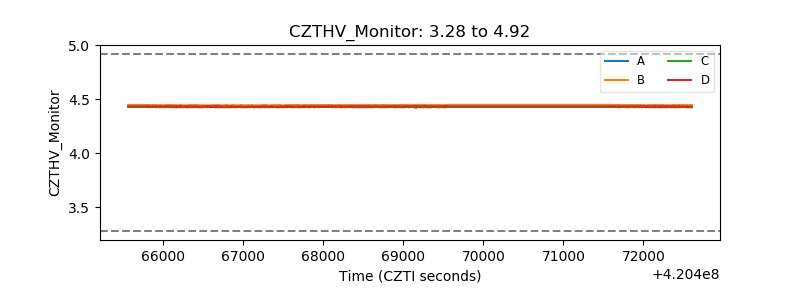 |
| D_VDD |  |
| Temperature 1 | 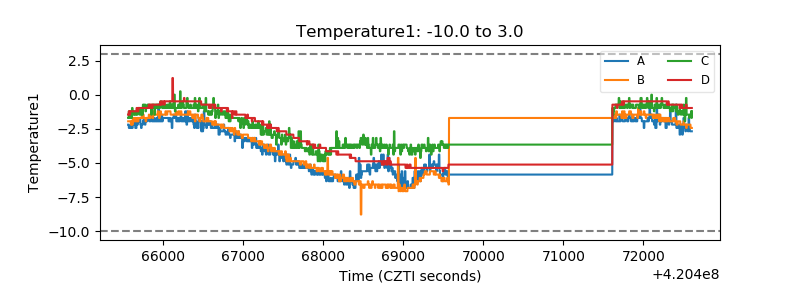 |
| Veto HV Monitor | 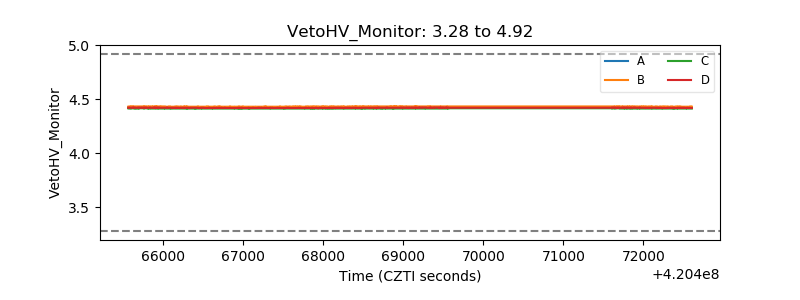 |
| Veto LLD | 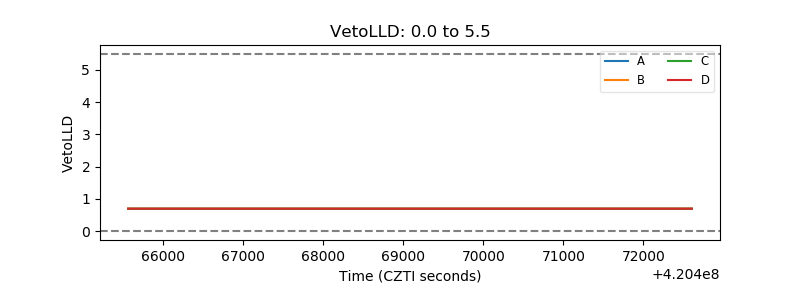 |
| Alpha Counter | 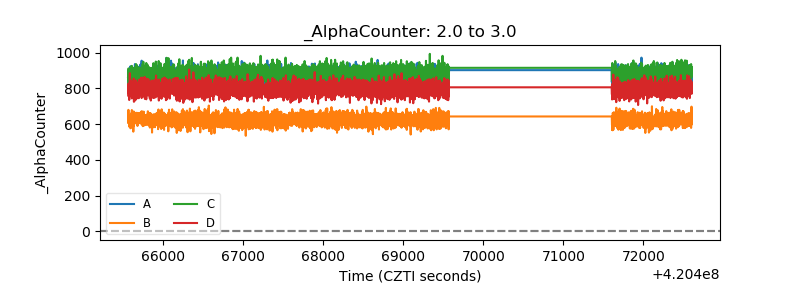 |
| _CPM_Rate | 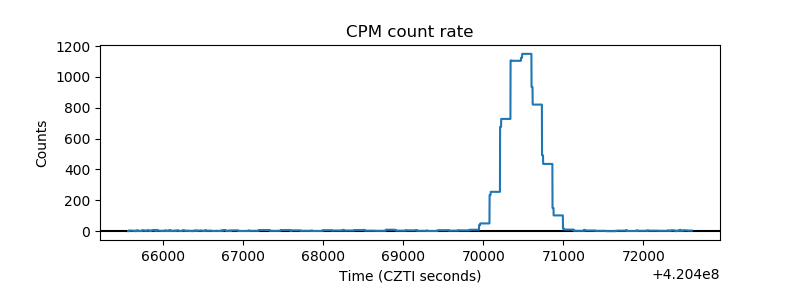 |
| CZT Counter | 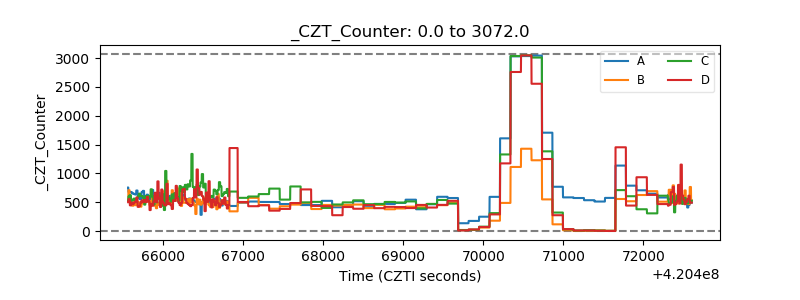 |
| +2.5 Volts monitor | 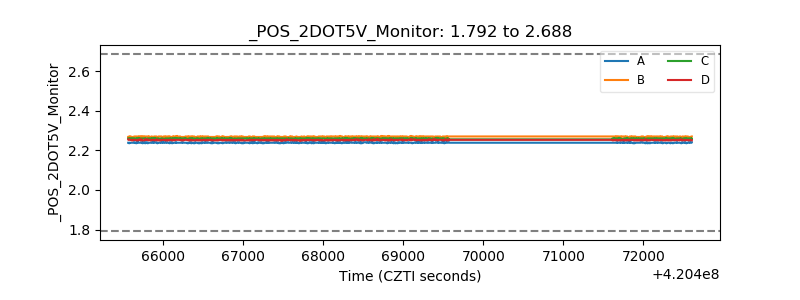 |
| +5 Volts monitor | 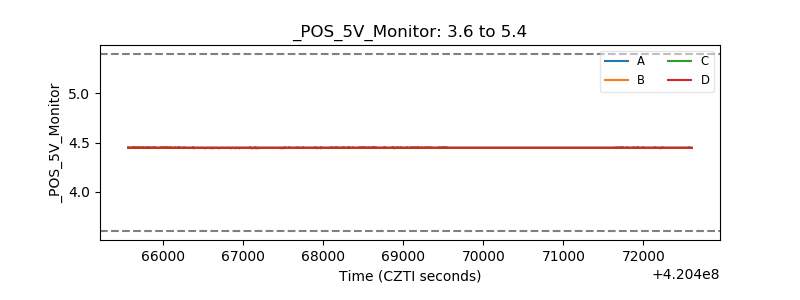 |
| _ROLL_ROT | 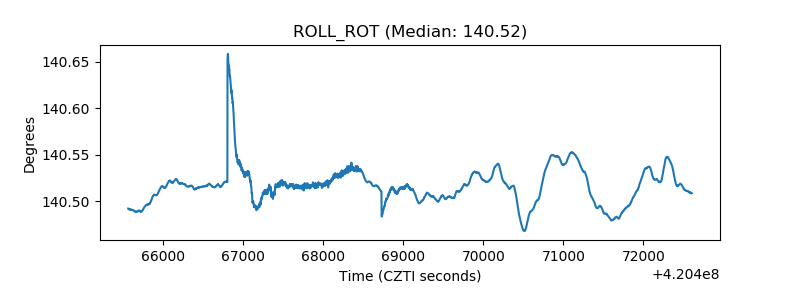 |
| _Roll_DEC | 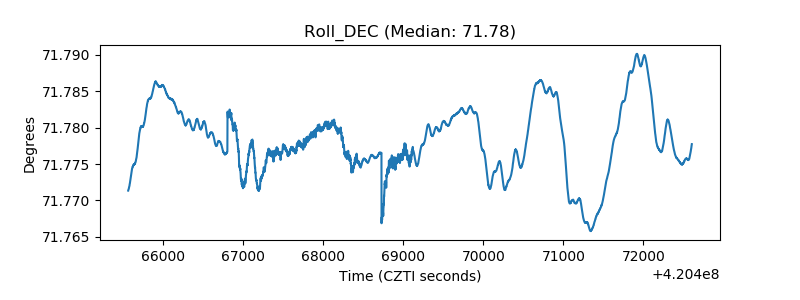 |
| _Roll_RA | 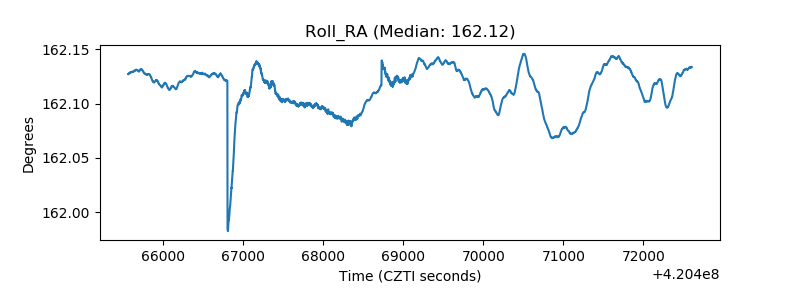 |
| Veto Counter |  |