| Param | Original file | Final file |
|---|---|---|
| Filename | modeM0/AS1A12_006T09_9000005592_41055cztM0_level2.fits | modeM0/AS1A12_006T09_9000005592_41055cztM0_level2_quad_clean.evt |
| Size (bytes) | 87,742,080 | 23,955,840 |
| Size | 83.7 MB | 22.8 MB |
| Events in quadrant A | 811,585 | 164,348 |
| Events in quadrant B | 717,087 | 167,095 |
| Events in quadrant C | 769,541 | 153,362 |
| Events in quadrant D | 844,994 | 142,790 |
| Mode M9 | |||
|---|---|---|---|
| Quadrant | BADHDUFLAG | Total packets | Discarded packets |
| A | 0 | 21 | 0 |
| B | 0 | 21 | 0 |
| C | 0 | 21 | 0 |
| D | 0 | 21 | 0 |
| Mode SS | |||
|---|---|---|---|
| Quadrant | BADHDUFLAG | Total packets | Discarded packets |
| A | 0 | 28 | 0 |
| B | 0 | 28 | 0 |
| C | 0 | 28 | 0 |
| D | 0 | 28 | 0 |
| Mode M0 | |||
|---|---|---|---|
| Quadrant | BADHDUFLAG | Total packets | Discarded packets |
| A | 0 | 3200 | 2 |
| B | 0 | 2926 | 1 |
| C | 0 | 3013 | 1 |
| D | 0 | 3346 | 1 |
| Quadrant | Total seconds | Saturated seconds | Saturation percentage |
|---|---|---|---|
| A | 1308 | 4 | 0.305810% |
| B | 1308 | 11 | 0.840979% |
| C | 1308 | 37 | 2.828746% |
| D | 1308 | 54 | 4.128440% |
Noise dominated data is calculated using 1-second bins in cleaned event files. If a bin has >2000 counts, and if more than 50% of those come from <1% of pixels, then it is considered to be noise-dominated and hence unusable.
| Quadrant | # 1 sec bins | Bins with >0 counts | Bins with >2000 counts | High rate bins dominated by noise | Noise dominated (total time) | Noise dominated (detector-on time) | Marked lightcurve |
|---|---|---|---|---|---|---|---|
| A | 3434 | 1309 | 2 | 2 | 0.06% | 0.15% | 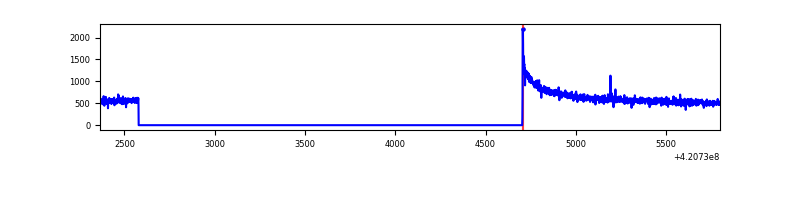 |
| B | 3434 | 1309 | 5 | 5 | 0.15% | 0.38% | 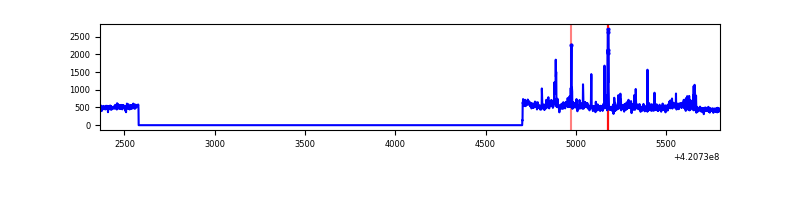 |
| C | 3434 | 1309 | 35 | 35 | 1.02% | 2.67% | 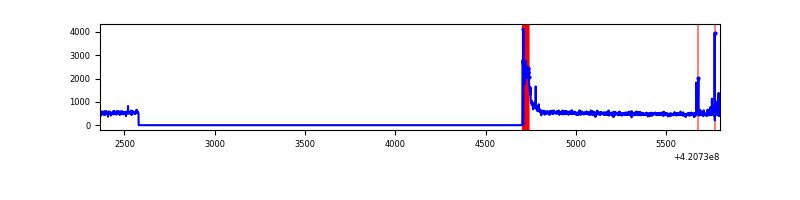 |
| D | 3434 | 1309 | 45 | 45 | 1.31% | 3.44% | 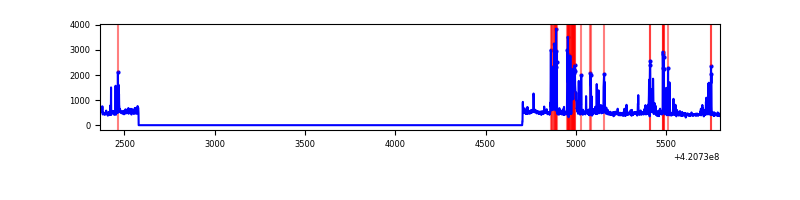 |
Top three noisy pixels from each quadrant. If the there are fewer than three noisy pixels in the level2.evt file, extra rows are filled as -1
| Pixel properties | Quadrant properties | ||||||
|---|---|---|---|---|---|---|---|
| Quadrant | DetID | PixID | Counts | Sigma | Mean | Median | Sigma |
| A | 10 | 83 | 187714 | 5521.41 | 160 | 157 | 34.0 |
| A | 13 | 254 | 2440 | 67.21 | 160 | 157 | 34.0 |
| A | 12 | 189 | 1917 | 51.81 | 160 | 157 | 34.0 |
| B | 0 | 186 | 34098 | 1065.15 | 157 | 153 | 31.9 |
| B | 0 | 190 | 32546 | 1016.45 | 157 | 153 | 31.9 |
| B | 0 | 189 | 9636 | 297.57 | 157 | 153 | 31.9 |
| C | 0 | 10 | 97658 | 2667.77 | 150 | 150 | 36.6 |
| C | 15 | 214 | 63014 | 1719.93 | 150 | 150 | 36.6 |
| C | 14 | 254 | 23733 | 645.22 | 150 | 150 | 36.6 |
| D | 13 | 249 | 190211 | 4868.88 | 152 | 147 | 39.0 |
| D | 12 | 233 | 29781 | 759.14 | 152 | 147 | 39.0 |
| D | 13 | 171 | 15143 | 384.15 | 152 | 147 | 39.0 |
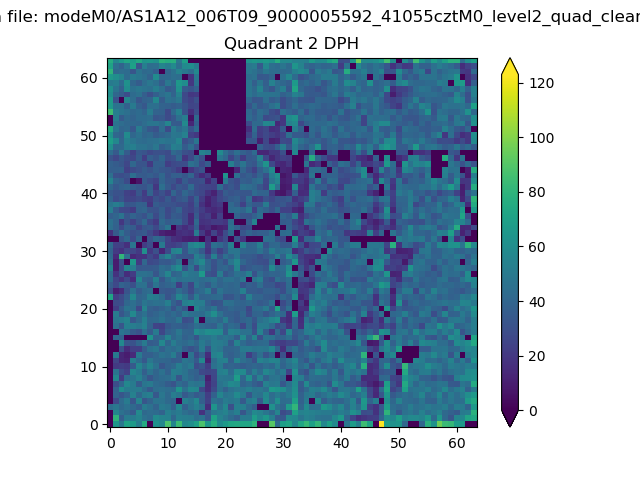
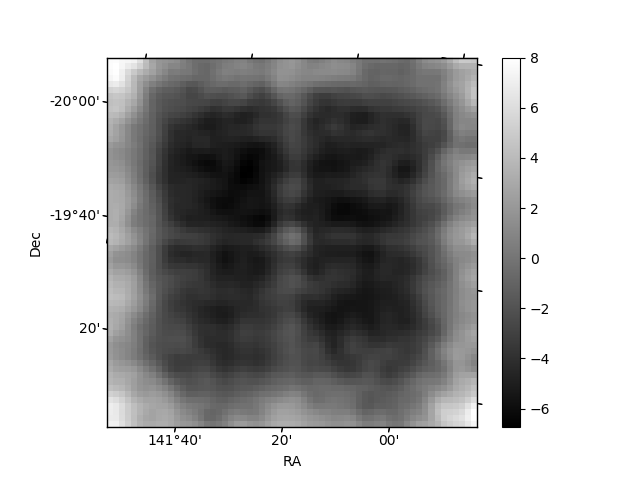
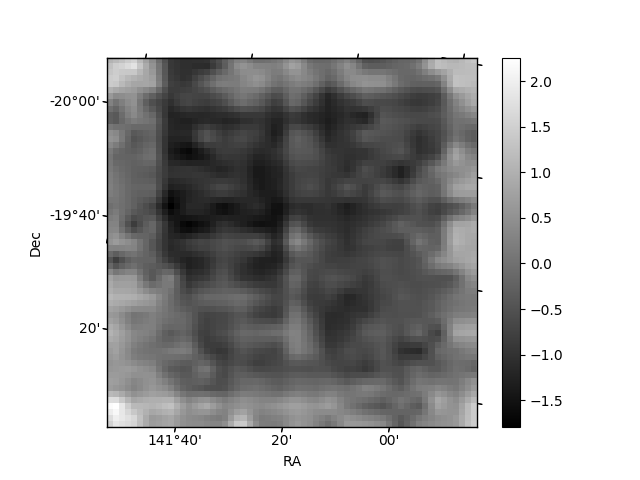
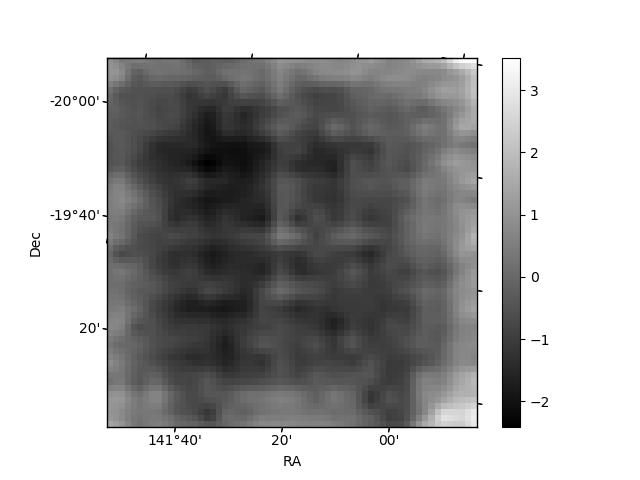
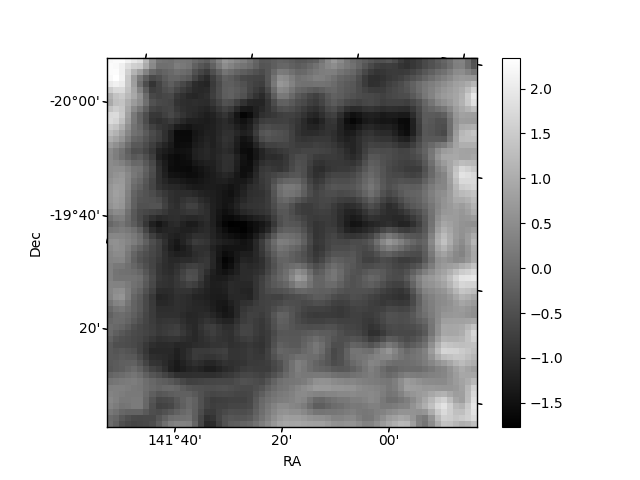
Histogram calculated using DETX and DETY for each event in the final _common_clean file
| Quadrant A | 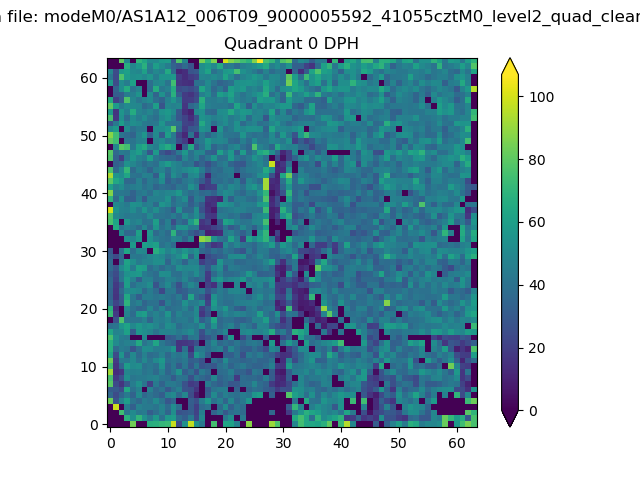 |
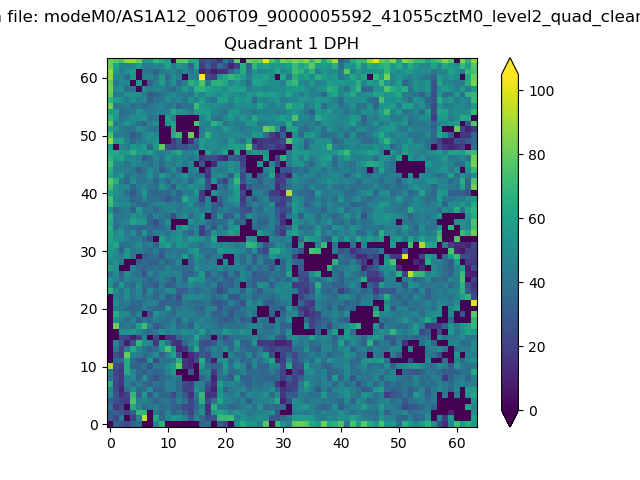 |
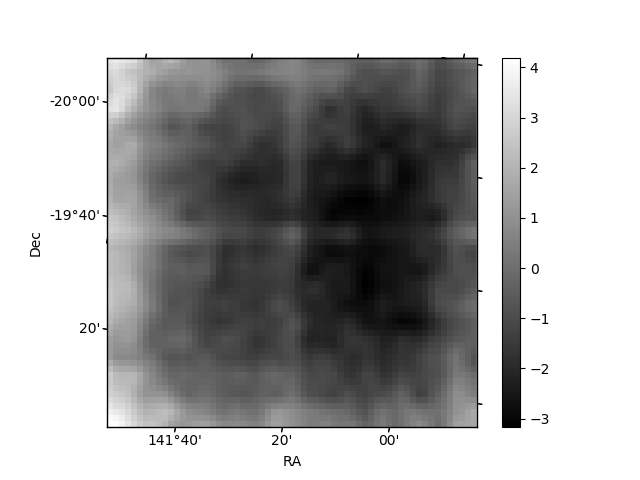
Quadrant B |
|---|---|---|---|
| Quadrant D | 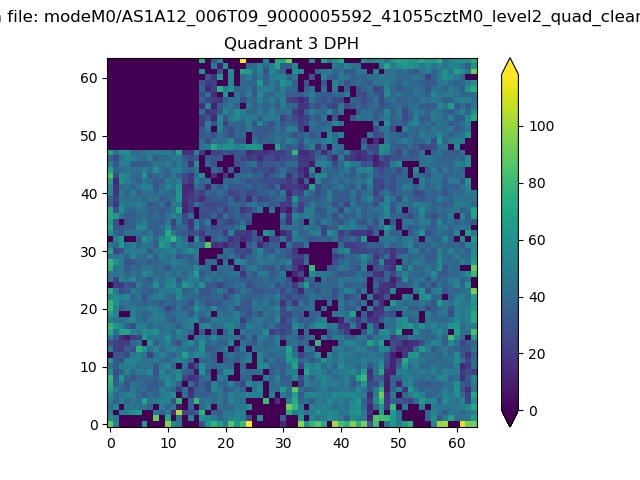 |
 |
Quadrant C |
| Plot type | Count rate plots | Images |
|---|---|---|
| Comparison with Poisson distribution Blue bars denote a histogram of data divided into 1 sec bins. Red curve is a Poisson curve with rate = median count rate of data. |
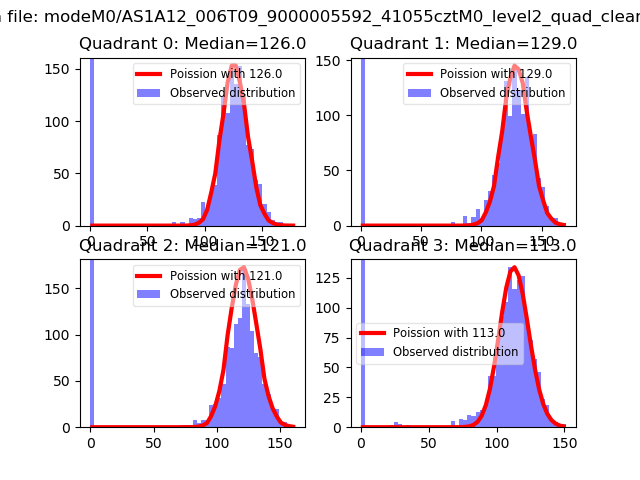 |
 |
| Quadrant-wise count rates Data is divided into 100 sec bins |
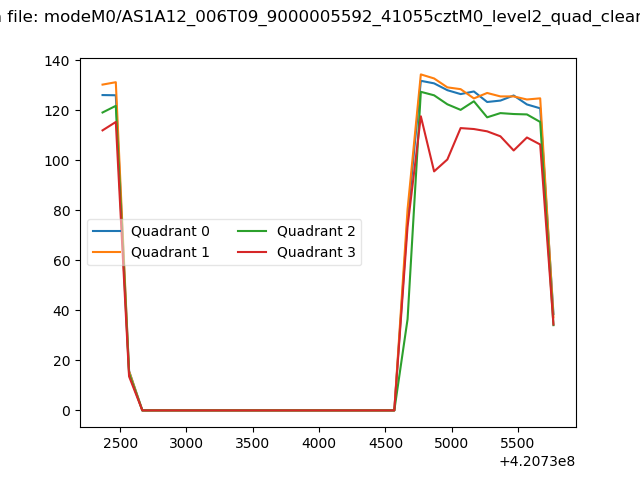 |
|
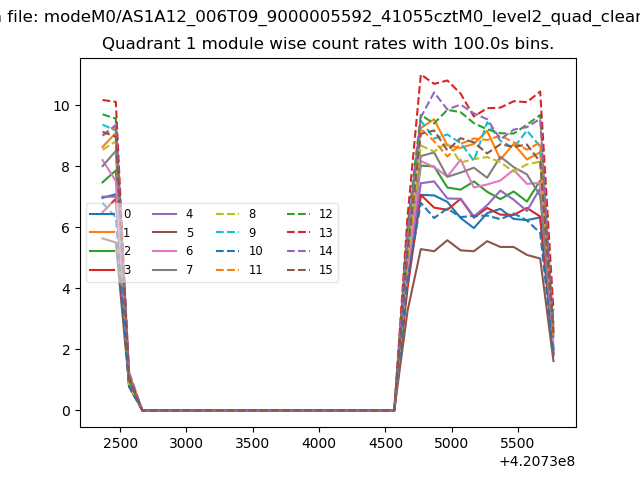
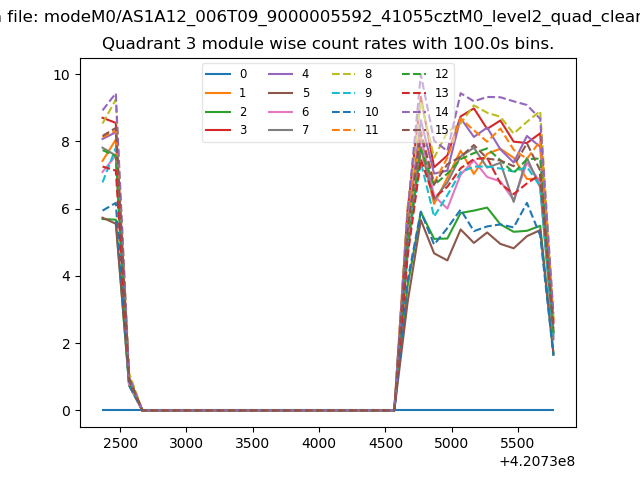
| Module-wise count rates for Quadrant A Data is divided into 100 sec bins |
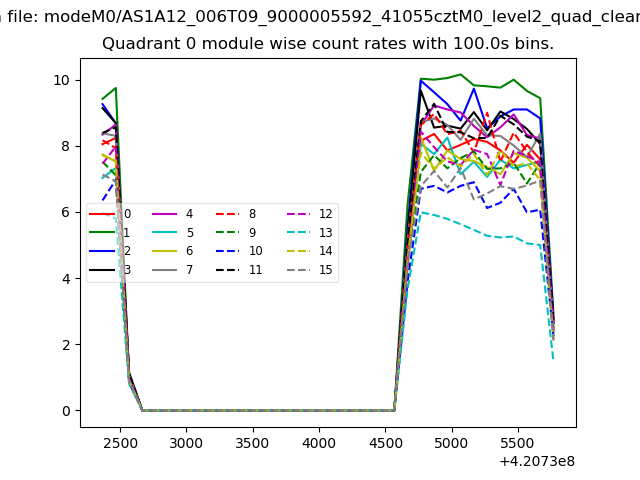 |
 |
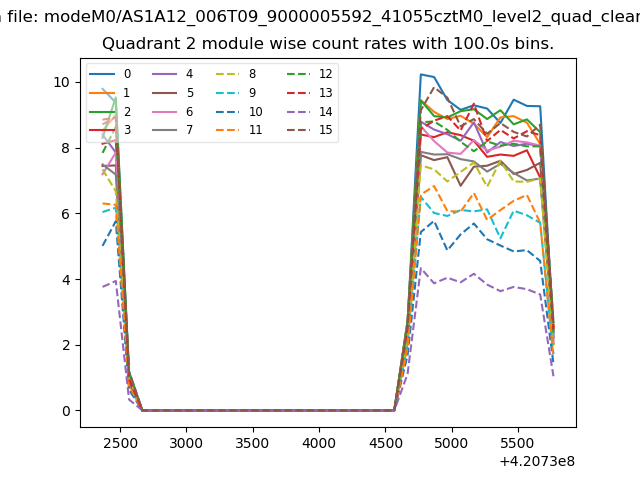
| Module-wise count rates for Quadrant B Data is divided into 100 sec bins |
 |
 |
| Module-wise count rates for Quadrant C Data is divided into 100 sec bins |
 |
 |
| Module-wise count rates for Quadrant D Data is divided into 100 sec bins |
 |
 |
| Parameter | Plot |
|---|---|
| CZT HV Monitor | 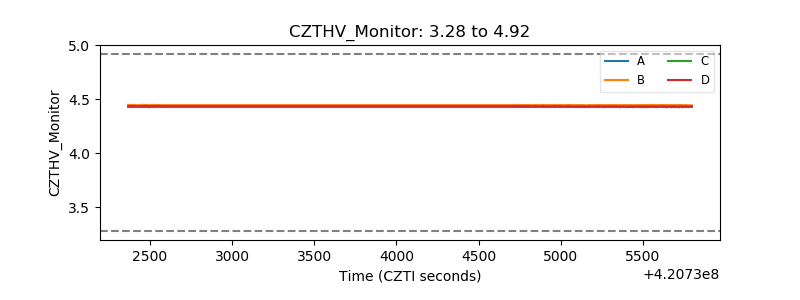 |
| D_VDD | 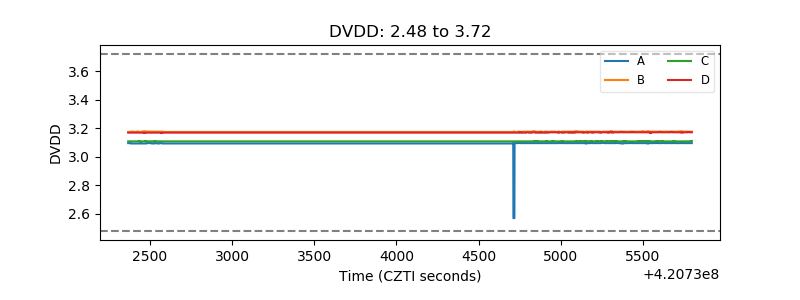 |
| Temperature 1 | 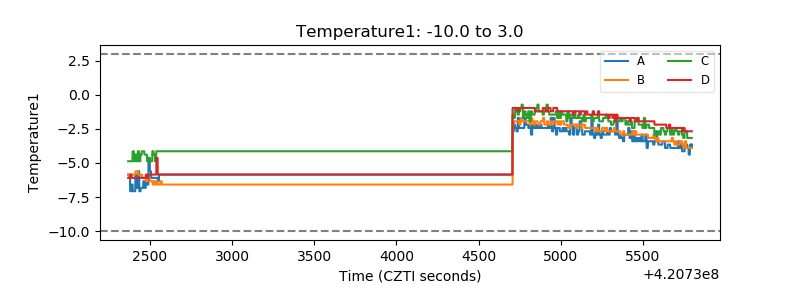 |
| Veto HV Monitor |  |
| Veto LLD | 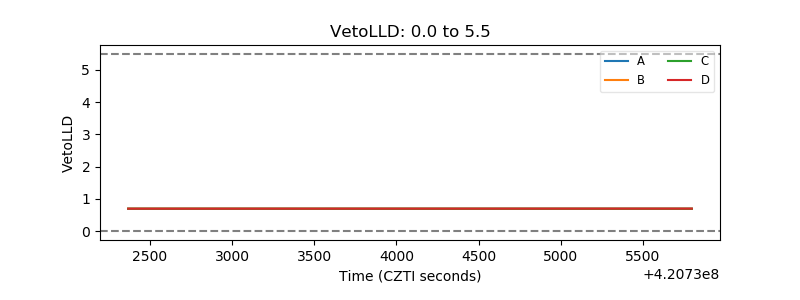 |
| Alpha Counter | 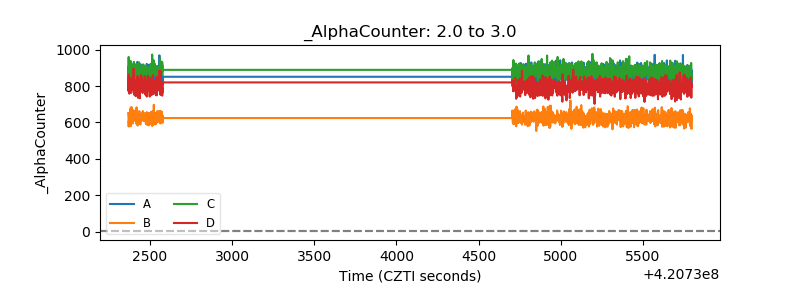 |
| _CPM_Rate | 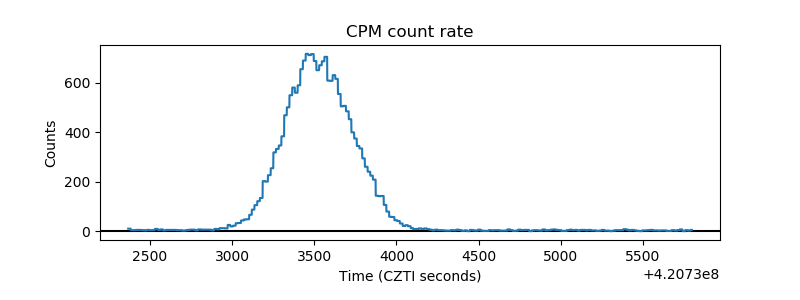 |
| CZT Counter | 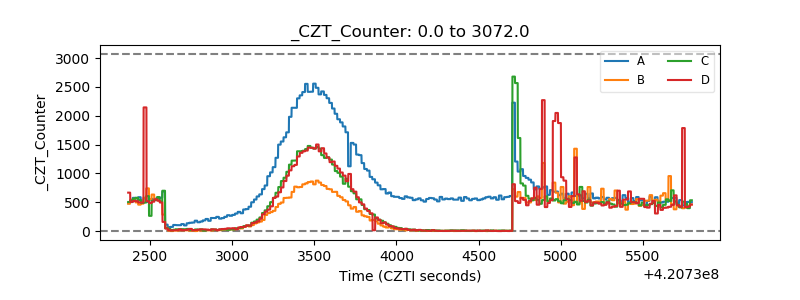 |
| +2.5 Volts monitor | 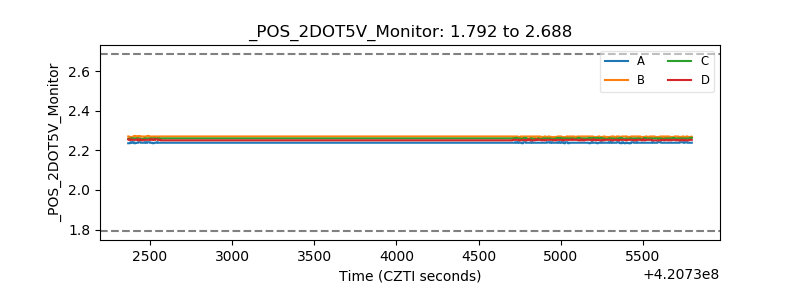 |
| +5 Volts monitor | 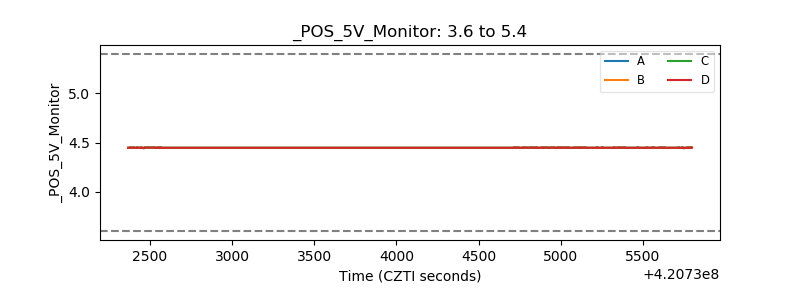 |
| _ROLL_ROT | 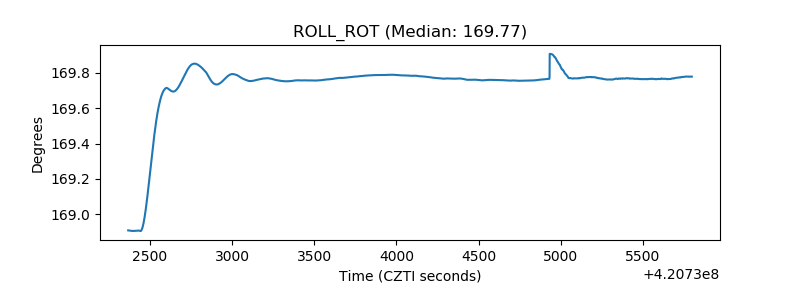 |
| _Roll_DEC | 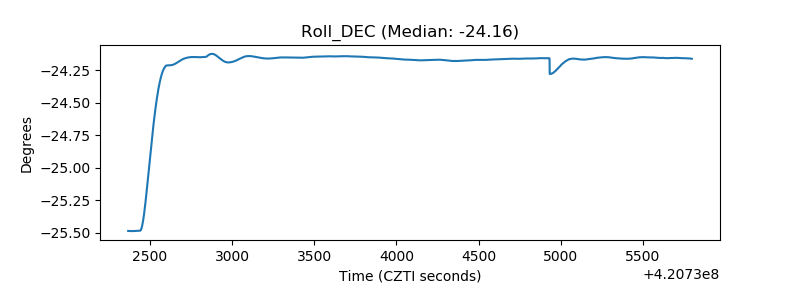 |
| _Roll_RA | 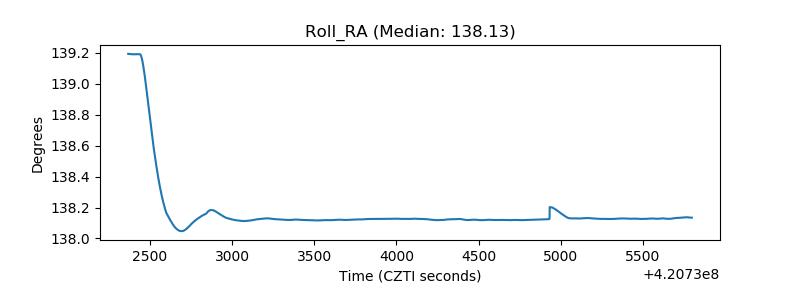 |
| Veto Counter | 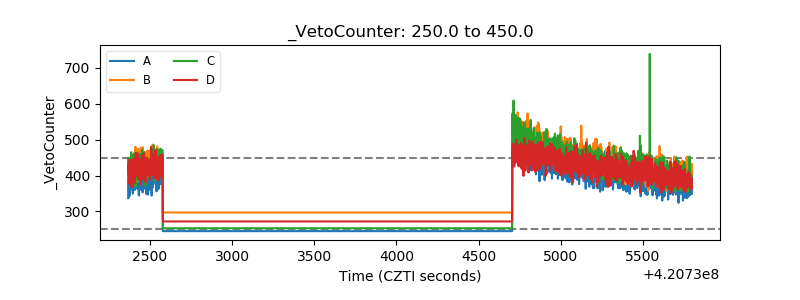 |