| Param | Original file | Final file |
|---|---|---|
| Filename | modeM0/AS1A12_006T09_9000005592_41056cztM0_level2.fits | modeM0/AS1A12_006T09_9000005592_41056cztM0_level2_quad_clean.evt |
| Size (bytes) | 304,611,840 | 88,079,040 |
| Size | 290.5 MB | 84.0 MB |
| Events in quadrant A | 2,797,070 | 601,640 |
| Events in quadrant B | 2,812,045 | 607,590 |
| Events in quadrant C | 2,689,151 | 567,536 |
| Events in quadrant D | 2,580,938 | 533,352 |
| Mode M9 | |||
|---|---|---|---|
| Quadrant | BADHDUFLAG | Total packets | Discarded packets |
| A | 0 | 21 | 0 |
| B | 0 | 21 | 0 |
| C | 0 | 21 | 0 |
| D | 0 | 22 | 0 |
| Mode SS | |||
|---|---|---|---|
| Quadrant | BADHDUFLAG | Total packets | Discarded packets |
| A | 0 | 106 | 0 |
| B | 0 | 106 | 0 |
| C | 0 | 106 | 0 |
| D | 0 | 106 | 0 |
| Mode M0 | |||
|---|---|---|---|
| Quadrant | BADHDUFLAG | Total packets | Discarded packets |
| A | 0 | 11395 | 3 |
| B | 0 | 11807 | 2 |
| C | 0 | 11166 | 2 |
| D | 0 | 11342 | 2 |
| Quadrant | Total seconds | Saturated seconds | Saturation percentage |
|---|---|---|---|
| A | 5087 | 13 | 0.255553% |
| B | 5087 | 91 | 1.788874% |
| C | 5087 | 86 | 1.690584% |
| D | 5087 | 78 | 1.533320% |
Noise dominated data is calculated using 1-second bins in cleaned event files. If a bin has >2000 counts, and if more than 50% of those come from <1% of pixels, then it is considered to be noise-dominated and hence unusable.
| Quadrant | # 1 sec bins | Bins with >0 counts | Bins with >2000 counts | High rate bins dominated by noise | Noise dominated (total time) | Noise dominated (detector-on time) | Marked lightcurve |
|---|---|---|---|---|---|---|---|
| A | 7208 | 5088 | 4 | 4 | 0.06% | 0.08% | 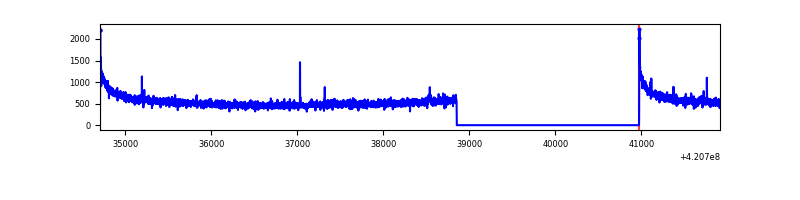 |
| B | 7208 | 5088 | 72 | 72 | 1.00% | 1.42% | 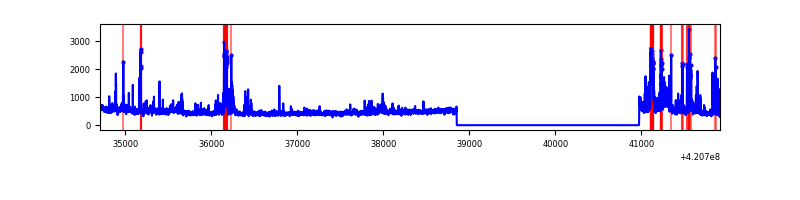 |
| C | 7208 | 5088 | 80 | 80 | 1.11% | 1.57% | 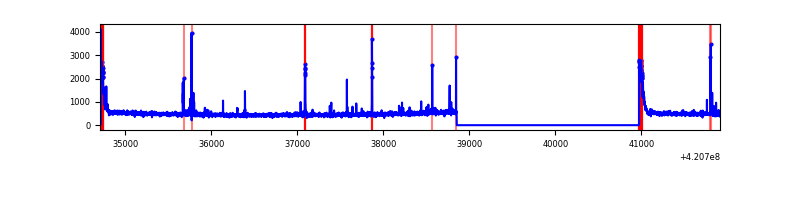 |
| D | 7208 | 5088 | 60 | 60 | 0.83% | 1.18% | 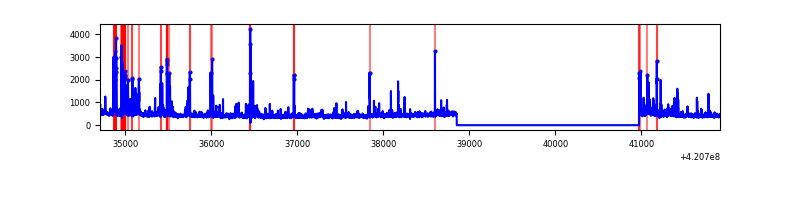 |
Top three noisy pixels from each quadrant. If the there are fewer than three noisy pixels in the level2.evt file, extra rows are filled as -1
| Pixel properties | Quadrant properties | ||||||
|---|---|---|---|---|---|---|---|
| Quadrant | DetID | PixID | Counts | Sigma | Mean | Median | Sigma |
| A | 10 | 83 | 525483 | 4461.3 | 575 | 565 | 117.7 |
| A | 12 | 189 | 34639 | 289.6 | 575 | 565 | 117.7 |
| A | 13 | 254 | 9475 | 75.73 | 575 | 565 | 117.7 |
| B | 5 | 255 | 334904 | 3045.5 | 567 | 553 | 109.8 |
| B | 0 | 190 | 126228 | 1144.73 | 567 | 553 | 109.8 |
| B | 0 | 186 | 72944 | 659.38 | 567 | 553 | 109.8 |
| C | 15 | 214 | 231773 | 1806.94 | 546 | 549 | 128.0 |
| C | 0 | 10 | 200298 | 1560.97 | 546 | 549 | 128.0 |
| C | 14 | 254 | 110416 | 858.57 | 546 | 549 | 128.0 |
| D | 13 | 249 | 201309 | 1473.86 | 551 | 533 | 136.2 |
| D | 2 | 249 | 81400 | 593.63 | 551 | 533 | 136.2 |
| D | 12 | 233 | 69688 | 507.65 | 551 | 533 | 136.2 |
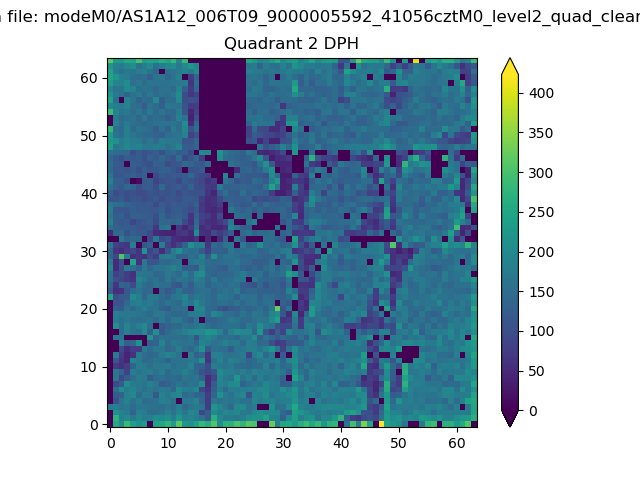
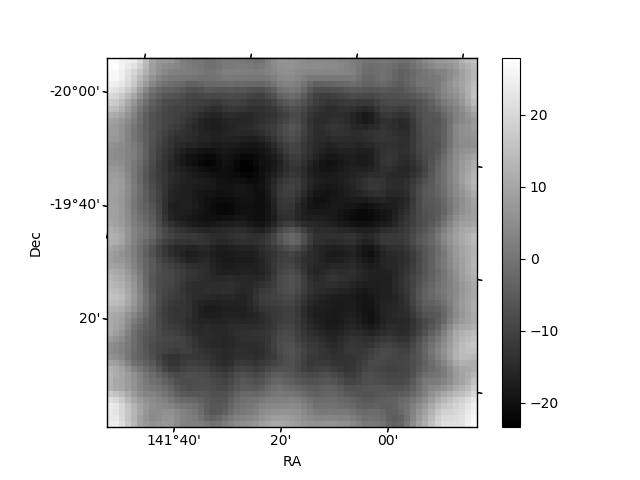
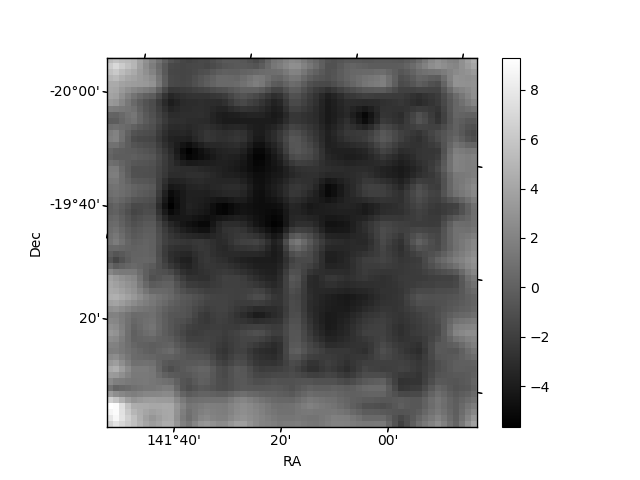
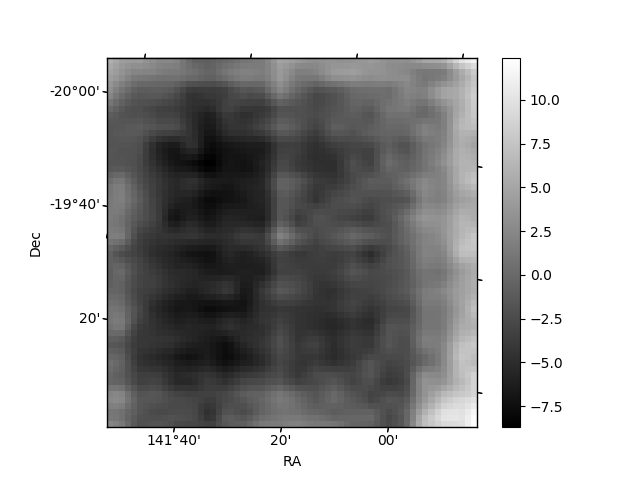
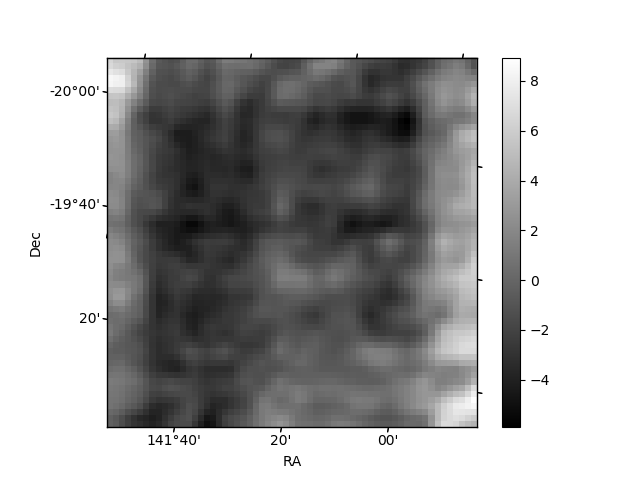
Histogram calculated using DETX and DETY for each event in the final _common_clean file
| Quadrant A | 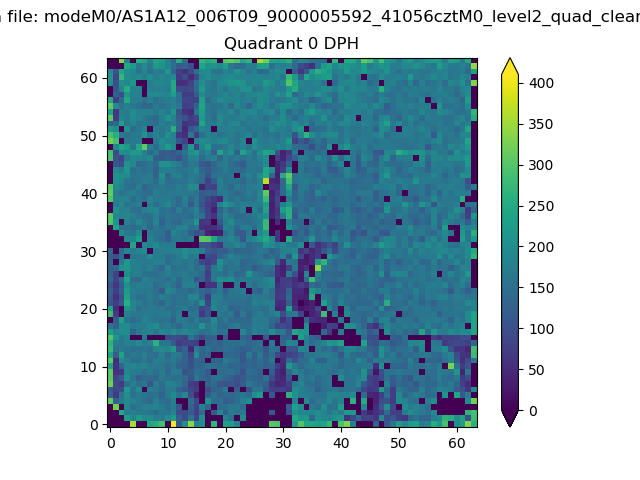 |
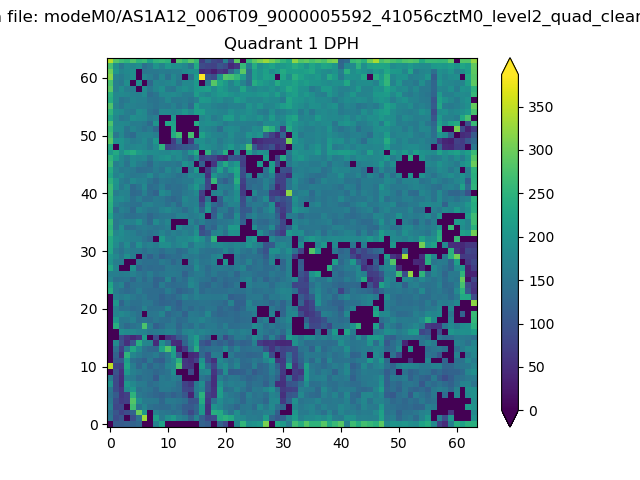 |
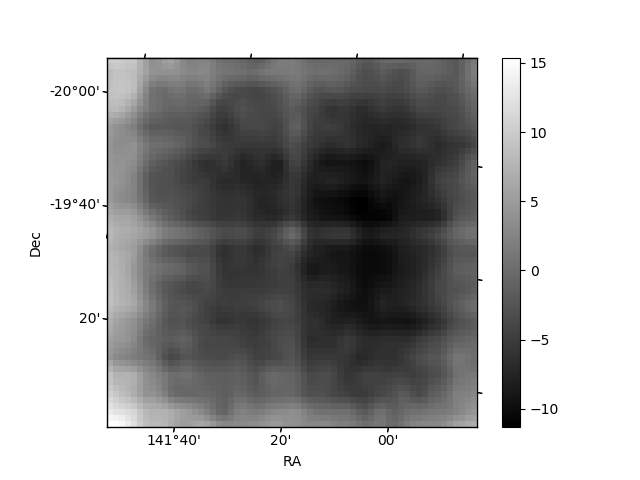
Quadrant B |
|---|---|---|---|
| Quadrant D | 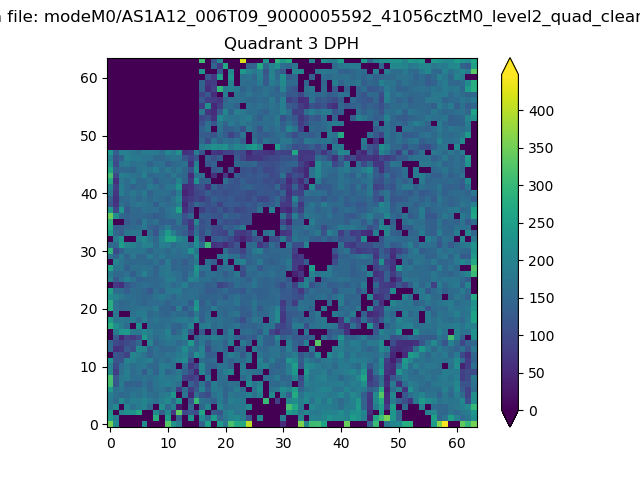 |
 |
Quadrant C |
| Plot type | Count rate plots | Images |
|---|---|---|
| Comparison with Poisson distribution Blue bars denote a histogram of data divided into 1 sec bins. Red curve is a Poisson curve with rate = median count rate of data. |
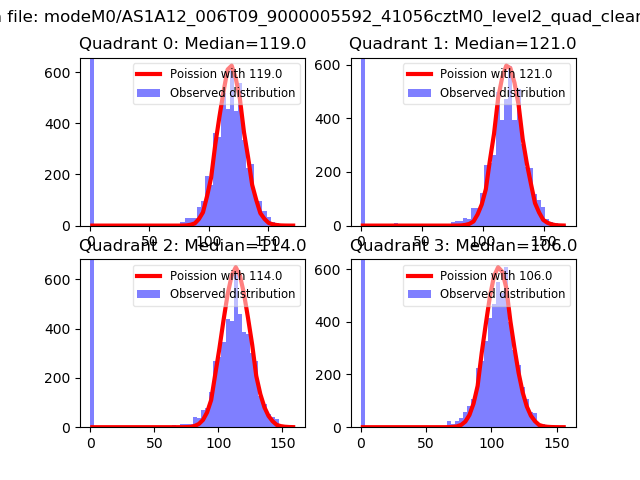 |
 |
| Quadrant-wise count rates Data is divided into 100 sec bins |
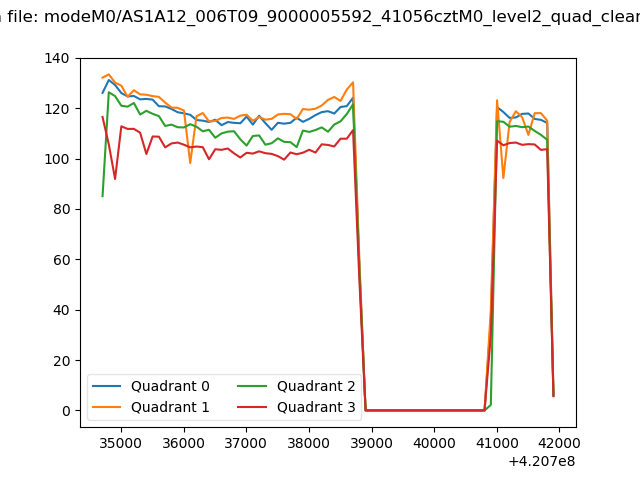 |
|
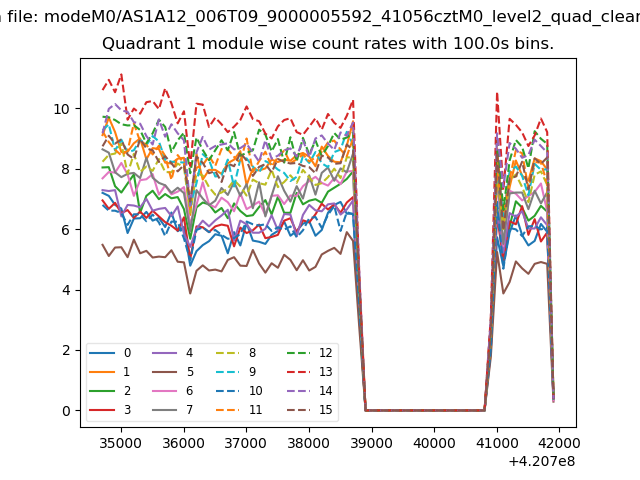
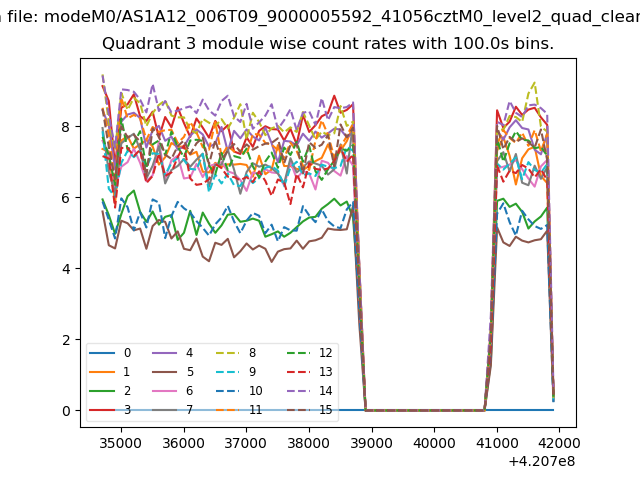
| Module-wise count rates for Quadrant A Data is divided into 100 sec bins |
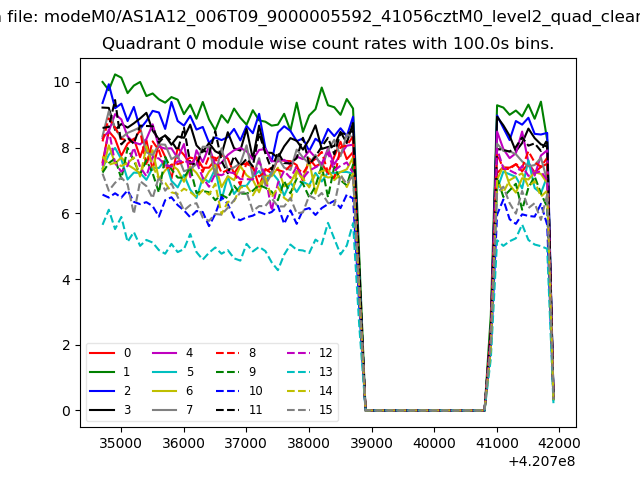 |
 |
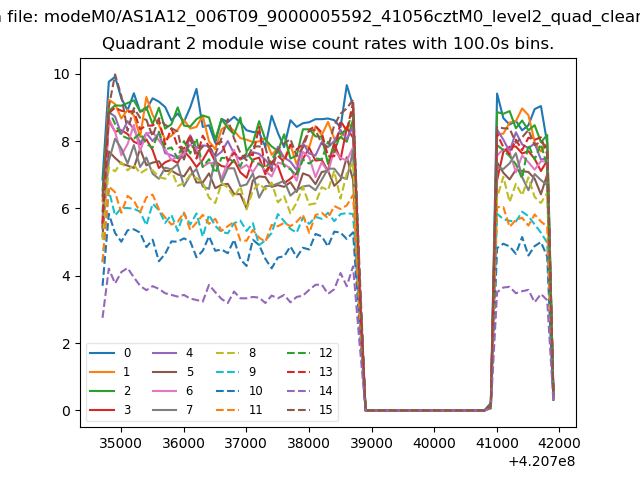
| Module-wise count rates for Quadrant B Data is divided into 100 sec bins |
 |
 |
| Module-wise count rates for Quadrant C Data is divided into 100 sec bins |
 |
 |
| Module-wise count rates for Quadrant D Data is divided into 100 sec bins |
 |
 |
| Parameter | Plot |
|---|---|
| CZT HV Monitor | 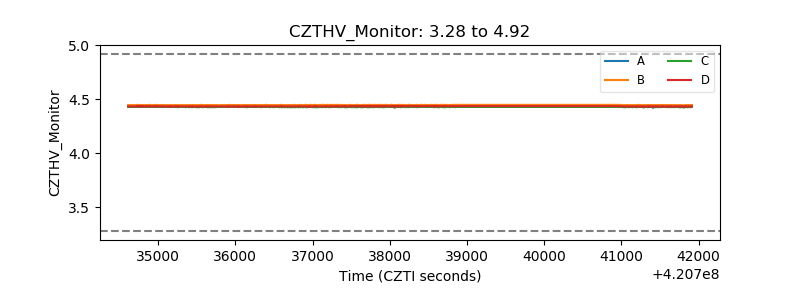 |
| D_VDD | 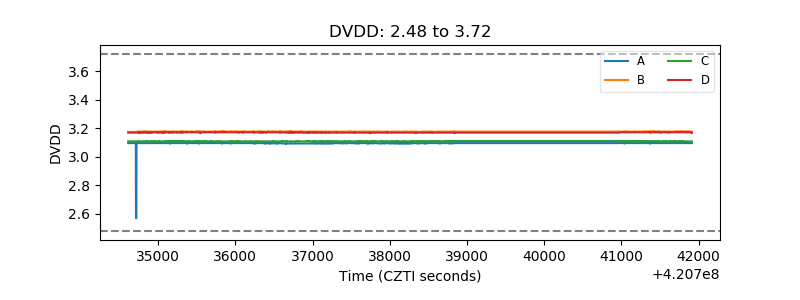 |
| Temperature 1 | 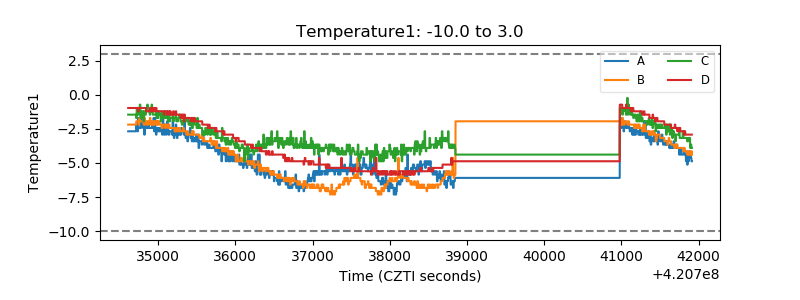 |
| Veto HV Monitor | 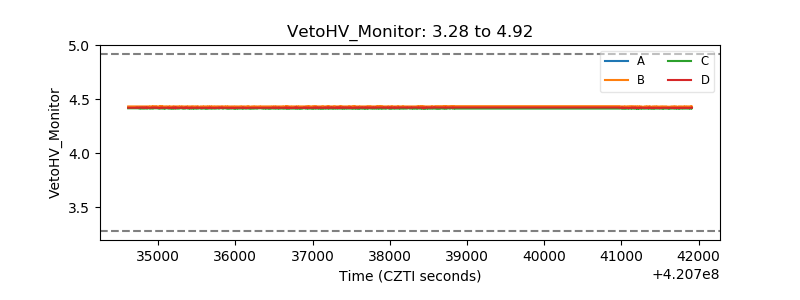 |
| Veto LLD | 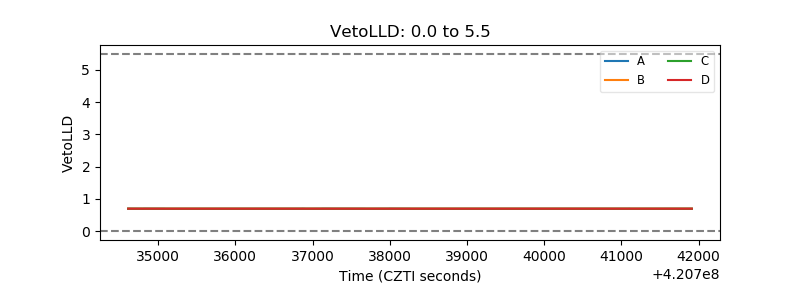 |
| Alpha Counter | 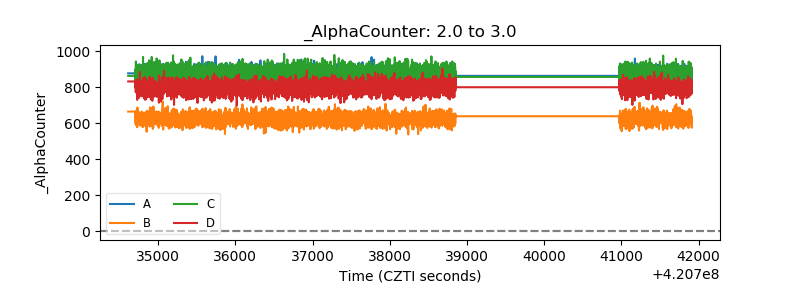 |
| _CPM_Rate | 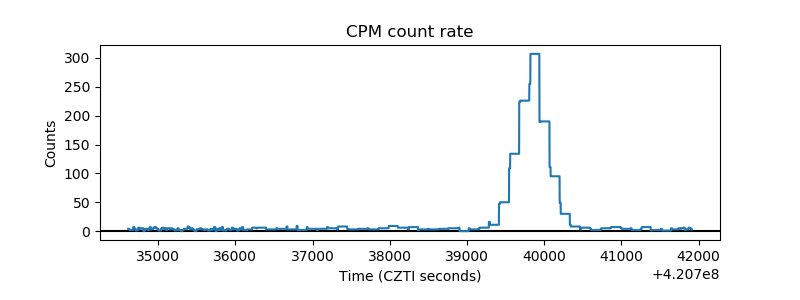 |
| CZT Counter | 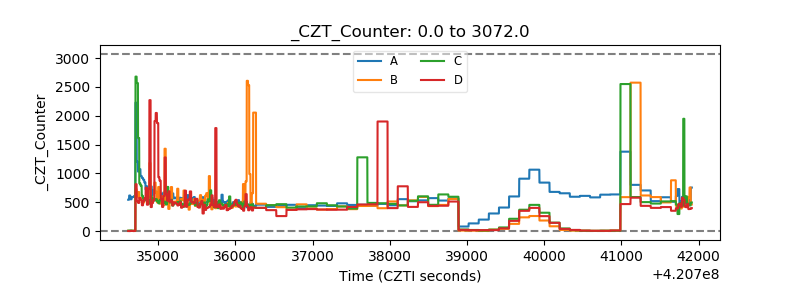 |
| +2.5 Volts monitor | 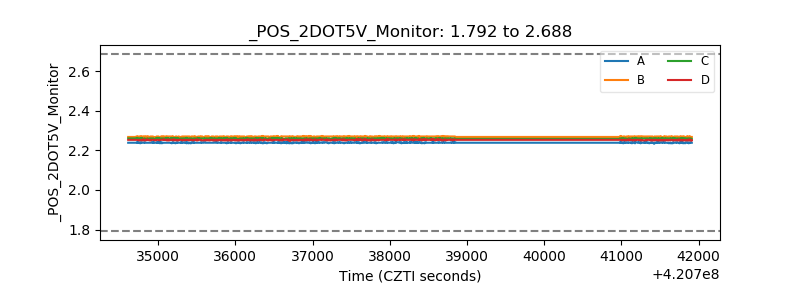 |
| +5 Volts monitor | 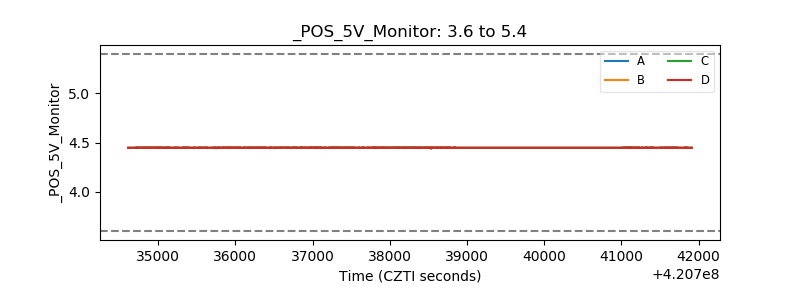 |
| _ROLL_ROT | 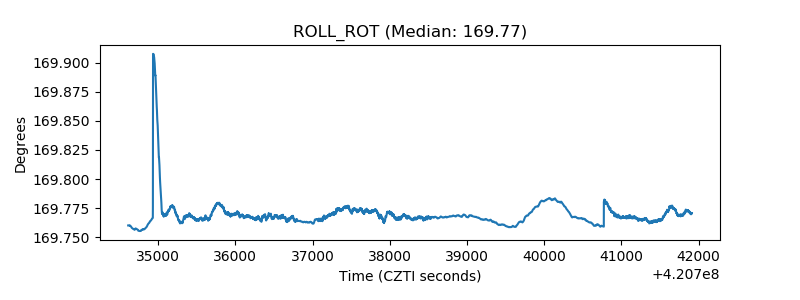 |
| _Roll_DEC | 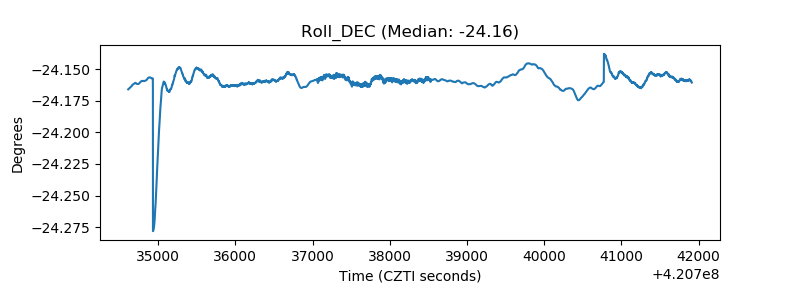 |
| _Roll_RA | 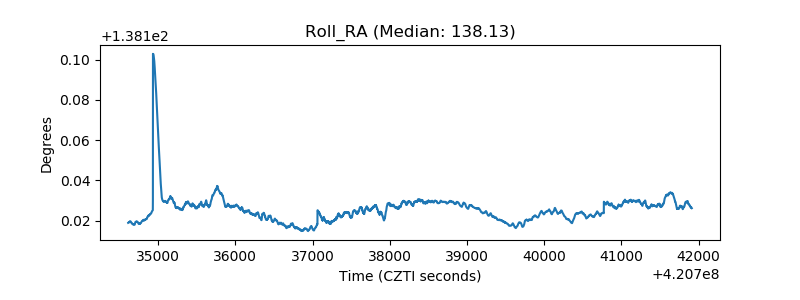 |
| Veto Counter | 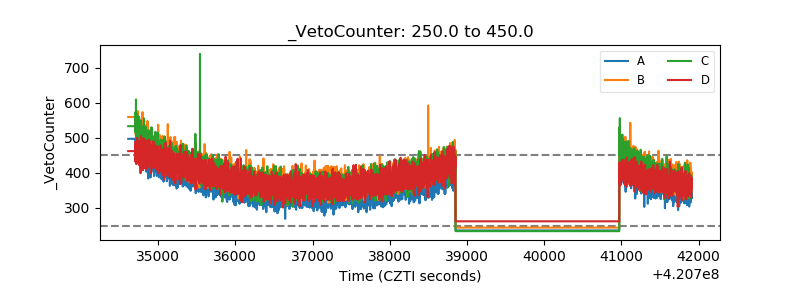 |