| Param | Original file | Final file |
|---|---|---|
| Filename | modeM0/AS1A12_006T09_9000005592_41058cztM0_level2.fits | modeM0/AS1A12_006T09_9000005592_41058cztM0_level2_quad_clean.evt |
| Size (bytes) | 314,305,920 | 88,387,200 |
| Size | 299.7 MB | 84.3 MB |
| Events in quadrant A | 2,832,014 | 598,227 |
| Events in quadrant B | 2,746,821 | 604,862 |
| Events in quadrant C | 2,771,552 | 568,152 |
| Events in quadrant D | 2,864,427 | 528,540 |
| Mode M9 | |||
|---|---|---|---|
| Quadrant | BADHDUFLAG | Total packets | Discarded packets |
| A | 0 | 32 | 0 |
| B | 0 | 32 | 0 |
| C | 0 | 32 | 0 |
| D | 0 | 33 | 0 |
| Mode SS | |||
|---|---|---|---|
| Quadrant | BADHDUFLAG | Total packets | Discarded packets |
| A | 0 | 108 | 0 |
| B | 0 | 108 | 0 |
| C | 0 | 108 | 0 |
| D | 0 | 108 | 0 |
| Mode M0 | |||
|---|---|---|---|
| Quadrant | BADHDUFLAG | Total packets | Discarded packets |
| A | 0 | 11688 | 3 |
| B | 0 | 11843 | 2 |
| C | 0 | 11650 | 2 |
| D | 0 | 12441 | 2 |
| Quadrant | Total seconds | Saturated seconds | Saturation percentage |
|---|---|---|---|
| A | 5384 | 10 | 0.185736% |
| B | 5384 | 68 | 1.263001% |
| C | 5384 | 63 | 1.170134% |
| D | 5384 | 106 | 1.968796% |
Noise dominated data is calculated using 1-second bins in cleaned event files. If a bin has >2000 counts, and if more than 50% of those come from <1% of pixels, then it is considered to be noise-dominated and hence unusable.
| Quadrant | # 1 sec bins | Bins with >0 counts | Bins with >2000 counts | High rate bins dominated by noise | Noise dominated (total time) | Noise dominated (detector-on time) | Marked lightcurve |
|---|---|---|---|---|---|---|---|
| A | 7027 | 5385 | 6 | 6 | 0.09% | 0.11% | 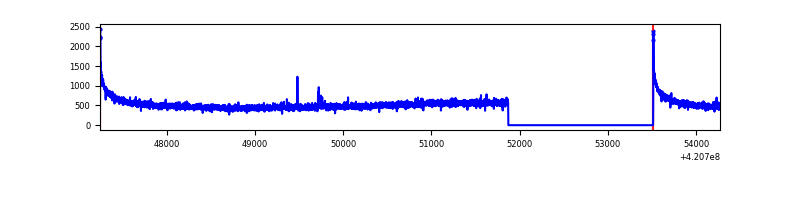 |
| B | 7027 | 5385 | 45 | 45 | 0.64% | 0.84% | 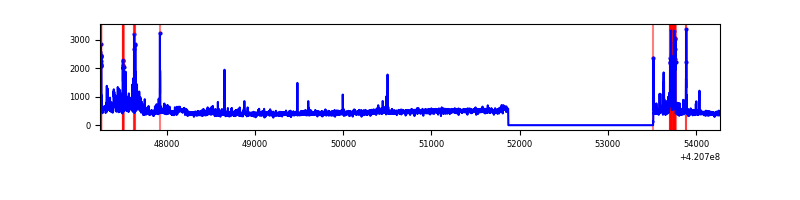 |
| C | 7027 | 5385 | 63 | 63 | 0.90% | 1.17% | 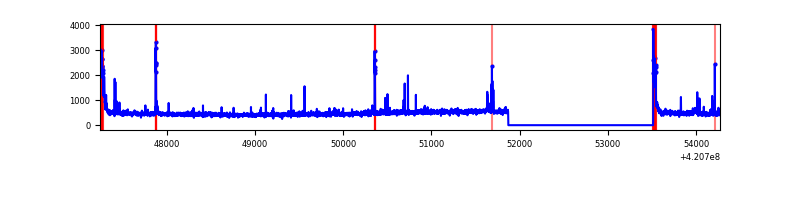 |
| D | 7027 | 5385 | 90 | 90 | 1.28% | 1.67% | 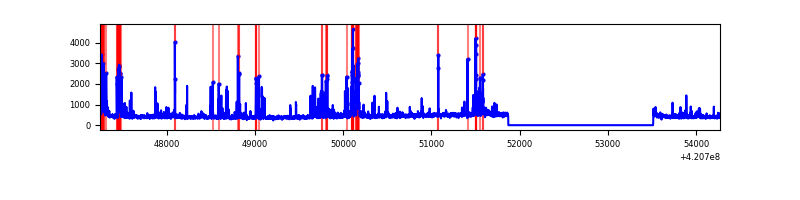 |
Top three noisy pixels from each quadrant. If the there are fewer than three noisy pixels in the level2.evt file, extra rows are filled as -1
| Pixel properties | Quadrant properties | ||||||
|---|---|---|---|---|---|---|---|
| Quadrant | DetID | PixID | Counts | Sigma | Mean | Median | Sigma |
| A | 10 | 83 | 515654 | 4195.62 | 592 | 580 | 122.8 |
| A | 13 | 254 | 9175 | 70.01 | 592 | 580 | 122.8 |
| A | 12 | 189 | 8496 | 64.48 | 592 | 580 | 122.8 |
| B | 0 | 190 | 109629 | 944.65 | 587 | 570 | 115.4 |
| B | 5 | 255 | 93476 | 804.74 | 587 | 570 | 115.4 |
| B | 8 | 128 | 82616 | 710.67 | 587 | 570 | 115.4 |
| C | 15 | 214 | 247764 | 1832.79 | 571 | 574 | 134.9 |
| C | 0 | 10 | 164739 | 1217.2 | 571 | 574 | 134.9 |
| C | 14 | 254 | 86000 | 633.39 | 571 | 574 | 134.9 |
| D | 13 | 249 | 238475 | 1679.22 | 571 | 554 | 141.7 |
| D | 2 | 249 | 181283 | 1275.56 | 571 | 554 | 141.7 |
| D | 12 | 233 | 106721 | 749.31 | 571 | 554 | 141.7 |
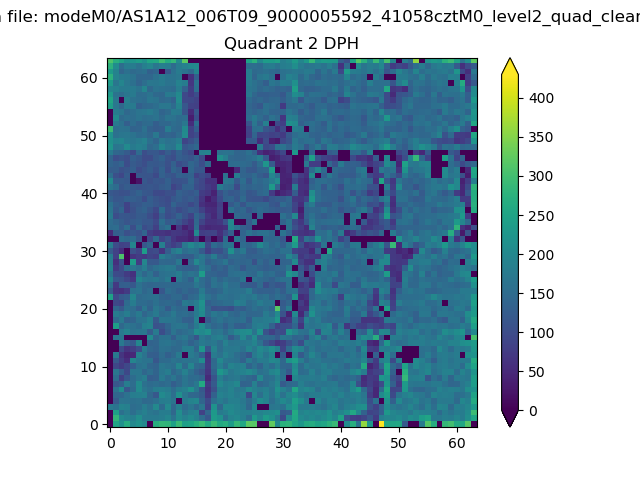
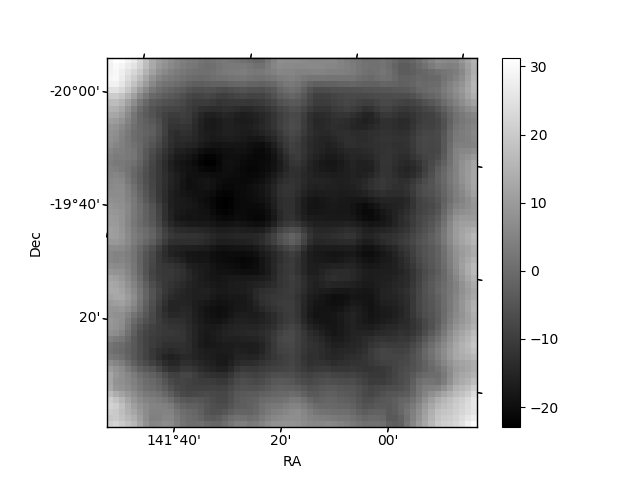
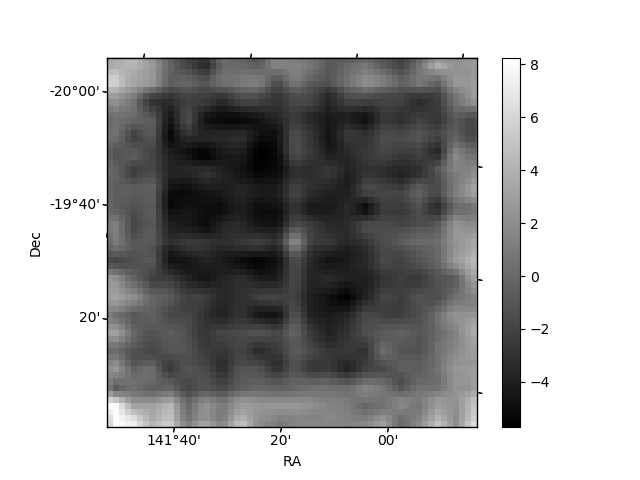
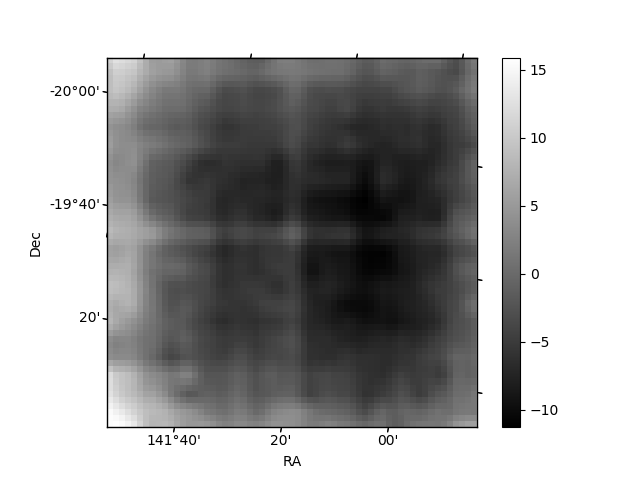
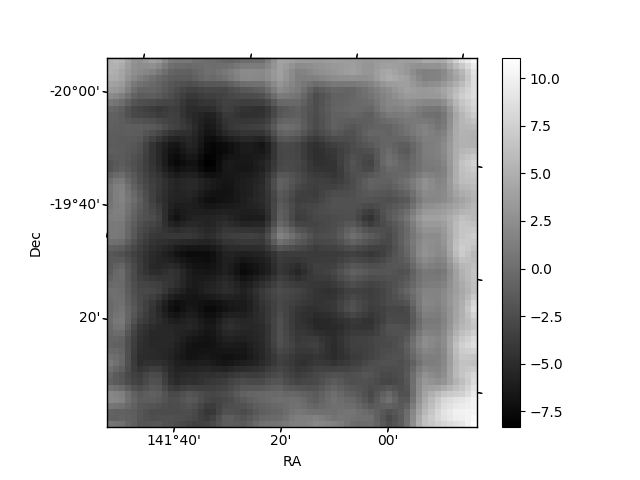
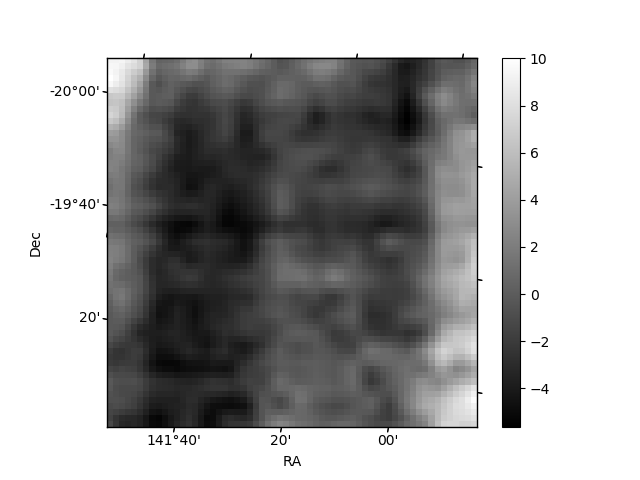
Histogram calculated using DETX and DETY for each event in the final _common_clean file
| Quadrant A | 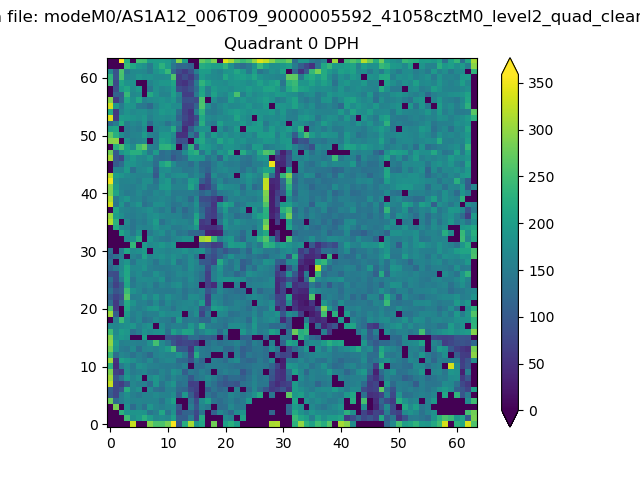 |
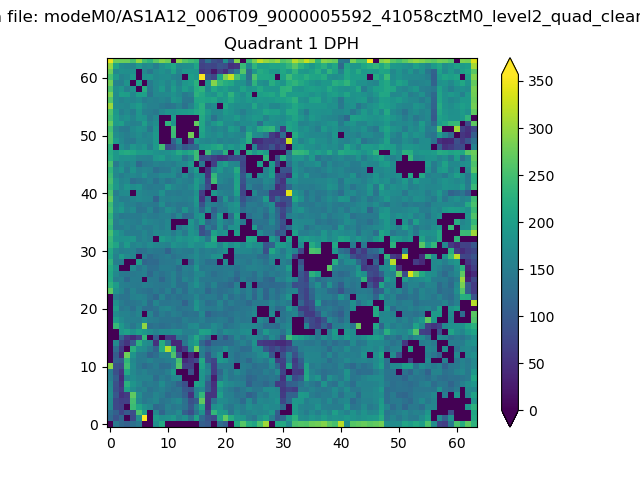 |
Quadrant B |
|---|---|---|---|
| Quadrant D | 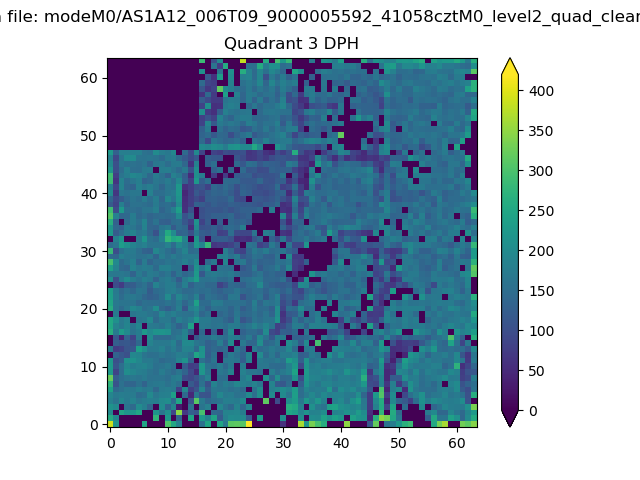 |
 |
Quadrant C |
| Plot type | Count rate plots | Images |
|---|---|---|
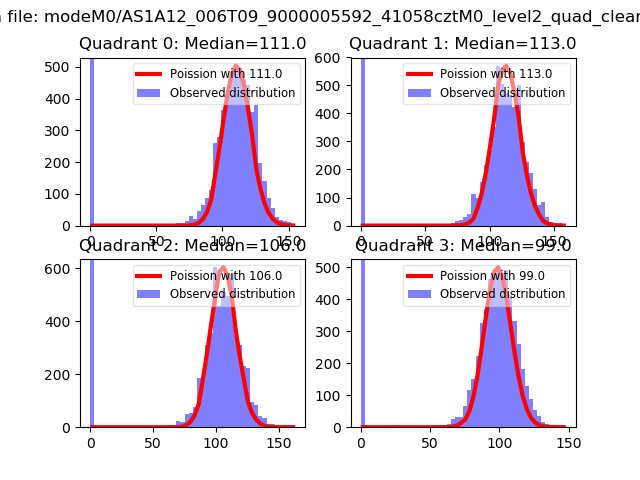
| Comparison with Poisson distribution Blue bars denote a histogram of data divided into 1 sec bins. Red curve is a Poisson curve with rate = median count rate of data. |
 |
 |
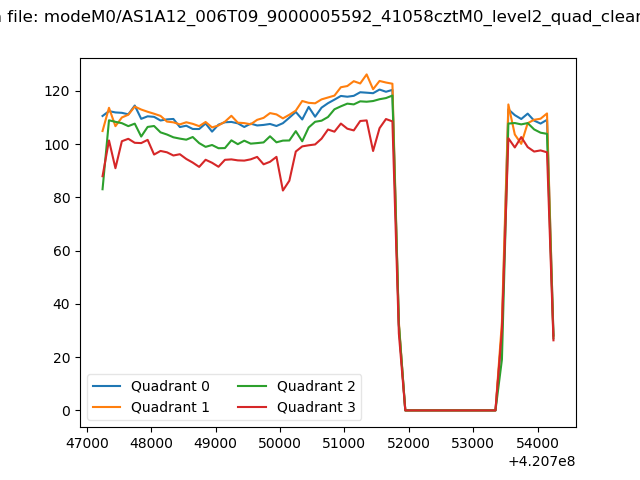
| Quadrant-wise count rates Data is divided into 100 sec bins |
 |
|
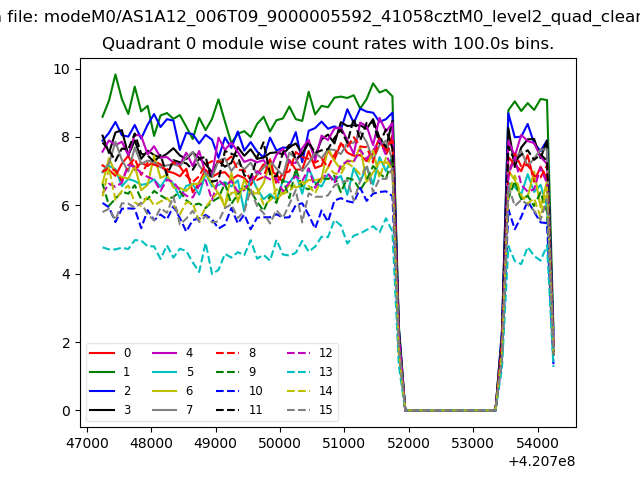
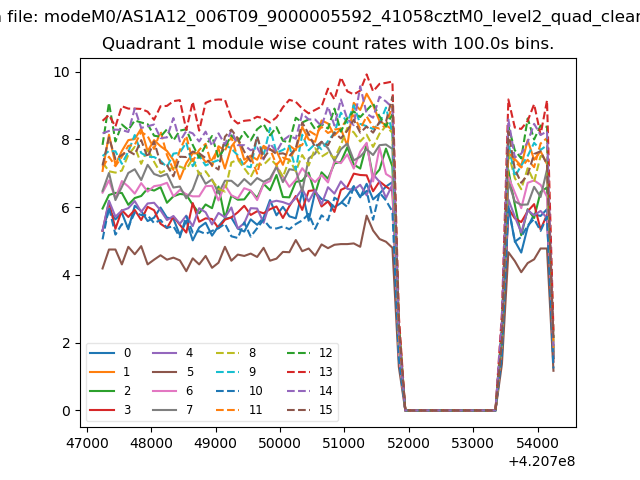
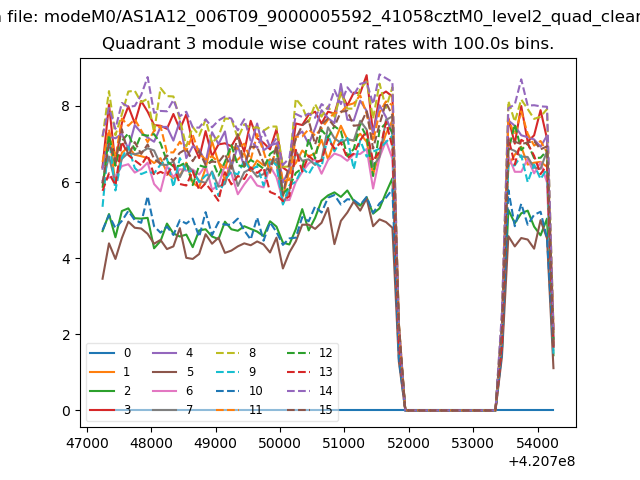
| Module-wise count rates for Quadrant A Data is divided into 100 sec bins |
 |
 |
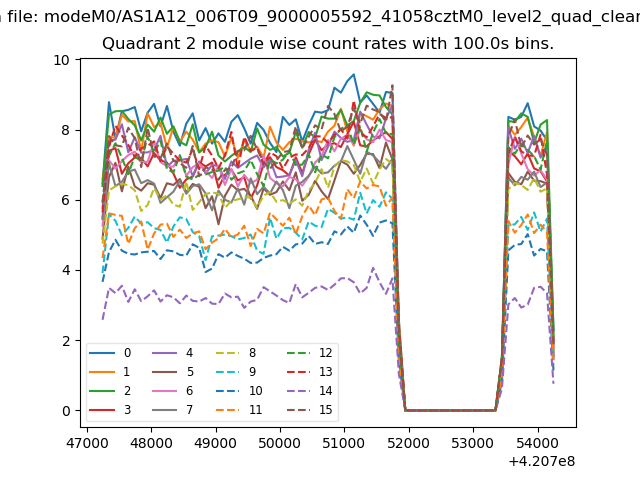
| Module-wise count rates for Quadrant B Data is divided into 100 sec bins |
 |
 |
| Module-wise count rates for Quadrant C Data is divided into 100 sec bins |
 |
 |
| Module-wise count rates for Quadrant D Data is divided into 100 sec bins |
 |
 |
| Parameter | Plot |
|---|---|
| CZT HV Monitor |  |
| D_VDD | 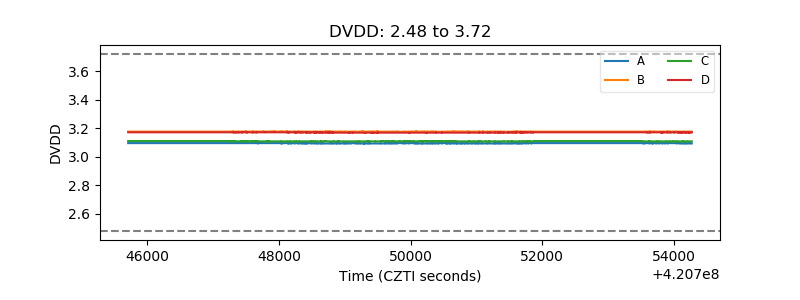 |
| Temperature 1 | 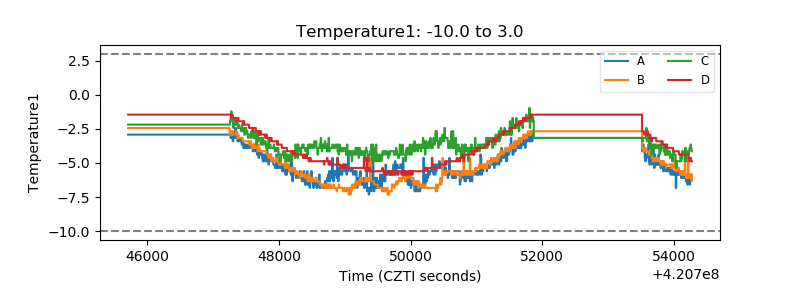 |
| Veto HV Monitor | 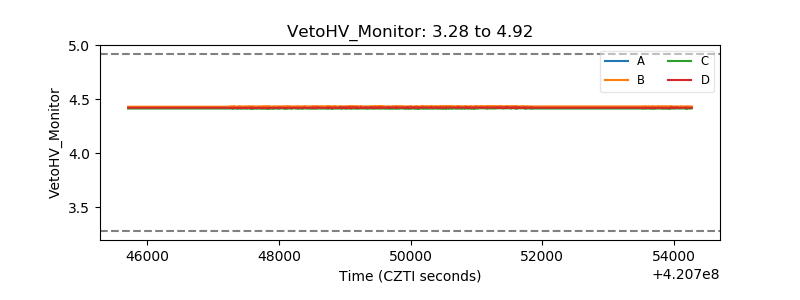 |
| Veto LLD | 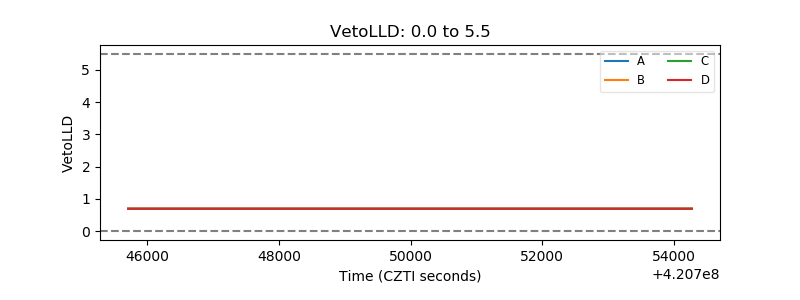 |
| Alpha Counter | 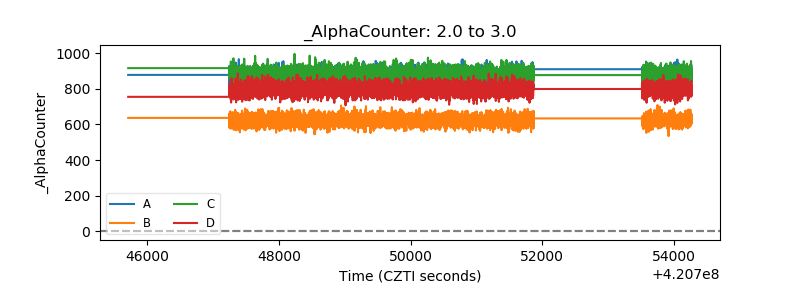 |
| _CPM_Rate | 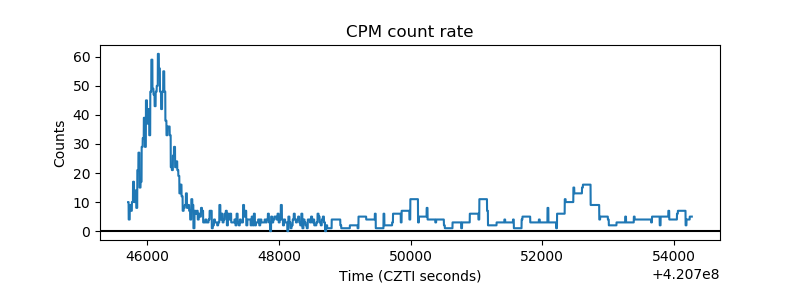 |
| CZT Counter | 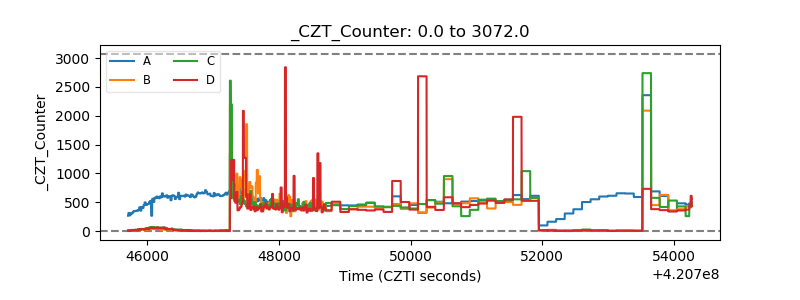 |
| +2.5 Volts monitor | 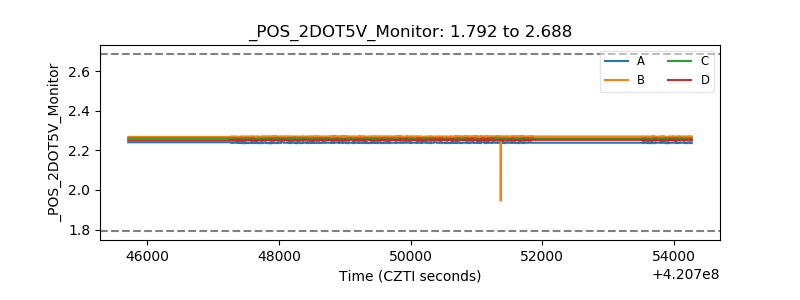 |
| +5 Volts monitor |  |
| _ROLL_ROT | 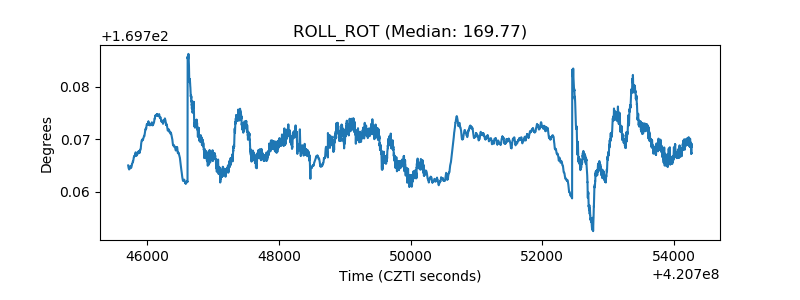 |
| _Roll_DEC | 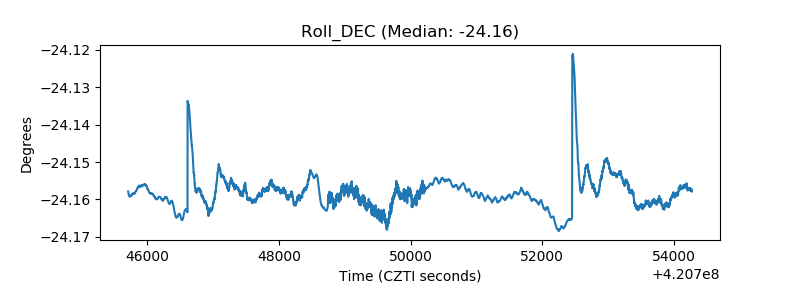 |
| _Roll_RA | 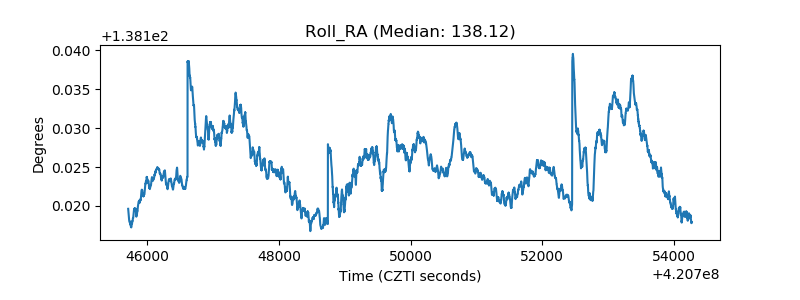 |
| Veto Counter | 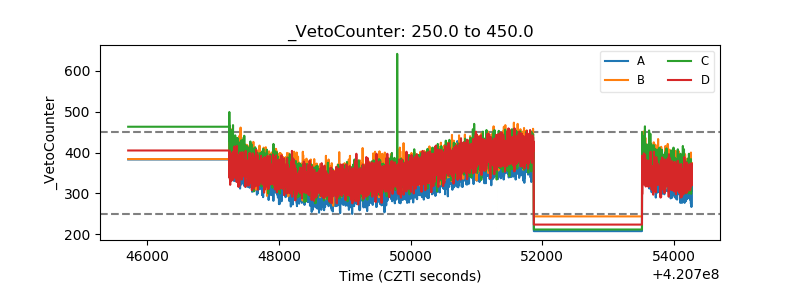 |