| Param | Original file | Final file |
|---|---|---|
| Filename | modeM0/AS1A12_006T09_9000005592_41059cztM0_level2.fits | modeM0/AS1A12_006T09_9000005592_41059cztM0_level2_quad_clean.evt |
| Size (bytes) | 379,350,720 | 97,217,280 |
| Size | 361.8 MB | 92.7 MB |
| Events in quadrant A | 3,212,218 | 657,708 |
| Events in quadrant B | 2,813,536 | 668,627 |
| Events in quadrant C | 2,975,821 | 632,764 |
| Events in quadrant D | 4,575,258 | 566,702 |
| Mode M9 | |||
|---|---|---|---|
| Quadrant | BADHDUFLAG | Total packets | Discarded packets |
| A | 0 | 30 | 0 |
| B | 0 | 30 | 0 |
| C | 0 | 30 | 0 |
| D | 0 | 30 | 0 |
| Mode SS | |||
|---|---|---|---|
| Quadrant | BADHDUFLAG | Total packets | Discarded packets |
| A | 0 | 123 | 1 |
| B | 0 | 124 | 0 |
| C | 0 | 124 | 0 |
| D | 0 | 124 | 0 |
| Mode M0 | |||
|---|---|---|---|
| Quadrant | BADHDUFLAG | Total packets | Discarded packets |
| A | 0 | 13200 | 3 |
| B | 0 | 12568 | 2 |
| C | 0 | 12552 | 2 |
| D | 0 | 17903 | 2 |
| Quadrant | Total seconds | Saturated seconds | Saturation percentage |
|---|---|---|---|
| A | 5981 | 14 | 0.234075% |
| B | 5981 | 57 | 0.953018% |
| C | 5981 | 31 | 0.518308% |
| D | 5981 | 382 | 6.386892% |
Noise dominated data is calculated using 1-second bins in cleaned event files. If a bin has >2000 counts, and if more than 50% of those come from <1% of pixels, then it is considered to be noise-dominated and hence unusable.
| Quadrant | # 1 sec bins | Bins with >0 counts | Bins with >2000 counts | High rate bins dominated by noise | Noise dominated (total time) | Noise dominated (detector-on time) | Marked lightcurve |
|---|---|---|---|---|---|---|---|
| A | 8997 | 5983 | 6 | 6 | 0.07% | 0.10% | 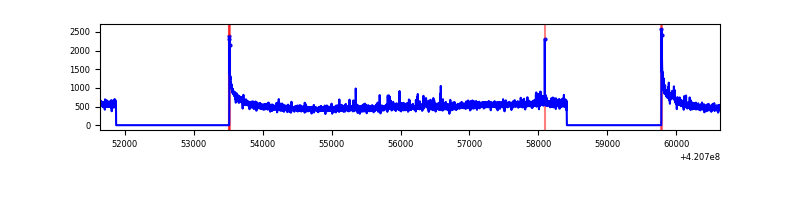 |
| B | 8997 | 5983 | 34 | 34 | 0.38% | 0.57% | 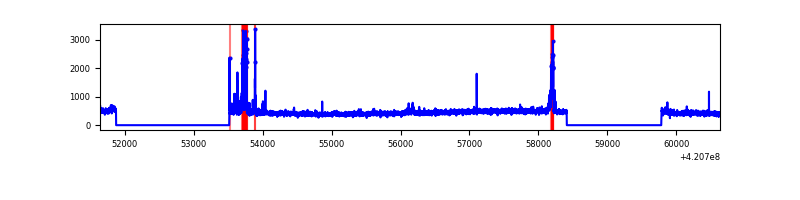 |
| C | 8997 | 5983 | 26 | 26 | 0.29% | 0.43% | 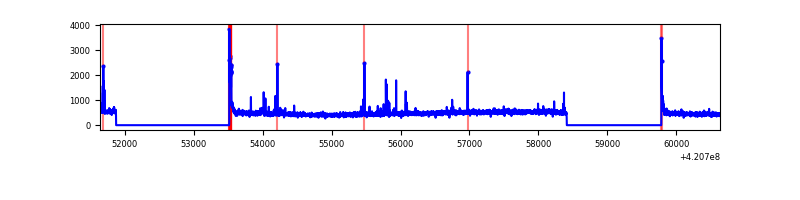 |
| D | 8997 | 5983 | 316 | 316 | 3.51% | 5.28% | 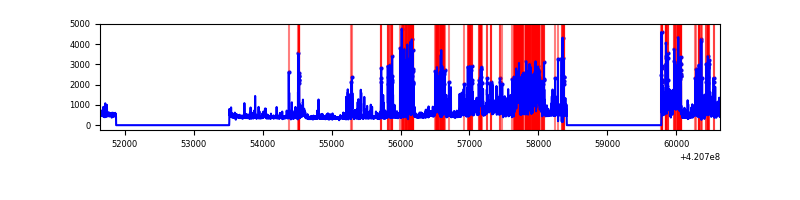 |
Top three noisy pixels from each quadrant. If the there are fewer than three noisy pixels in the level2.evt file, extra rows are filled as -1
| Pixel properties | Quadrant properties | ||||||
|---|---|---|---|---|---|---|---|
| Quadrant | DetID | PixID | Counts | Sigma | Mean | Median | Sigma |
| A | 10 | 83 | 544780 | 3954.16 | 664 | 651 | 137.6 |
| A | 12 | 189 | 88940 | 641.59 | 664 | 651 | 137.6 |
| A | 13 | 254 | 10537 | 71.84 | 664 | 651 | 137.6 |
| B | 8 | 128 | 139296 | 1079.22 | 657 | 638 | 128.5 |
| B | 5 | 255 | 45310 | 347.7 | 657 | 638 | 128.5 |
| B | 0 | 229 | 23122 | 175.0 | 657 | 638 | 128.5 |
| C | 15 | 214 | 273426 | 1811.09 | 643 | 647 | 150.6 |
| C | 0 | 10 | 93140 | 614.1 | 643 | 647 | 150.6 |
| C | 14 | 254 | 53990 | 354.17 | 643 | 647 | 150.6 |
| D | 2 | 16 | 1043922 | 6687.39 | 632 | 615 | 156.0 |
| D | 12 | 79 | 765686 | 4903.95 | 632 | 615 | 156.0 |
| D | 13 | 249 | 108013 | 688.4 | 632 | 615 | 156.0 |
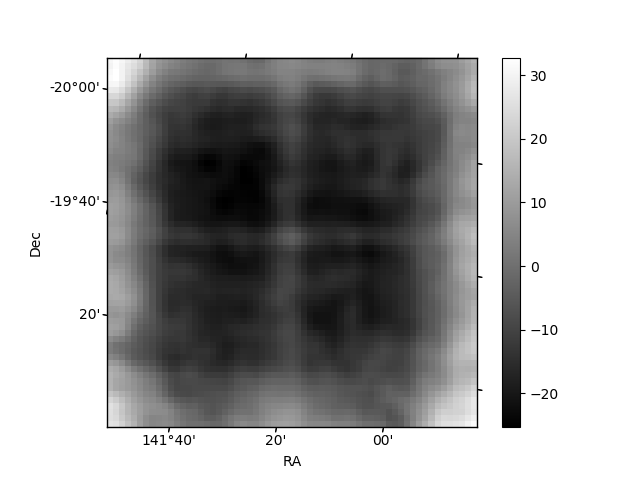
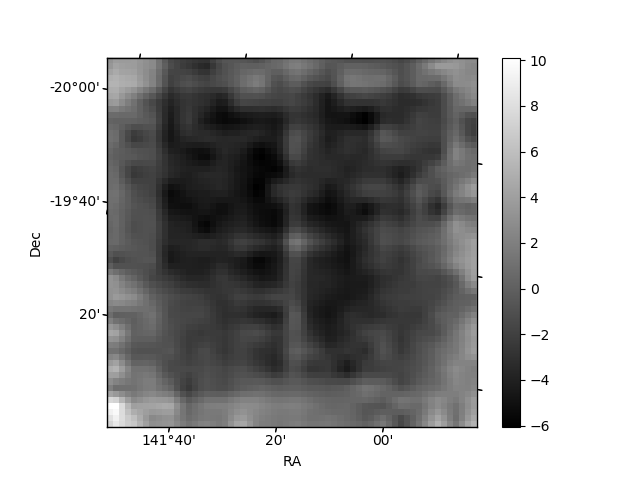
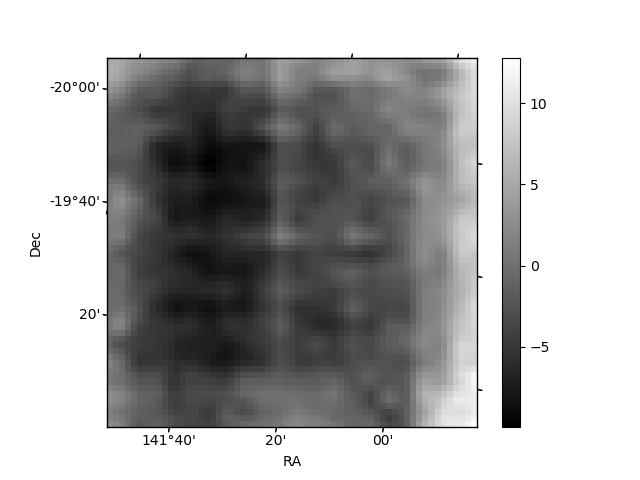
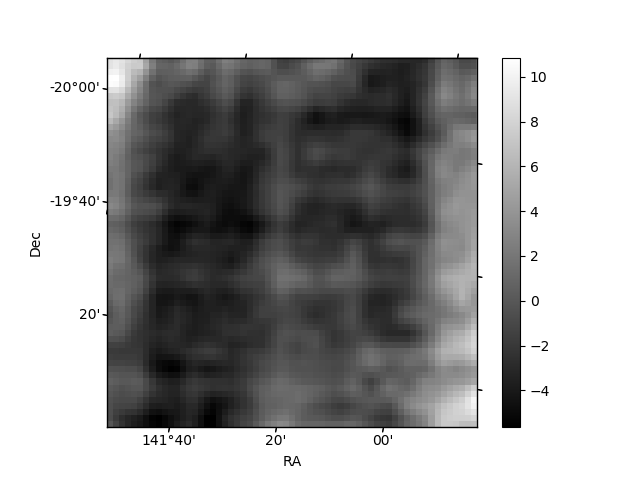
Histogram calculated using DETX and DETY for each event in the final _common_clean file
| Quadrant A | 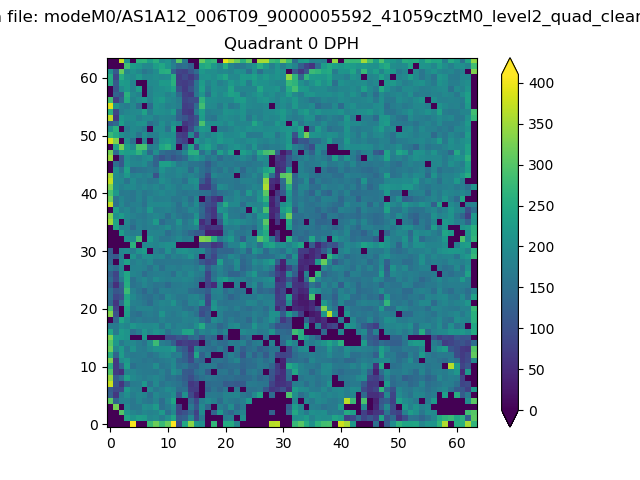 |
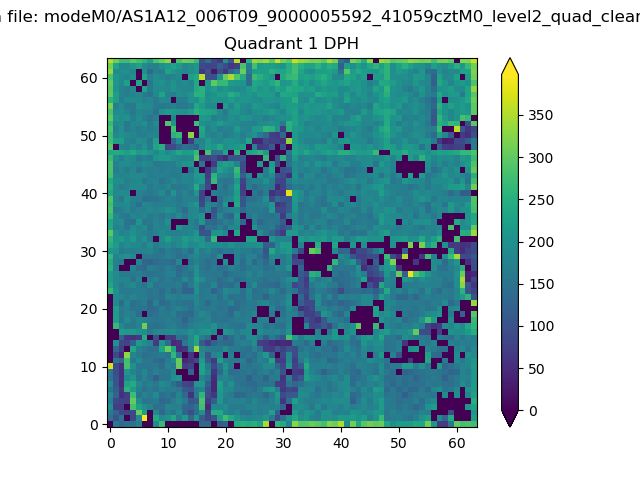 |
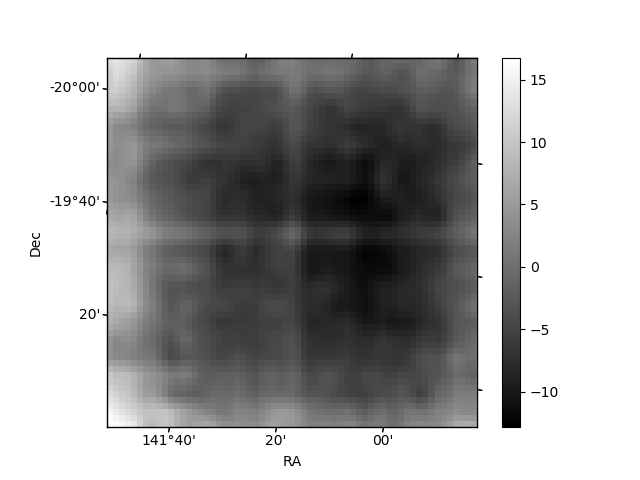
Quadrant B |
|---|---|---|---|
| Quadrant D | 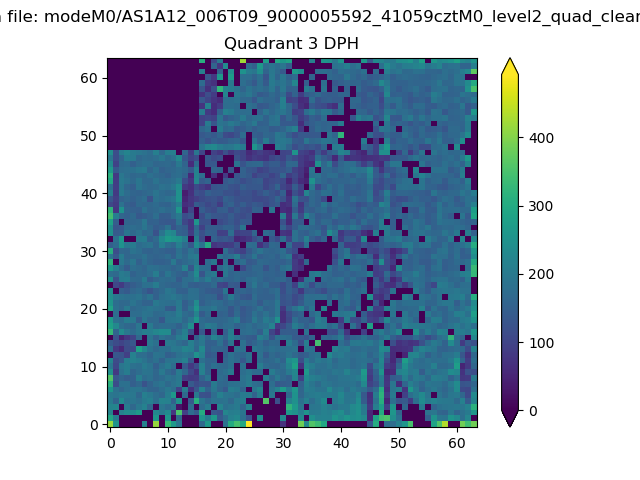 |
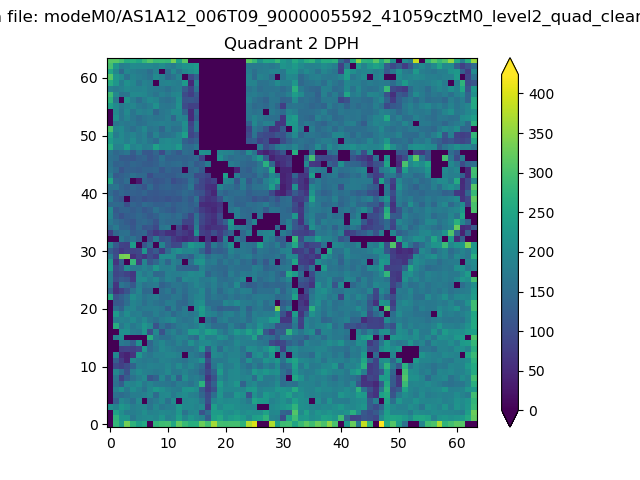 |
Quadrant C |
| Plot type | Count rate plots | Images |
|---|---|---|
| Comparison with Poisson distribution Blue bars denote a histogram of data divided into 1 sec bins. Red curve is a Poisson curve with rate = median count rate of data. |
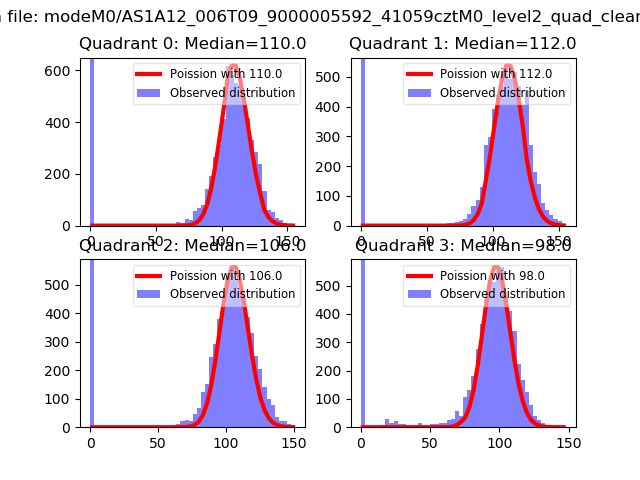 |
 |
| Quadrant-wise count rates Data is divided into 100 sec bins |
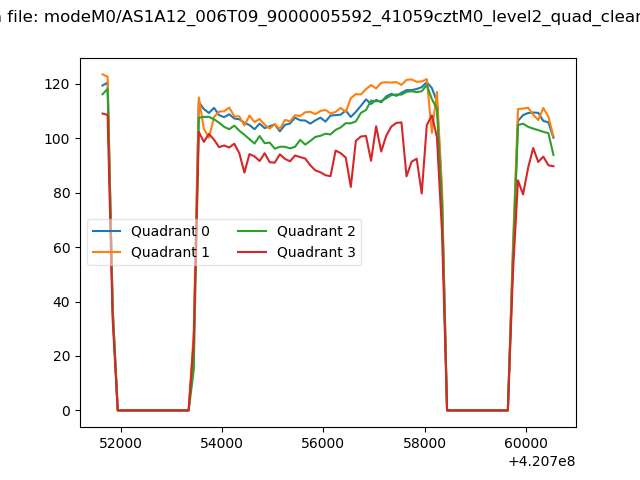 |
|
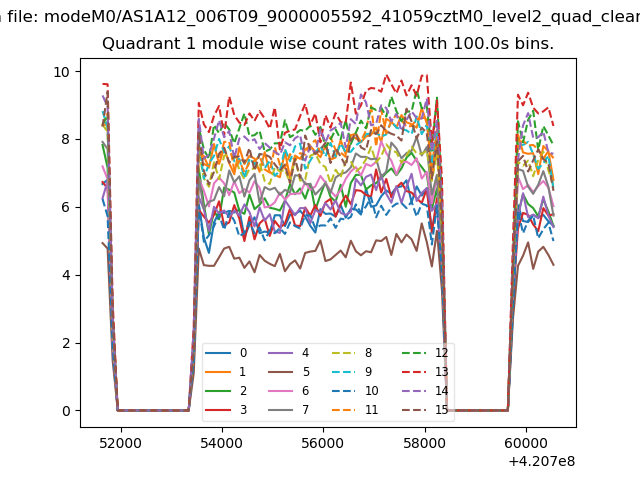
| Module-wise count rates for Quadrant A Data is divided into 100 sec bins |
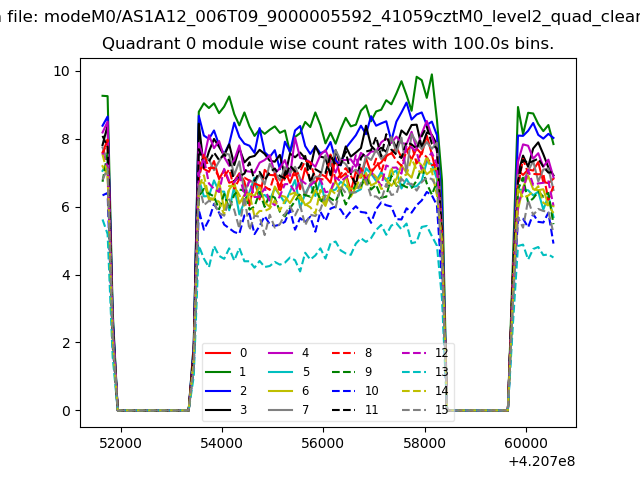 |
 |
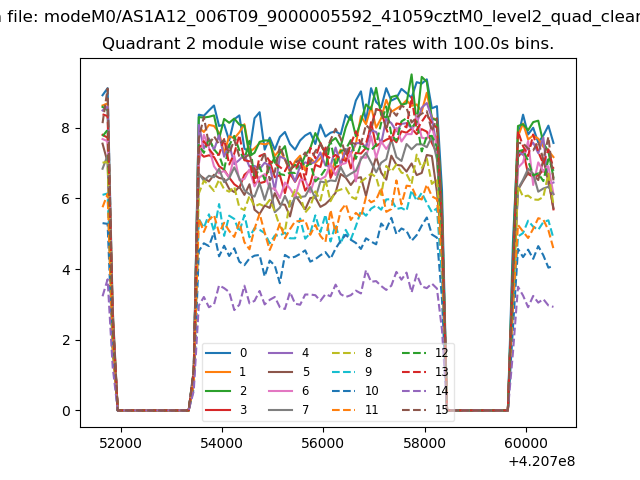
| Module-wise count rates for Quadrant B Data is divided into 100 sec bins |
 |
 |
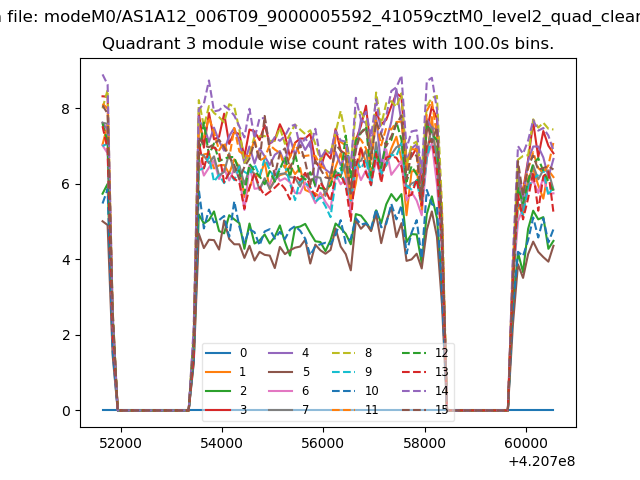
| Module-wise count rates for Quadrant C Data is divided into 100 sec bins |
 |
 |
| Module-wise count rates for Quadrant D Data is divided into 100 sec bins |
 |
 |
| Parameter | Plot |
|---|---|
| CZT HV Monitor | 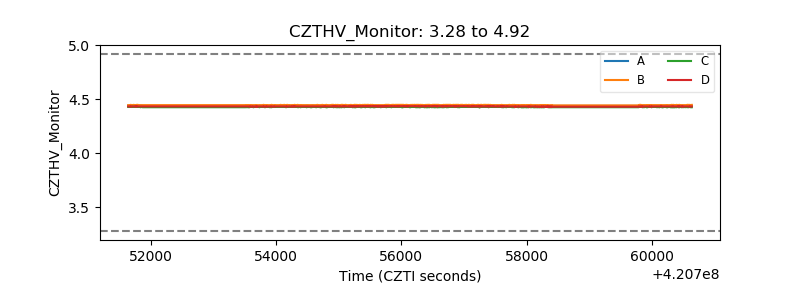 |
| D_VDD | 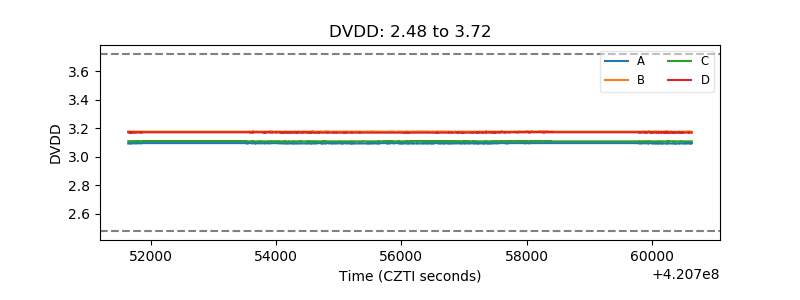 |
| Temperature 1 | 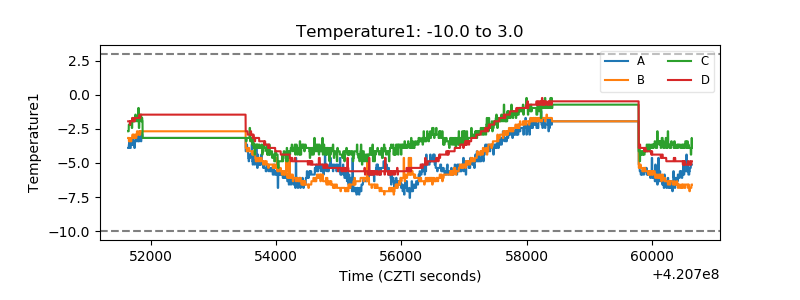 |
| Veto HV Monitor | 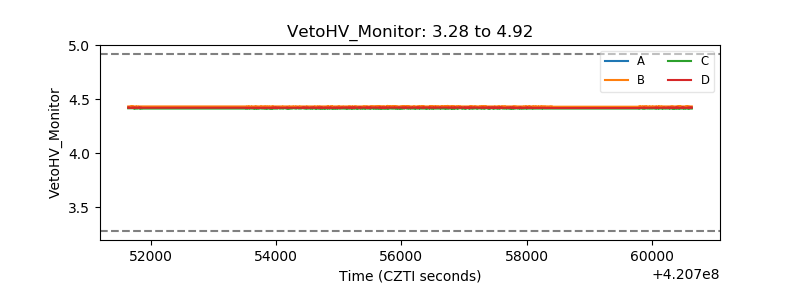 |
| Veto LLD | 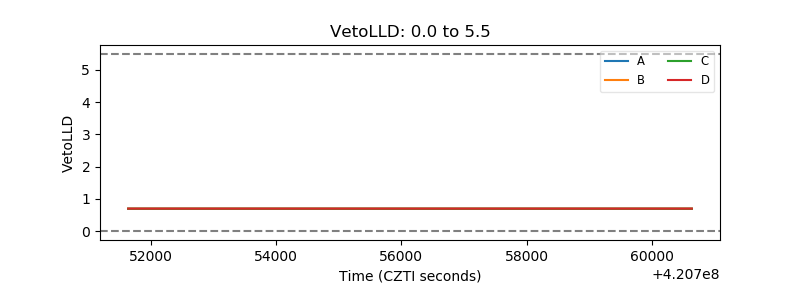 |
| Alpha Counter | 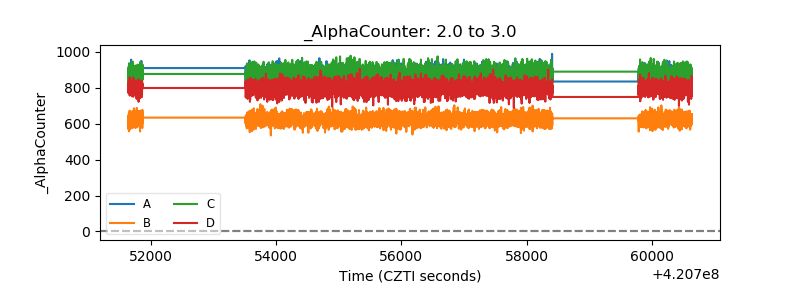 |
| _CPM_Rate | 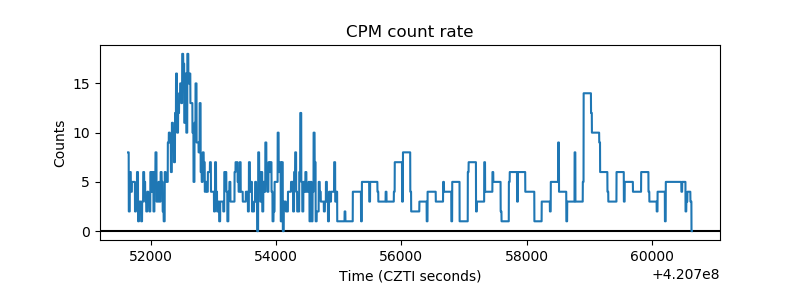 |
| CZT Counter | 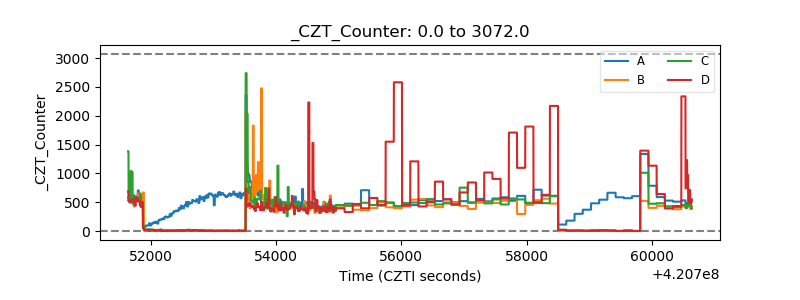 |
| +2.5 Volts monitor | 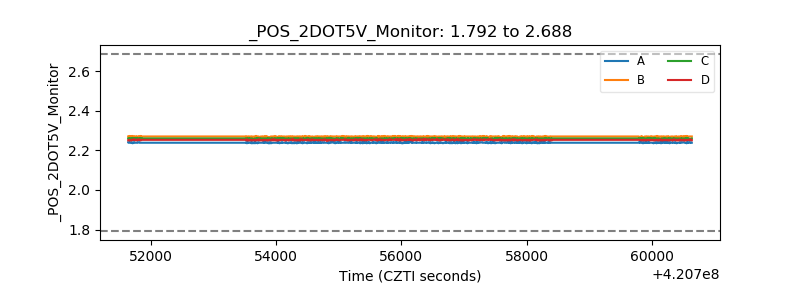 |
| +5 Volts monitor | 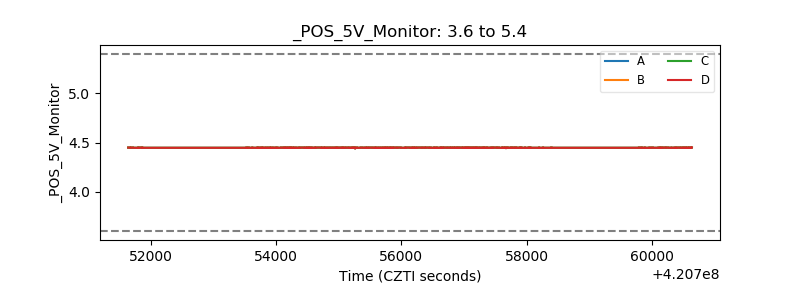 |
| _ROLL_ROT | 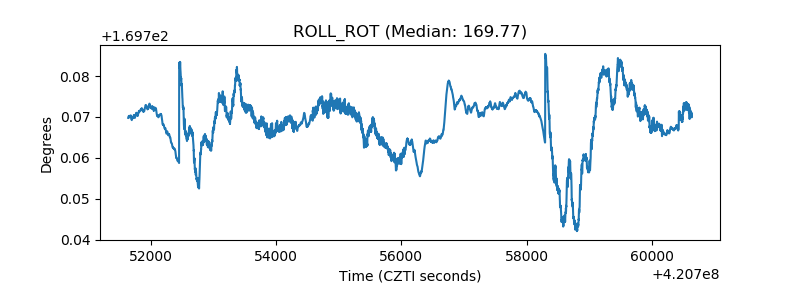 |
| _Roll_DEC | 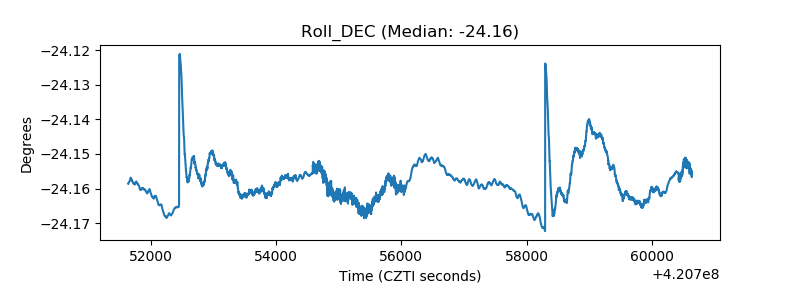 |
| _Roll_RA | 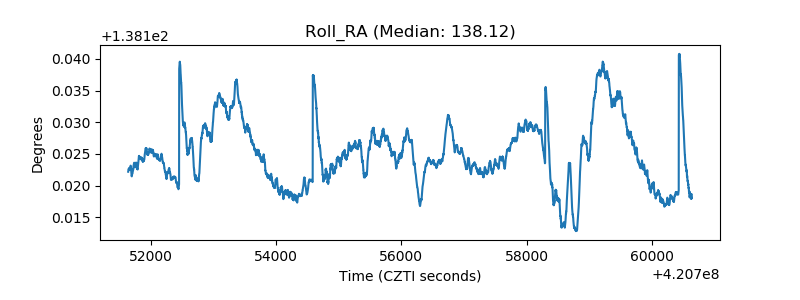 |
| Veto Counter | 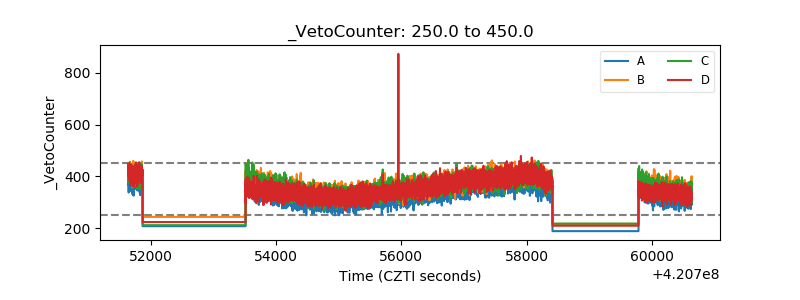 |