| Param | Original file | Final file |
|---|---|---|
| Filename | modeM0/AS1A12_006T09_9000005592_41060cztM0_level2.fits | modeM0/AS1A12_006T09_9000005592_41060cztM0_level2_quad_clean.evt |
| Size (bytes) | 382,956,480 | 93,816,000 |
| Size | 365.2 MB | 89.5 MB |
| Events in quadrant A | 3,144,506 | 638,672 |
| Events in quadrant B | 2,721,204 | 651,892 |
| Events in quadrant C | 2,829,924 | 610,625 |
| Events in quadrant D | 5,025,484 | 530,841 |
| Mode M9 | |||
|---|---|---|---|
| Quadrant | BADHDUFLAG | Total packets | Discarded packets |
| A | 0 | 25 | 0 |
| B | 0 | 25 | 0 |
| C | 0 | 25 | 0 |
| D | 0 | 25 | 0 |
| Mode SS | |||
|---|---|---|---|
| Quadrant | BADHDUFLAG | Total packets | Discarded packets |
| A | 0 | 120 | 0 |
| B | 0 | 120 | 0 |
| C | 0 | 120 | 0 |
| D | 0 | 120 | 0 |
| Mode M0 | |||
|---|---|---|---|
| Quadrant | BADHDUFLAG | Total packets | Discarded packets |
| A | 0 | 12913 | 4 |
| B | 0 | 12165 | 7 |
| C | 0 | 12088 | 2 |
| D | 0 | 19007 | 24 |
| Quadrant | Total seconds | Saturated seconds | Saturation percentage |
|---|---|---|---|
| A | 5844 | 18 | 0.308008% |
| B | 5842 | 20 | 0.342349% |
| C | 5845 | 32 | 0.547476% |
| D | 5837 | 537 | 9.199931% |
Noise dominated data is calculated using 1-second bins in cleaned event files. If a bin has >2000 counts, and if more than 50% of those come from <1% of pixels, then it is considered to be noise-dominated and hence unusable.
| Quadrant | # 1 sec bins | Bins with >0 counts | Bins with >2000 counts | High rate bins dominated by noise | Noise dominated (total time) | Noise dominated (detector-on time) | Marked lightcurve |
|---|---|---|---|---|---|---|---|
| A | 7126 | 5846 | 5 | 5 | 0.07% | 0.09% |  |
| B | 7126 | 5846 | 12 | 12 | 0.17% | 0.21% |  |
| C | 7126 | 5846 | 18 | 18 | 0.25% | 0.31% |  |
| D | 7126 | 5843 | 491 | 491 | 6.89% | 8.40% | 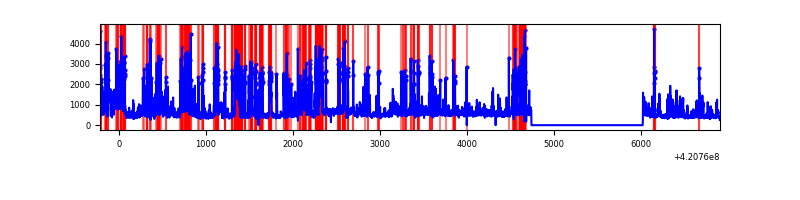 |
Top three noisy pixels from each quadrant. If the there are fewer than three noisy pixels in the level2.evt file, extra rows are filled as -1
| Pixel properties | Quadrant properties | ||||||
|---|---|---|---|---|---|---|---|
| Quadrant | DetID | PixID | Counts | Sigma | Mean | Median | Sigma |
| A | 10 | 83 | 547989 | 4132.17 | 645 | 632 | 132.5 |
| A | 12 | 189 | 87104 | 652.8 | 645 | 632 | 132.5 |
| A | 13 | 254 | 9812 | 69.3 | 645 | 632 | 132.5 |
| B | 0 | 190 | 127310 | 1010.24 | 640 | 621 | 125.4 |
| B | 5 | 255 | 50319 | 396.3 | 640 | 621 | 125.4 |
| B | 12 | 111 | 16213 | 124.33 | 640 | 621 | 125.4 |
| C | 15 | 214 | 264622 | 1799.25 | 623 | 624 | 146.7 |
| C | 14 | 254 | 69292 | 468.0 | 623 | 624 | 146.7 |
| C | 0 | 10 | 57150 | 385.24 | 623 | 624 | 146.7 |
| D | 12 | 79 | 2044475 | 13689.82 | 604 | 585 | 149.3 |
| D | 2 | 16 | 366441 | 2450.47 | 604 | 585 | 149.3 |
| D | 13 | 249 | 76290 | 507.07 | 604 | 585 | 149.3 |
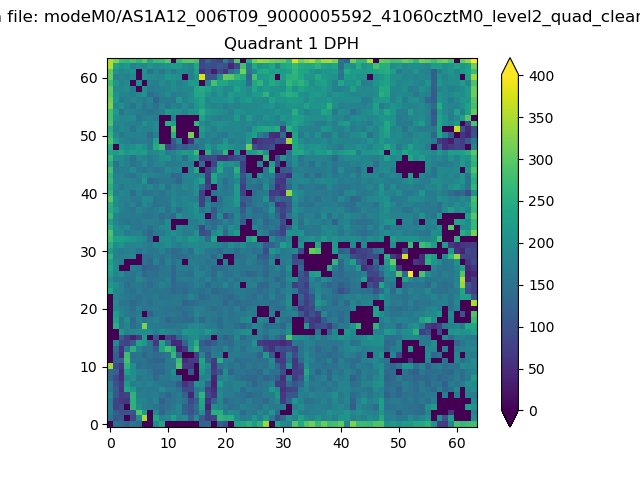
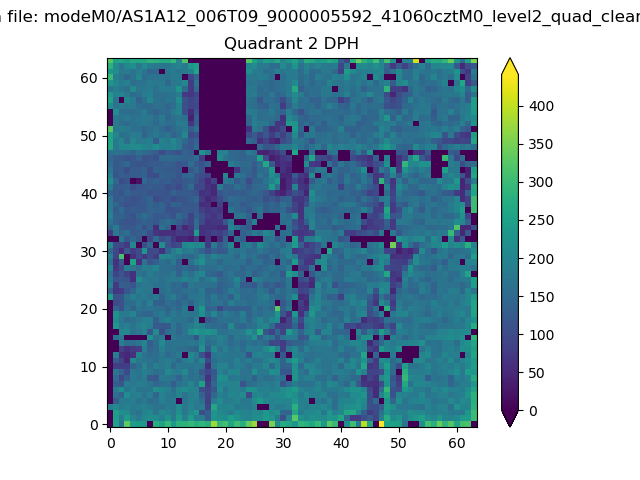
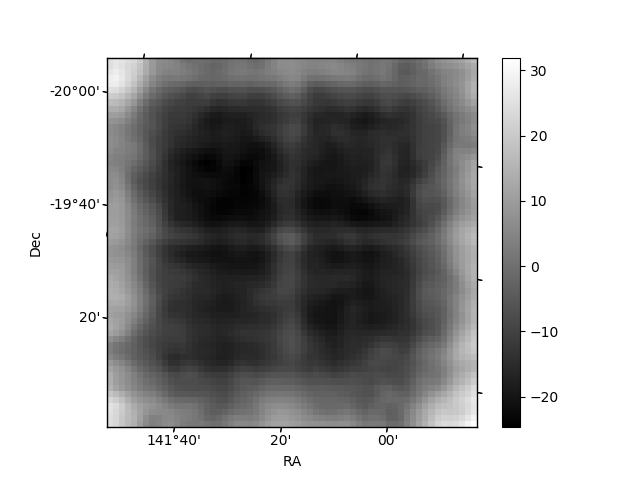
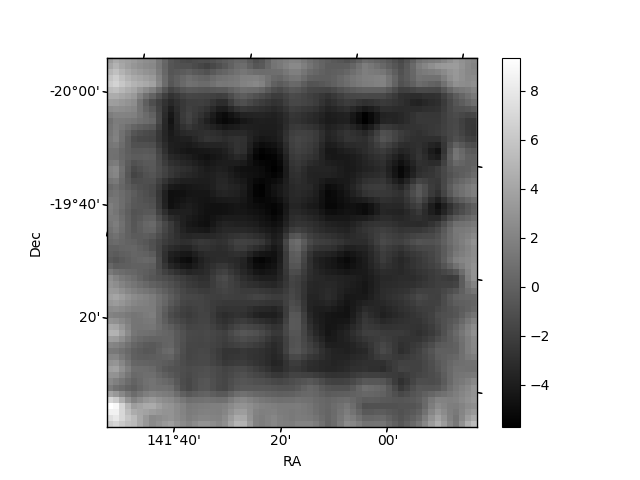
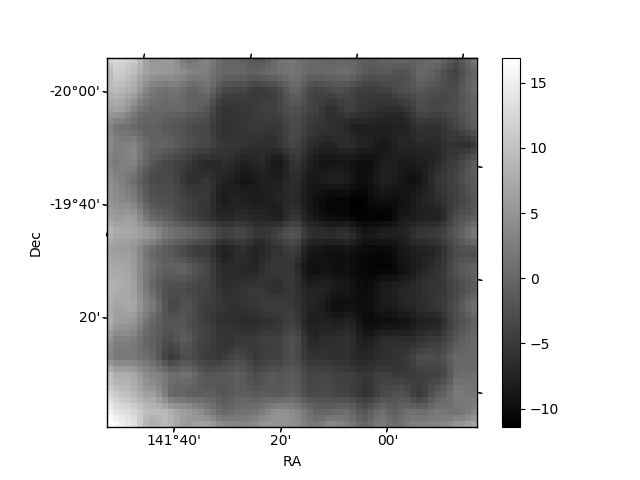
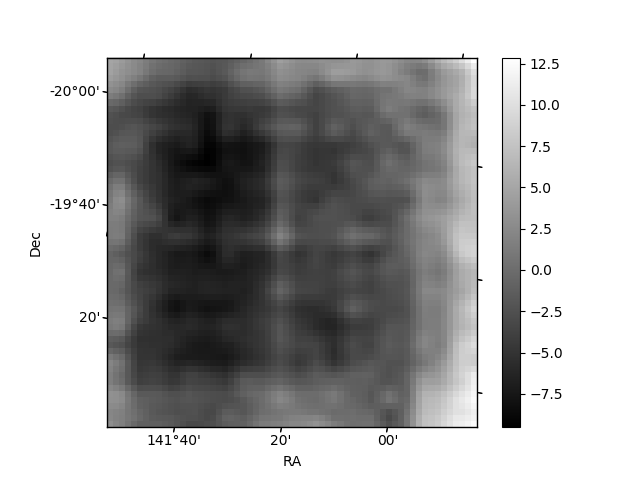
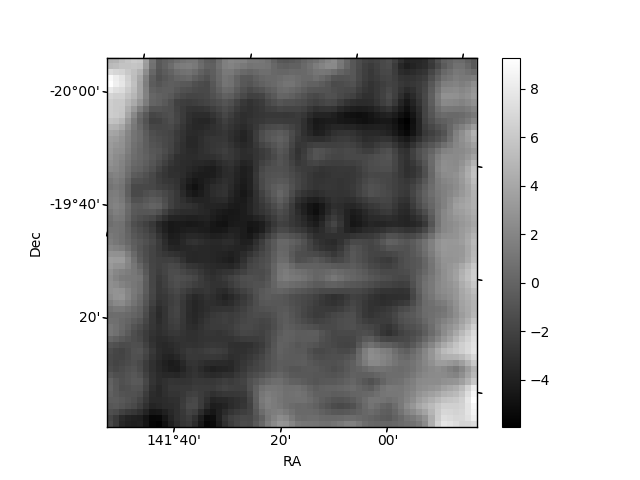
Histogram calculated using DETX and DETY for each event in the final _common_clean file
| Quadrant A | 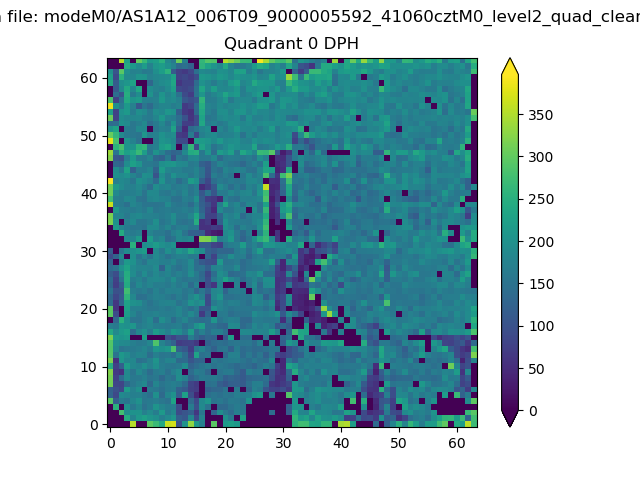 |
 |
Quadrant B |
|---|---|---|---|
| Quadrant D | 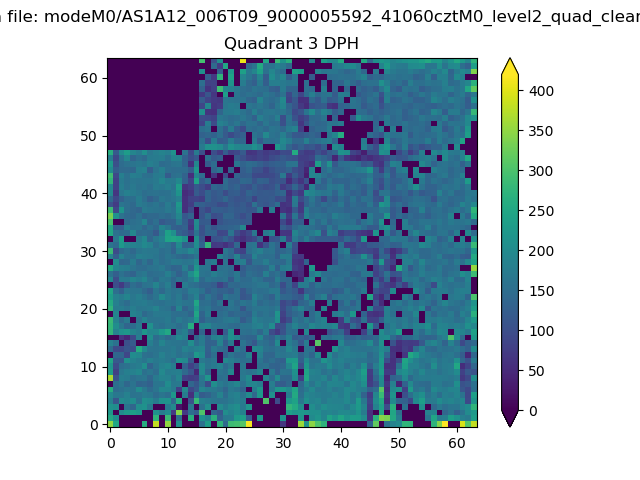 |
 |
Quadrant C |
| Plot type | Count rate plots | Images |
|---|---|---|
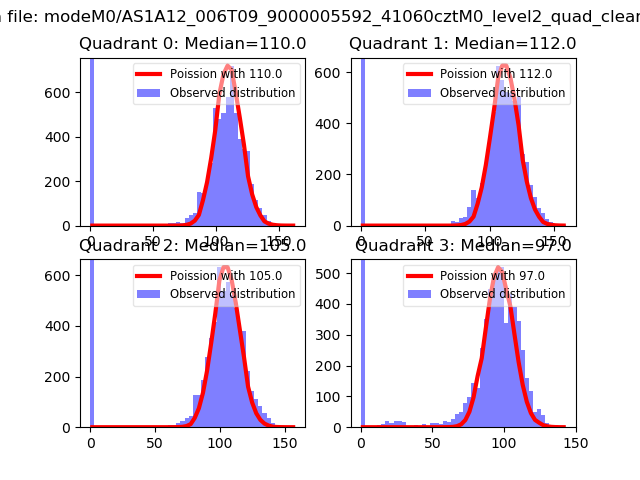
| Comparison with Poisson distribution Blue bars denote a histogram of data divided into 1 sec bins. Red curve is a Poisson curve with rate = median count rate of data. |
 |
 |
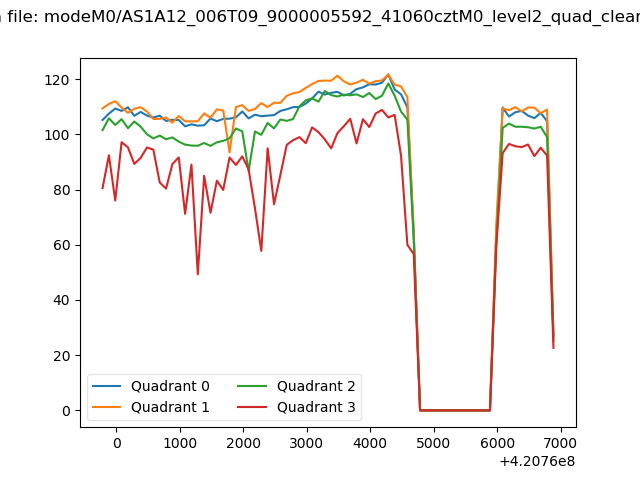
| Quadrant-wise count rates Data is divided into 100 sec bins |
 |
|
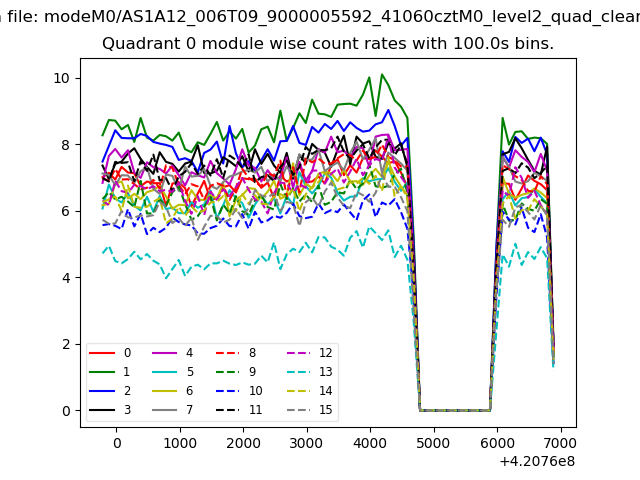
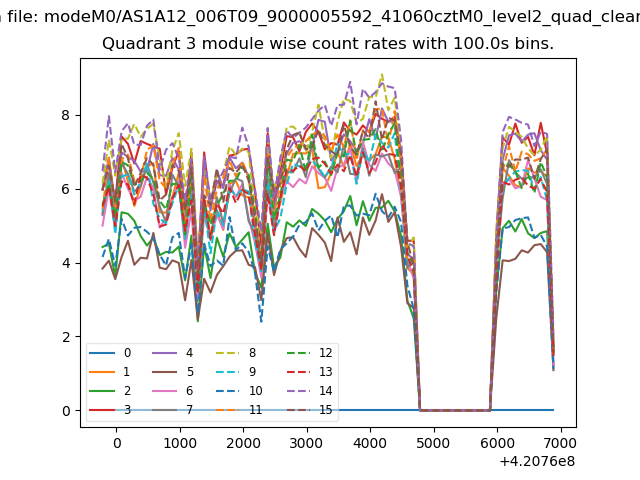
| Module-wise count rates for Quadrant A Data is divided into 100 sec bins |
 |
 |
| Module-wise count rates for Quadrant B Data is divided into 100 sec bins |
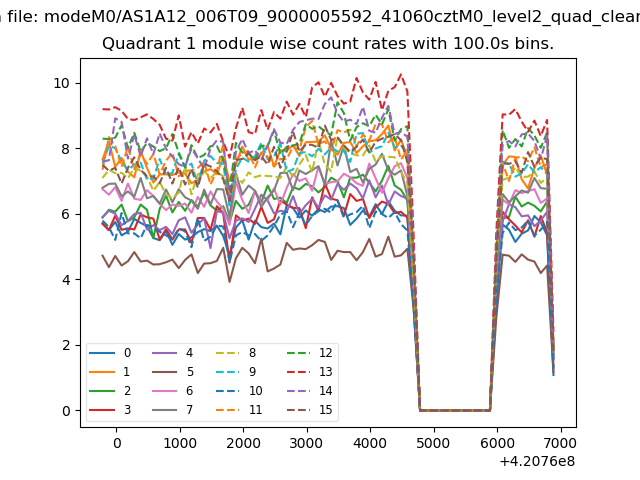 |
 |
| Module-wise count rates for Quadrant C Data is divided into 100 sec bins |
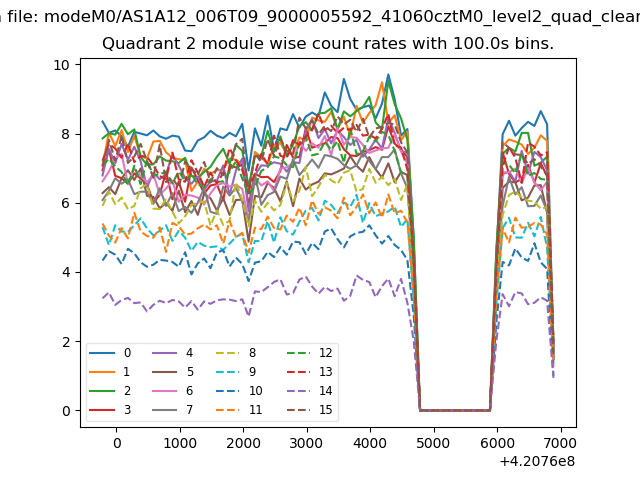 |
 |
| Module-wise count rates for Quadrant D Data is divided into 100 sec bins |
 |
 |
| Parameter | Plot |
|---|---|
| CZT HV Monitor | 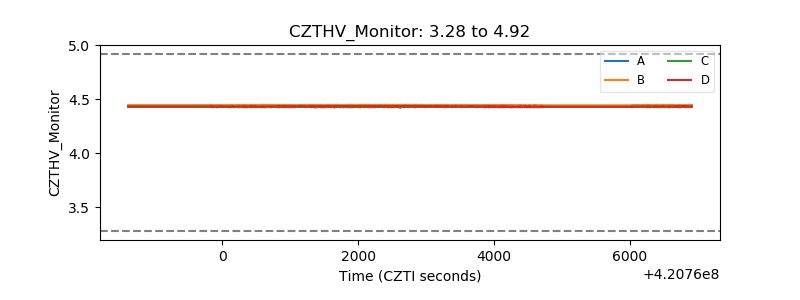 |
| D_VDD | 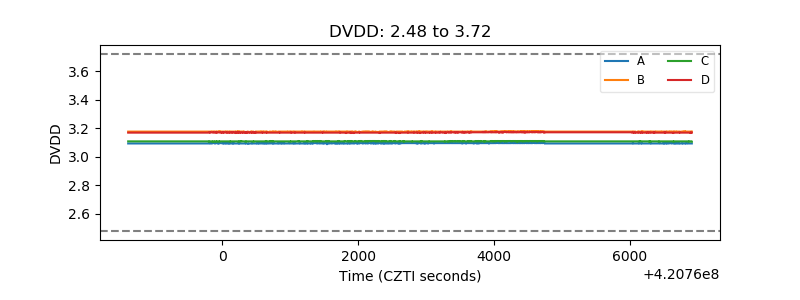 |
| Temperature 1 | 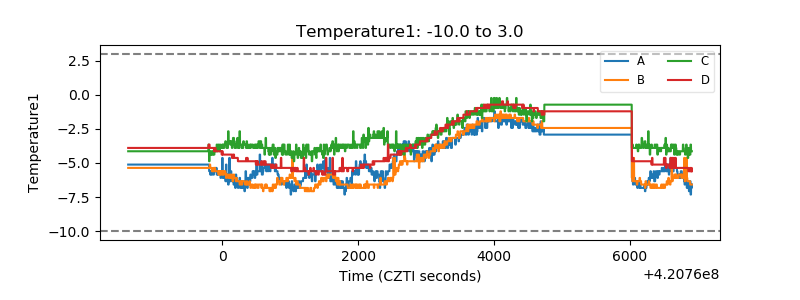 |
| Veto HV Monitor | 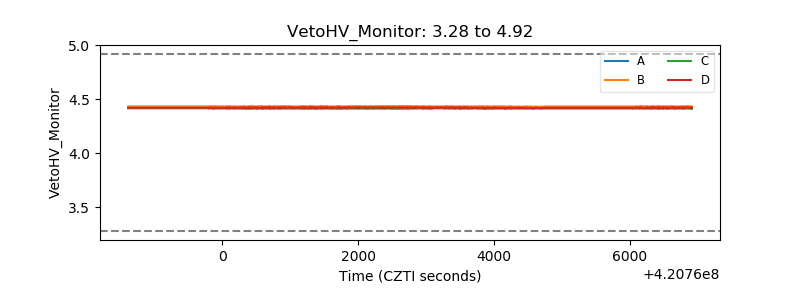 |
| Veto LLD | 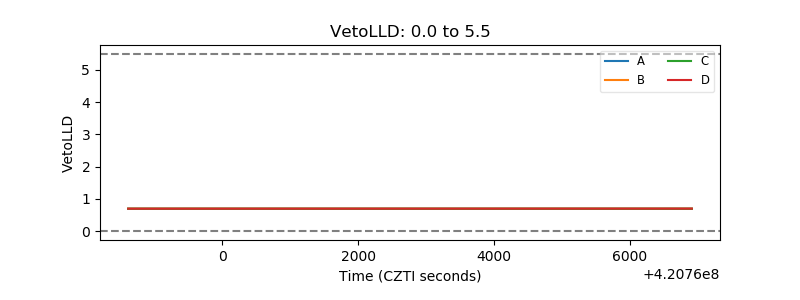 |
| Alpha Counter | 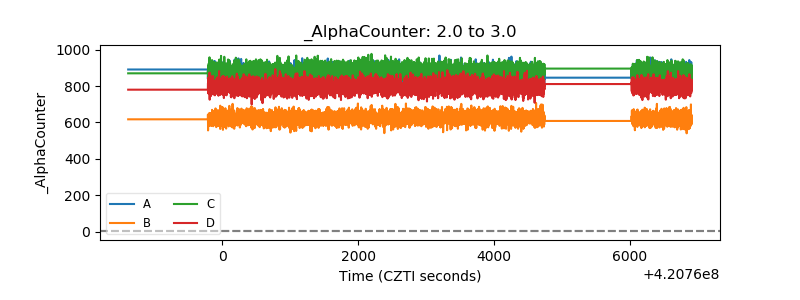 |
| _CPM_Rate | 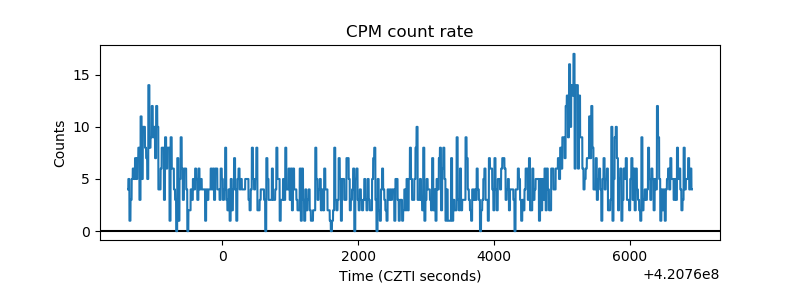 |
| CZT Counter | 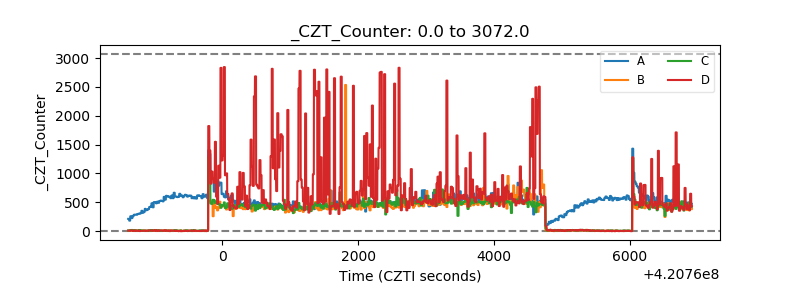 |
| +2.5 Volts monitor |  |
| +5 Volts monitor | 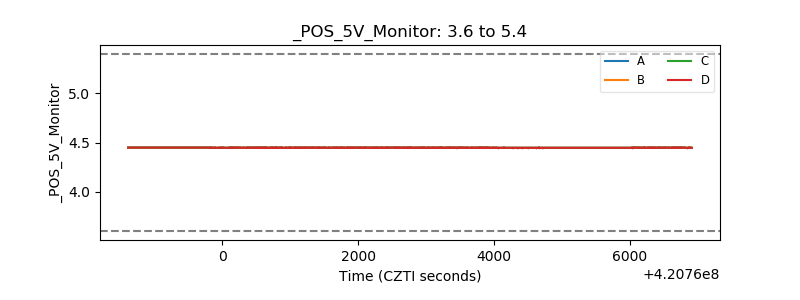 |
| _ROLL_ROT | 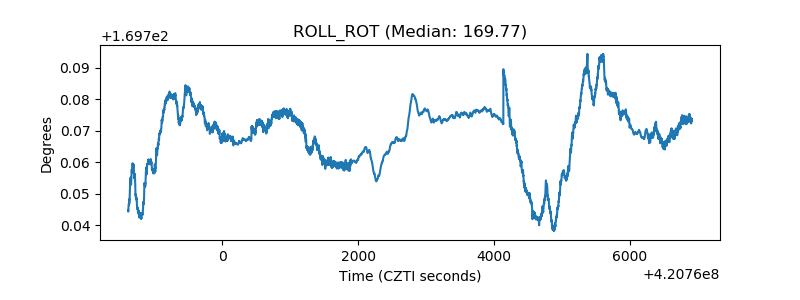 |
| _Roll_DEC | 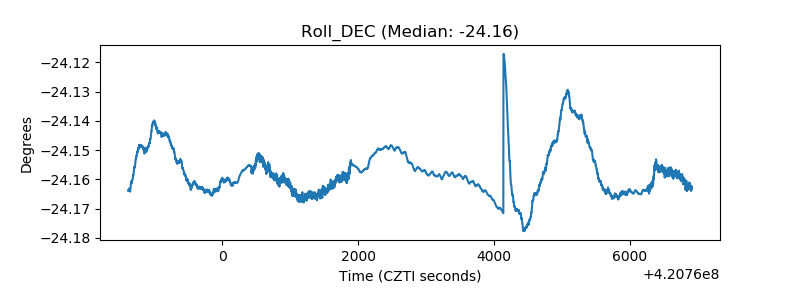 |
| _Roll_RA | 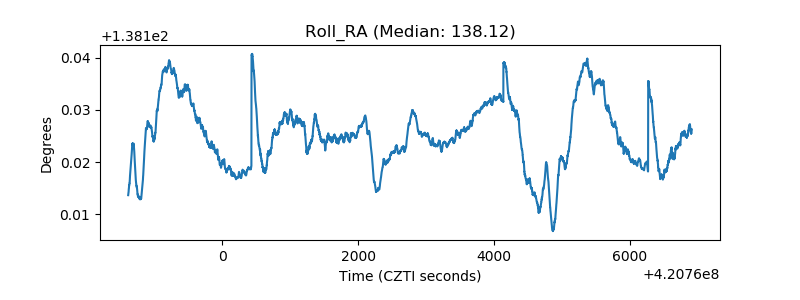 |
| Veto Counter | 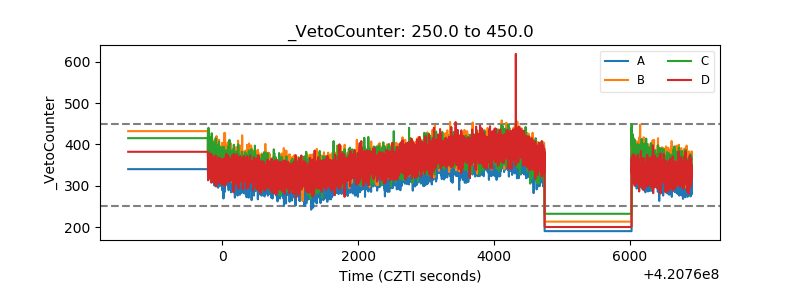 |