| Param | Original file | Final file |
|---|---|---|
| Filename | modeM0/AS1A12_093T02_9000005594_41063cztM0_level2.fits | modeM0/AS1A12_093T02_9000005594_41063cztM0_level2_quad_clean.evt |
| Size (bytes) | 54,460,800 | 14,590,080 |
| Size | 51.9 MB | 13.9 MB |
| Events in quadrant A | 526,486 | 94,864 |
| Events in quadrant B | 424,787 | 97,526 |
| Events in quadrant C | 443,900 | 94,005 |
| Events in quadrant D | 549,368 | 87,212 |
| Mode M0 | |||
|---|---|---|---|
| Quadrant | BADHDUFLAG | Total packets | Discarded packets |
| A | 0 | 2122 | 2 |
| B | 0 | 1841 | 1 |
| C | 0 | 1860 | 1 |
| D | 0 | 2217 | 1 |
| Mode SS | |||
|---|---|---|---|
| Quadrant | BADHDUFLAG | Total packets | Discarded packets |
| A | 0 | 18 | 0 |
| B | 0 | 18 | 0 |
| C | 0 | 18 | 0 |
| D | 0 | 18 | 0 |
| Mode M9 | |||
|---|---|---|---|
| Quadrant | BADHDUFLAG | Total packets | Discarded packets |
| A | 0 | 11 | 0 |
| B | 0 | 11 | 0 |
| C | 0 | 11 | 0 |
| D | 0 | 11 | 0 |
| Quadrant | Total seconds | Saturated seconds | Saturation percentage |
|---|---|---|---|
| A | 875 | 5 | 0.571429% |
| B | 875 | 1 | 0.114286% |
| C | 875 | 7 | 0.800000% |
| D | 875 | 10 | 1.142857% |
Noise dominated data is calculated using 1-second bins in cleaned event files. If a bin has >2000 counts, and if more than 50% of those come from <1% of pixels, then it is considered to be noise-dominated and hence unusable.
| Quadrant | # 1 sec bins | Bins with >0 counts | Bins with >2000 counts | High rate bins dominated by noise | Noise dominated (total time) | Noise dominated (detector-on time) | Marked lightcurve |
|---|---|---|---|---|---|---|---|
| A | 875 | 875 | 2 | 2 | 0.23% | 0.23% | 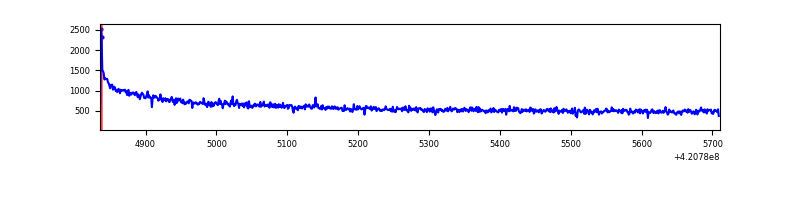 |
| B | 875 | 875 | 1 | 1 | 0.11% | 0.11% | 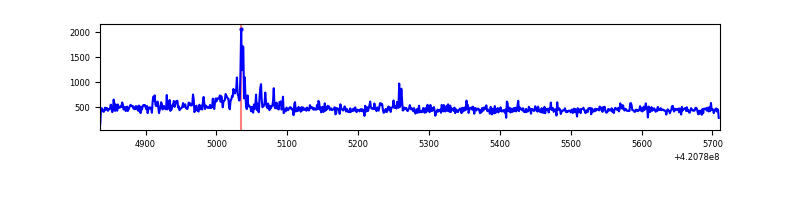 |
| C | 875 | 875 | 5 | 5 | 0.57% | 0.57% | 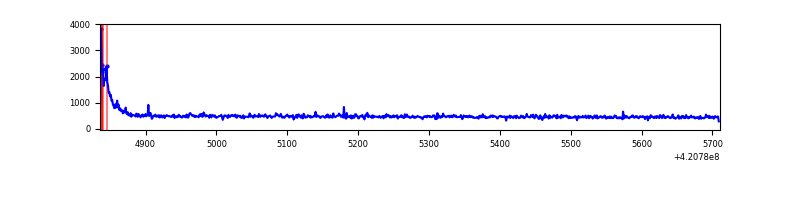 |
| D | 875 | 875 | 10 | 10 | 1.14% | 1.14% | 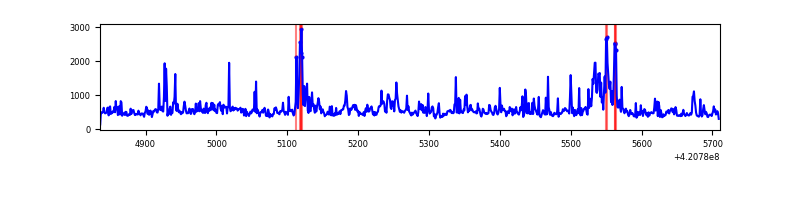 |
Top three noisy pixels from each quadrant. If the there are fewer than three noisy pixels in the level2.evt file, extra rows are filled as -1
| Pixel properties | Quadrant properties | ||||||
|---|---|---|---|---|---|---|---|
| Quadrant | DetID | PixID | Counts | Sigma | Mean | Median | Sigma |
| A | 10 | 83 | 147996 | 6662.51 | 96 | 94 | 22.2 |
| A | 13 | 254 | 1526 | 64.51 | 96 | 94 | 22.2 |
| A | 10 | 67 | 1372 | 57.57 | 96 | 94 | 22.2 |
| B | 0 | 190 | 29375 | 1358.66 | 97 | 95 | 21.6 |
| B | 0 | 229 | 8578 | 393.63 | 97 | 95 | 21.6 |
| B | 12 | 111 | 2661 | 119.07 | 97 | 95 | 21.6 |
| C | 15 | 214 | 43044 | 1823.08 | 93 | 94 | 23.6 |
| C | 0 | 10 | 30765 | 1301.88 | 93 | 94 | 23.6 |
| C | 14 | 254 | 4671 | 194.28 | 93 | 94 | 23.6 |
| D | 12 | 79 | 82892 | 3346.03 | 91 | 88 | 24.7 |
| D | 2 | 16 | 57231 | 2309.09 | 91 | 88 | 24.7 |
| D | 13 | 249 | 40549 | 1634.99 | 91 | 88 | 24.7 |
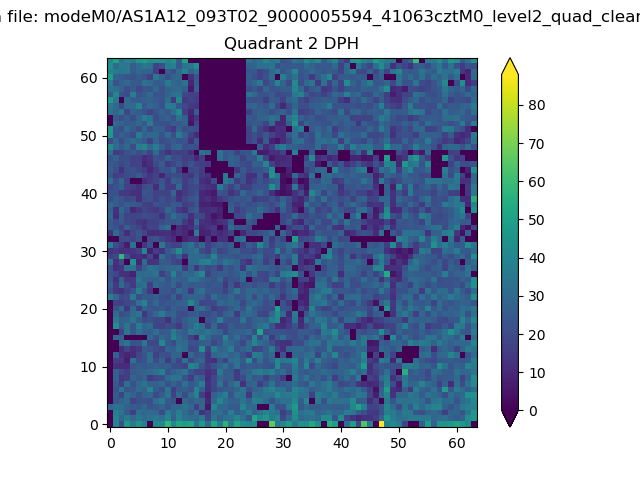
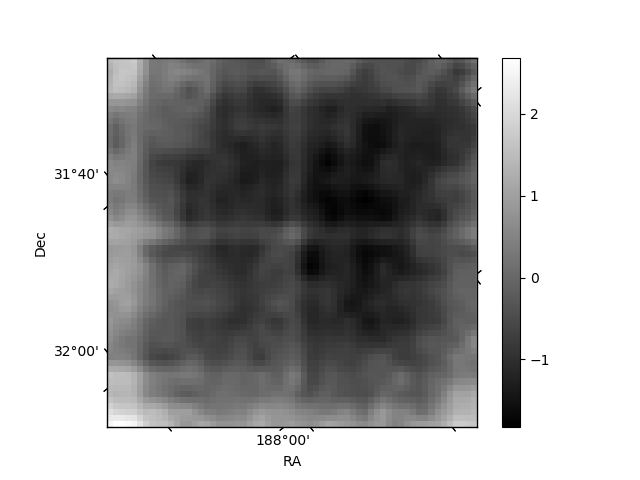
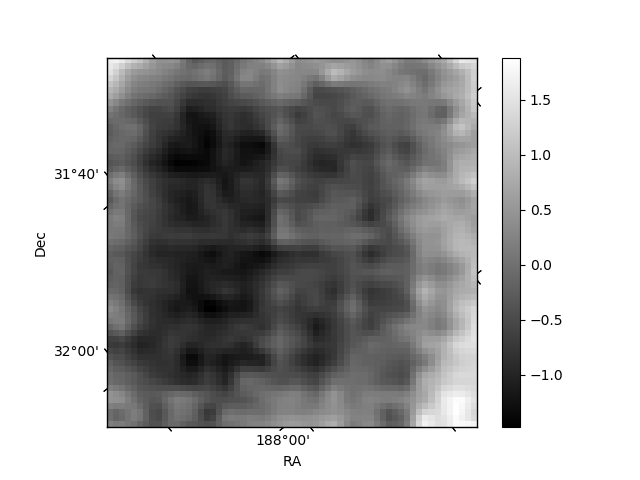
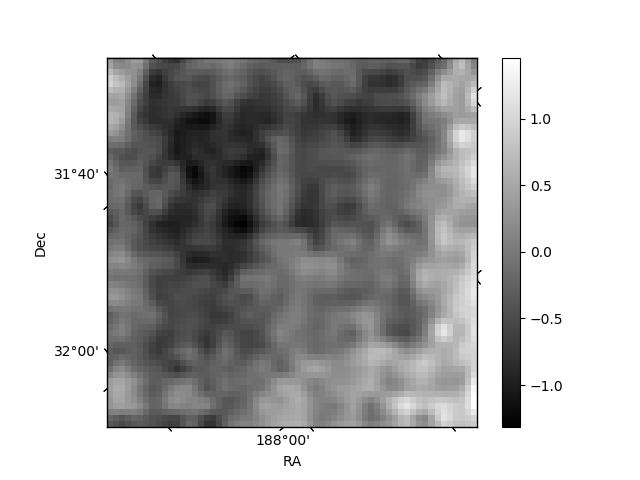
Histogram calculated using DETX and DETY for each event in the final _common_clean file
| Quadrant A | 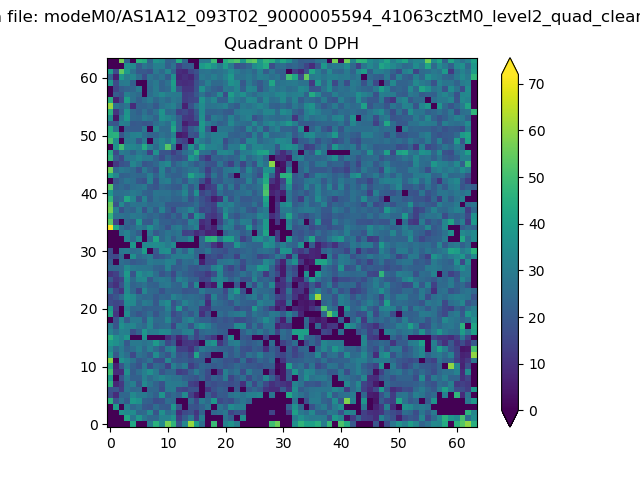 |
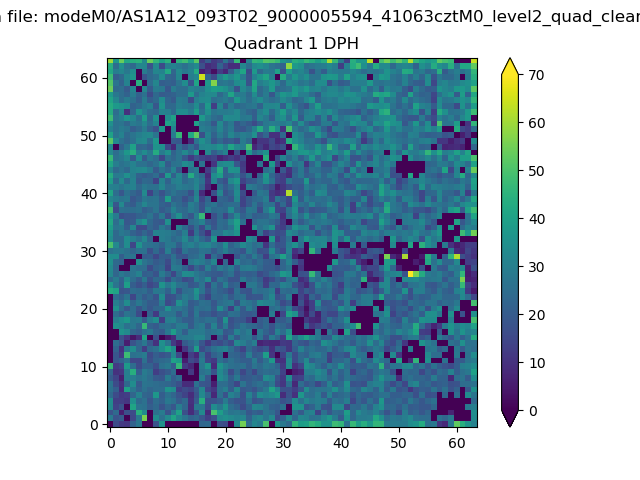 |
Quadrant B |
|---|---|---|---|
| Quadrant D | 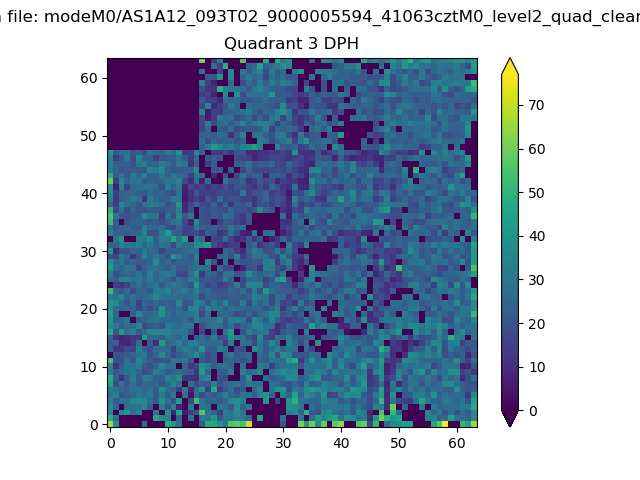 |
 |
Quadrant C |
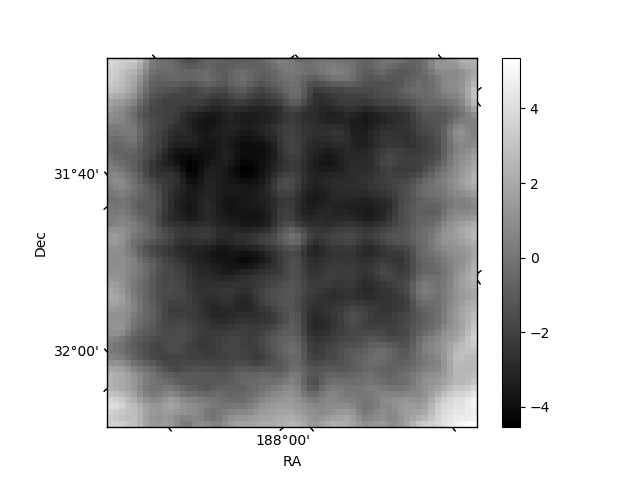
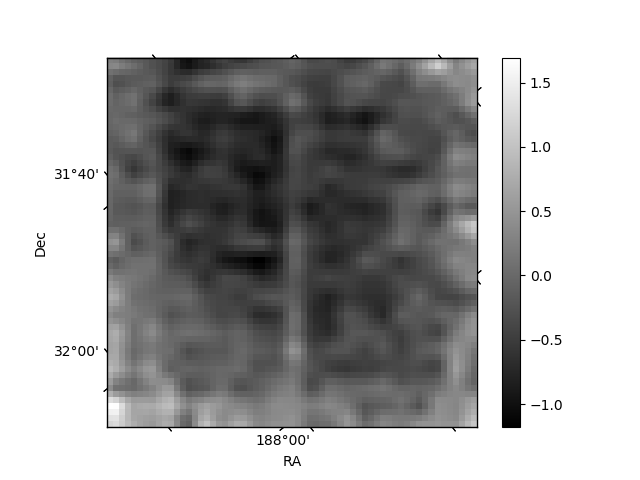
| Plot type | Count rate plots | Images |
|---|---|---|
| Comparison with Poisson distribution Blue bars denote a histogram of data divided into 1 sec bins. Red curve is a Poisson curve with rate = median count rate of data. |
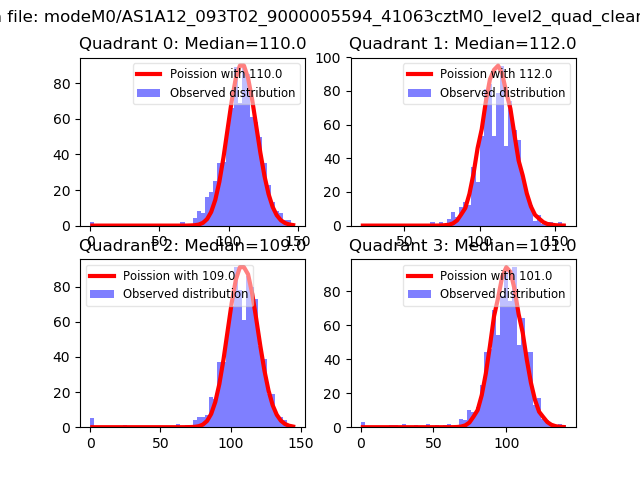 |
 |
| Quadrant-wise count rates Data is divided into 100 sec bins |
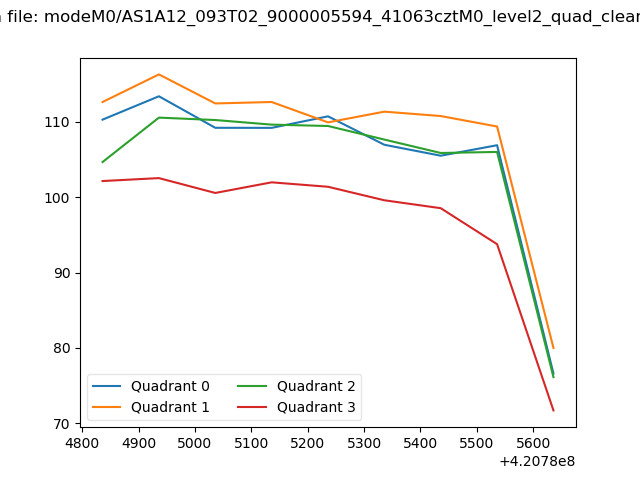 |
|
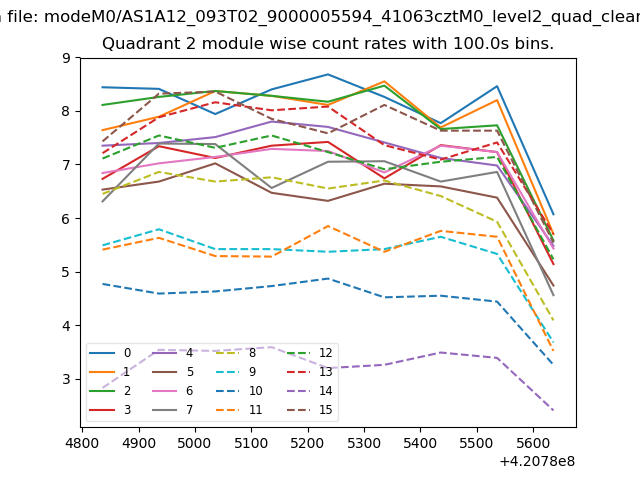
| Module-wise count rates for Quadrant A Data is divided into 100 sec bins |
 |
 |
| Module-wise count rates for Quadrant B Data is divided into 100 sec bins |
 |
 |
| Module-wise count rates for Quadrant C Data is divided into 100 sec bins |
 |
 |
| Module-wise count rates for Quadrant D Data is divided into 100 sec bins |
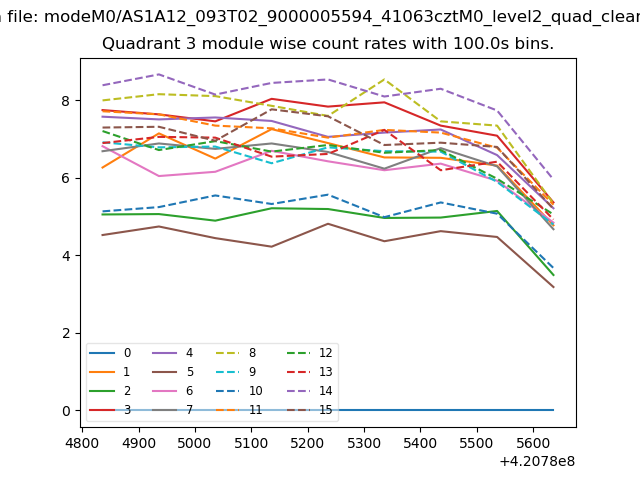 |
 |
| Parameter | Plot |
|---|---|
| CZT HV Monitor | 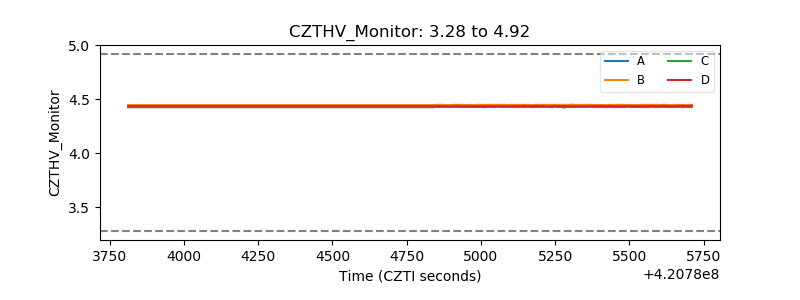 |
| D_VDD | 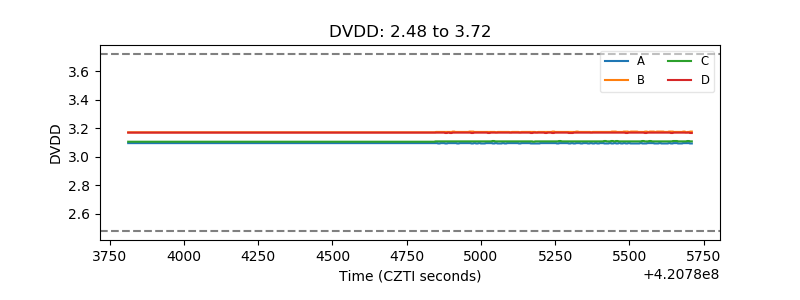 |
| Temperature 1 | 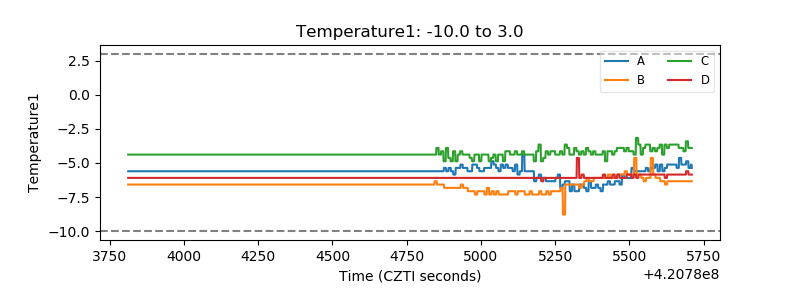 |
| Veto HV Monitor | 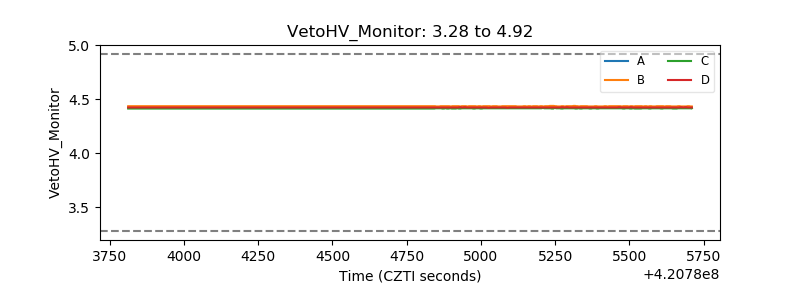 |
| Veto LLD | 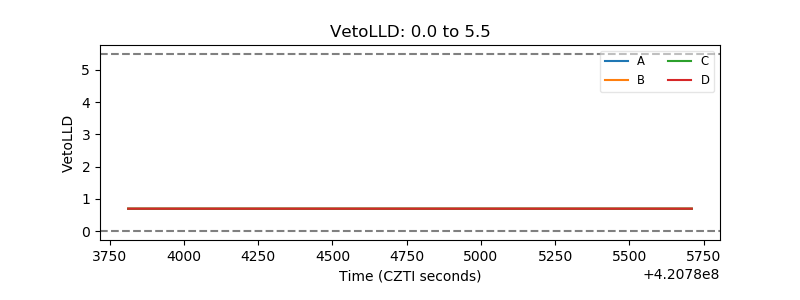 |
| Alpha Counter | 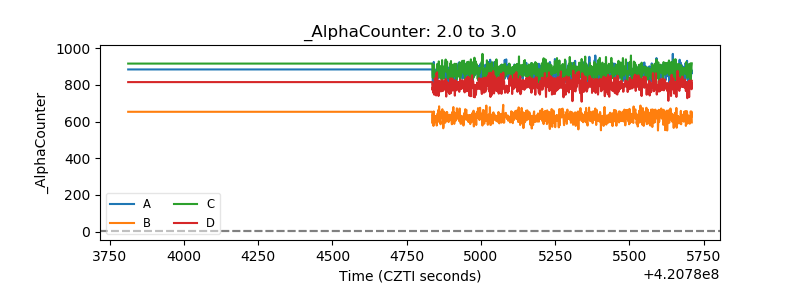 |
| _CPM_Rate | 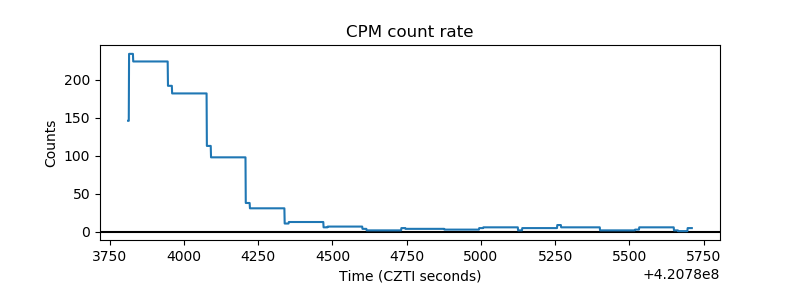 |
| CZT Counter | 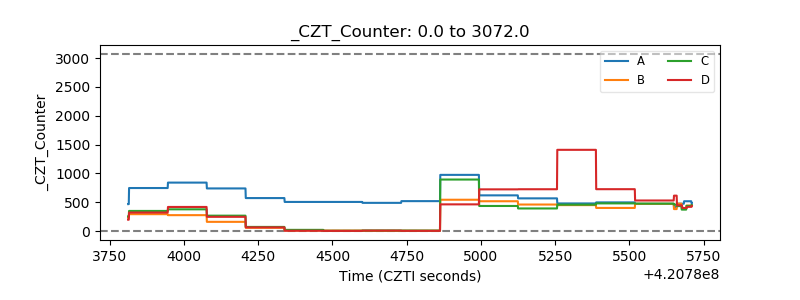 |
| +2.5 Volts monitor |  |
| +5 Volts monitor | 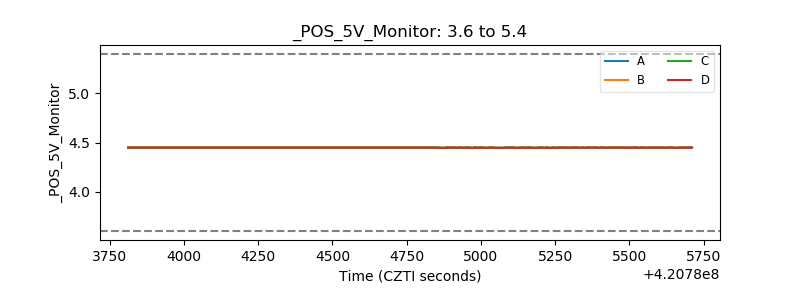 |
| _ROLL_ROT | 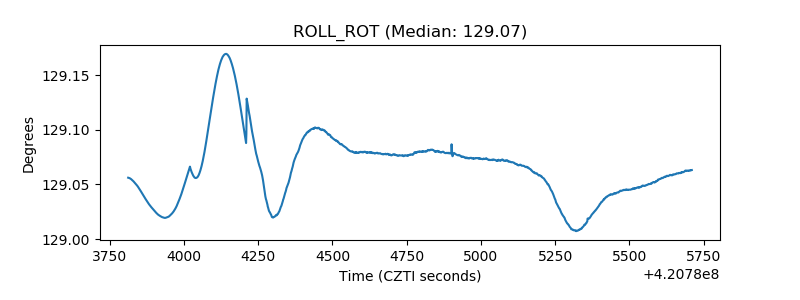 |
| _Roll_DEC | 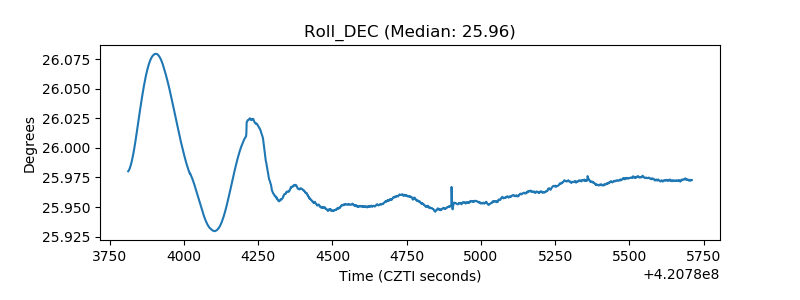 |
| _Roll_RA | 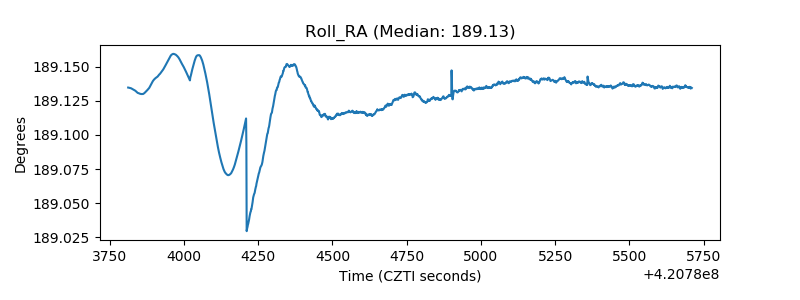 |
| Veto Counter | 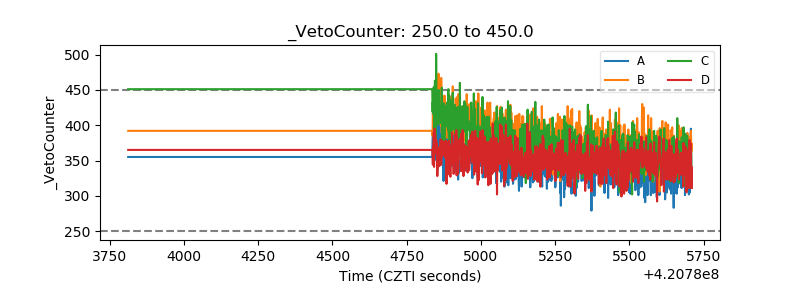 |