| Param | Original file | Final file |
|---|---|---|
| Filename | modeM0/AS1A12_093T02_9000005594_41066cztM0_level2.fits | modeM0/AS1A12_093T02_9000005594_41066cztM0_level2_quad_clean.evt |
| Size (bytes) | 346,403,520 | 95,428,800 |
| Size | 330.4 MB | 91.0 MB |
| Events in quadrant A | 3,118,073 | 643,037 |
| Events in quadrant B | 2,633,375 | 666,532 |
| Events in quadrant C | 2,807,684 | 622,949 |
| Events in quadrant D | 3,828,052 | 565,744 |
| Mode M0 | |||
|---|---|---|---|
| Quadrant | BADHDUFLAG | Total packets | Discarded packets |
| A | 0 | 12592 | 3 |
| B | 0 | 11465 | 2 |
| C | 0 | 11591 | 2 |
| D | 0 | 15165 | 2 |
| Mode SS | |||
|---|---|---|---|
| Quadrant | BADHDUFLAG | Total packets | Discarded packets |
| A | 0 | 116 | 0 |
| B | 0 | 116 | 0 |
| C | 0 | 116 | 0 |
| D | 0 | 116 | 0 |
| Mode M9 | |||
|---|---|---|---|
| Quadrant | BADHDUFLAG | Total packets | Discarded packets |
| A | 0 | 34 | 0 |
| B | 0 | 34 | 0 |
| C | 0 | 34 | 0 |
| D | 0 | 34 | 0 |
| Quadrant | Total seconds | Saturated seconds | Saturation percentage |
|---|---|---|---|
| A | 5594 | 20 | 0.357526% |
| B | 5594 | 9 | 0.160887% |
| C | 5594 | 20 | 0.357526% |
| D | 5594 | 168 | 3.003218% |
Noise dominated data is calculated using 1-second bins in cleaned event files. If a bin has >2000 counts, and if more than 50% of those come from <1% of pixels, then it is considered to be noise-dominated and hence unusable.
| Quadrant | # 1 sec bins | Bins with >0 counts | Bins with >2000 counts | High rate bins dominated by noise | Noise dominated (total time) | Noise dominated (detector-on time) | Marked lightcurve |
|---|---|---|---|---|---|---|---|
| A | 9030 | 5596 | 6 | 6 | 0.07% | 0.11% | 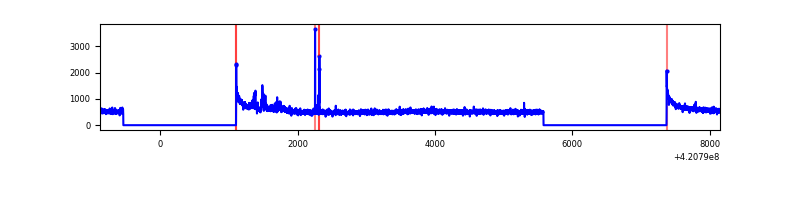 |
| B | 9030 | 5596 | 0 | 0 | 0.00% | 0.00% | 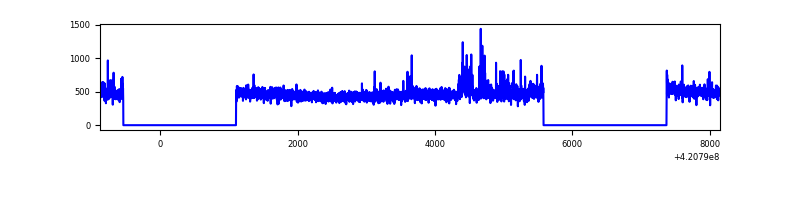 |
| C | 9030 | 5596 | 8 | 8 | 0.09% | 0.14% | 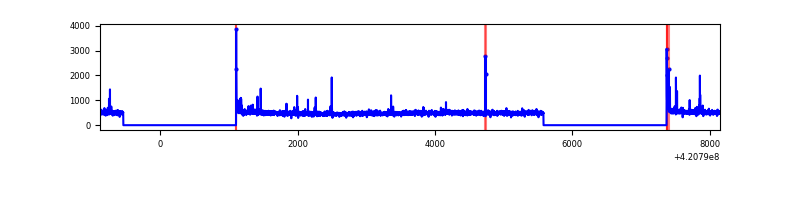 |
| D | 9030 | 5596 | 171 | 171 | 1.89% | 3.06% | 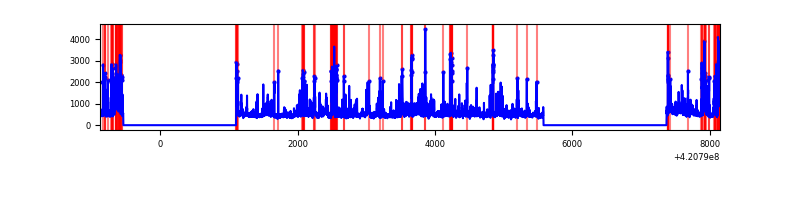 |
Top three noisy pixels from each quadrant. If the there are fewer than three noisy pixels in the level2.evt file, extra rows are filled as -1
| Pixel properties | Quadrant properties | ||||||
|---|---|---|---|---|---|---|---|
| Quadrant | DetID | PixID | Counts | Sigma | Mean | Median | Sigma |
| A | 10 | 83 | 511049 | 3809.36 | 647 | 633 | 134.0 |
| A | 12 | 189 | 79945 | 591.93 | 647 | 633 | 134.0 |
| A | 13 | 248 | 20623 | 149.19 | 647 | 633 | 134.0 |
| B | 0 | 190 | 83122 | 660.75 | 643 | 625 | 124.9 |
| B | 15 | 32 | 26203 | 204.86 | 643 | 625 | 124.9 |
| B | 12 | 111 | 15939 | 122.66 | 643 | 625 | 124.9 |
| C | 15 | 214 | 243097 | 1642.49 | 628 | 632 | 147.6 |
| C | 14 | 254 | 70910 | 476.07 | 628 | 632 | 147.6 |
| C | 0 | 10 | 38488 | 256.44 | 628 | 632 | 147.6 |
| D | 12 | 79 | 471624 | 3088.4 | 620 | 602 | 152.5 |
| D | 2 | 249 | 372427 | 2437.99 | 620 | 602 | 152.5 |
| D | 2 | 16 | 258950 | 1693.94 | 620 | 602 | 152.5 |
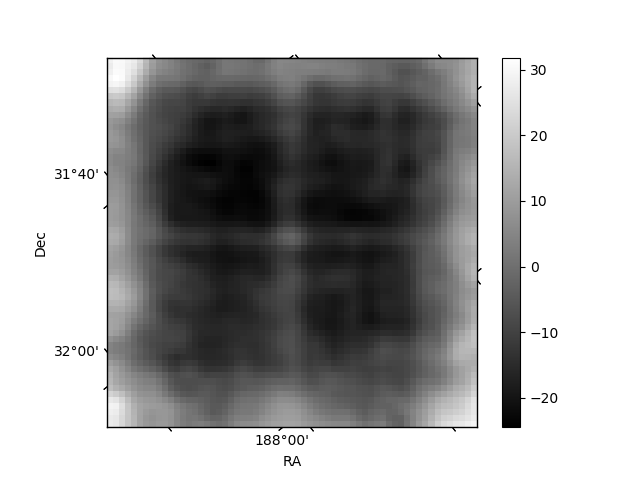
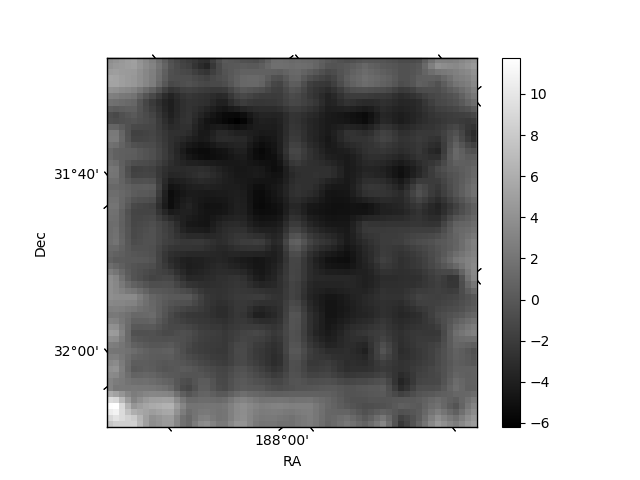
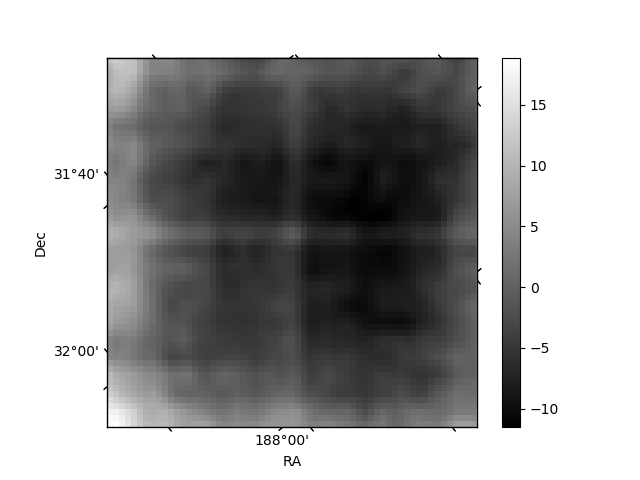
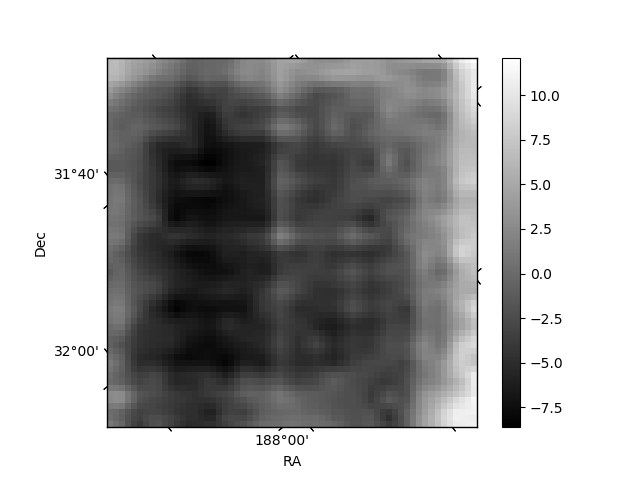
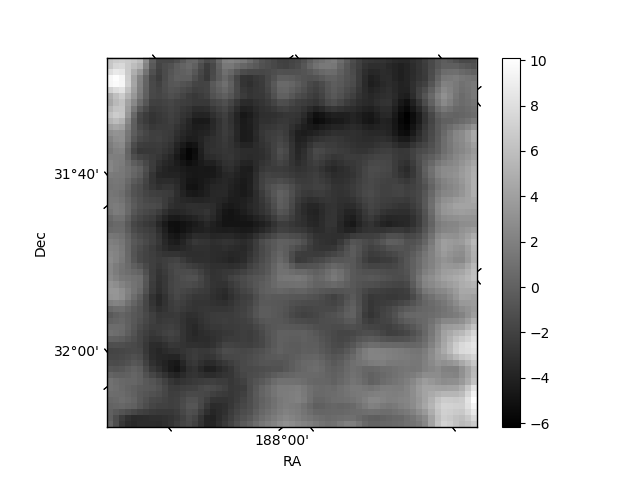
Histogram calculated using DETX and DETY for each event in the final _common_clean file
| Quadrant A | 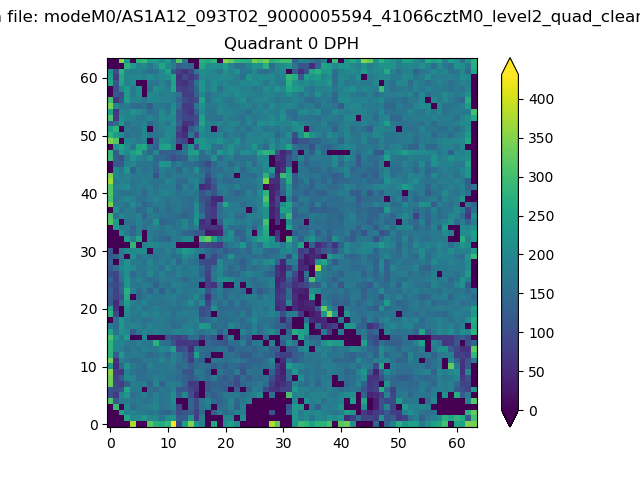 |
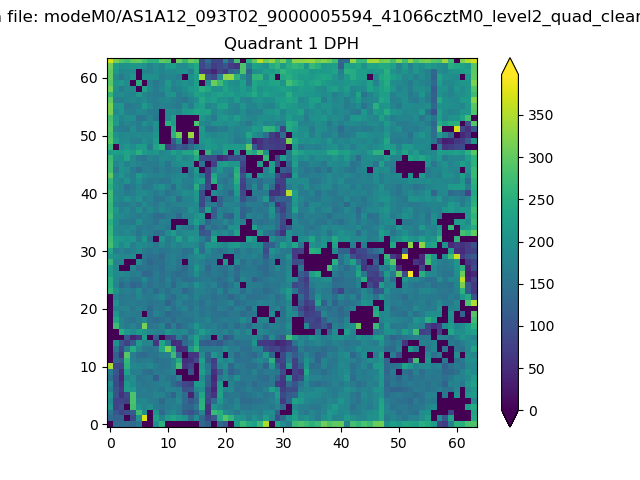 |
Quadrant B |
|---|---|---|---|
| Quadrant D | 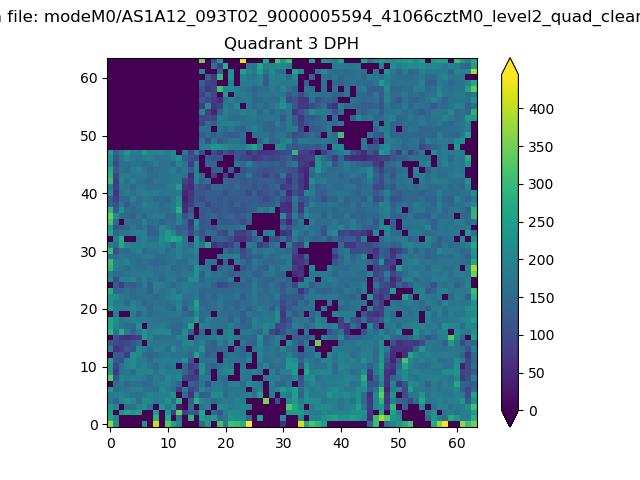 |
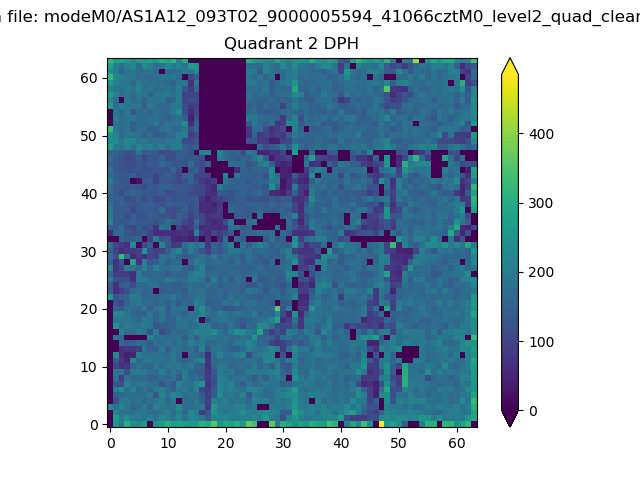 |
Quadrant C |
| Plot type | Count rate plots | Images |
|---|---|---|
| Comparison with Poisson distribution Blue bars denote a histogram of data divided into 1 sec bins. Red curve is a Poisson curve with rate = median count rate of data. |
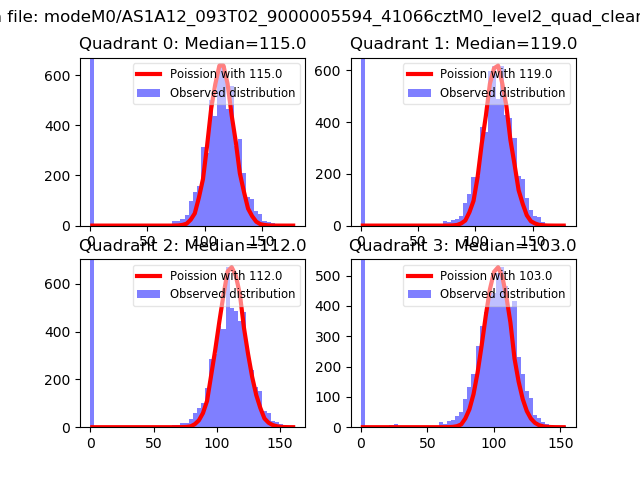 |
 |
| Quadrant-wise count rates Data is divided into 100 sec bins |
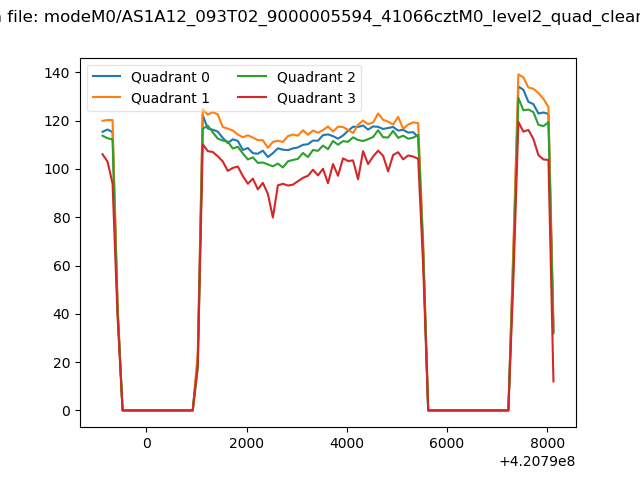 |
|
| Module-wise count rates for Quadrant A Data is divided into 100 sec bins |
 |
 |
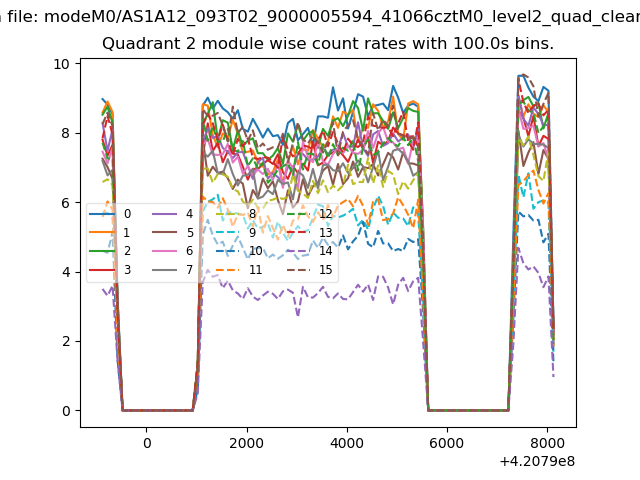
| Module-wise count rates for Quadrant B Data is divided into 100 sec bins |
 |
 |
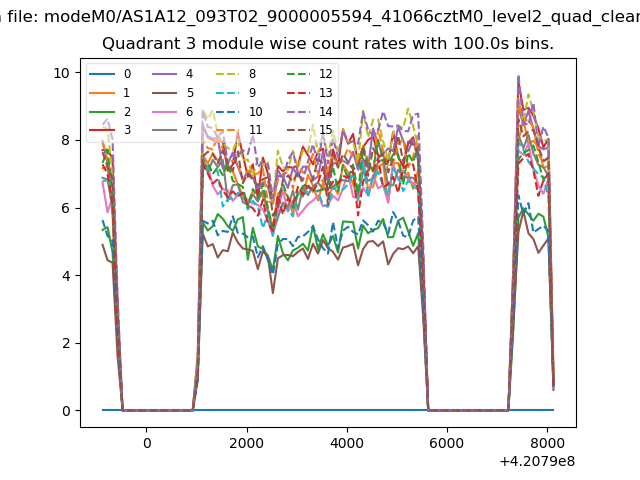
| Module-wise count rates for Quadrant C Data is divided into 100 sec bins |
 |
 |
| Module-wise count rates for Quadrant D Data is divided into 100 sec bins |
 |
 |
| Parameter | Plot |
|---|---|
| CZT HV Monitor | 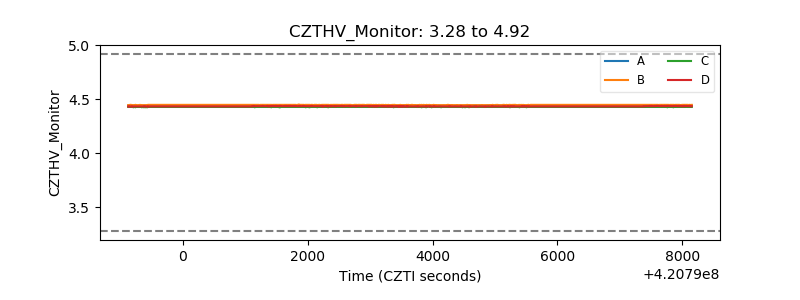 |
| D_VDD | 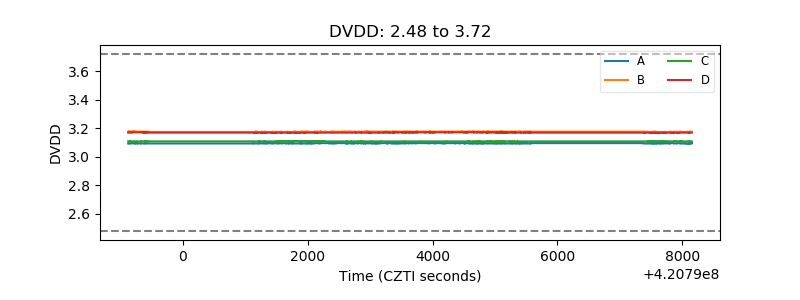 |
| Temperature 1 | 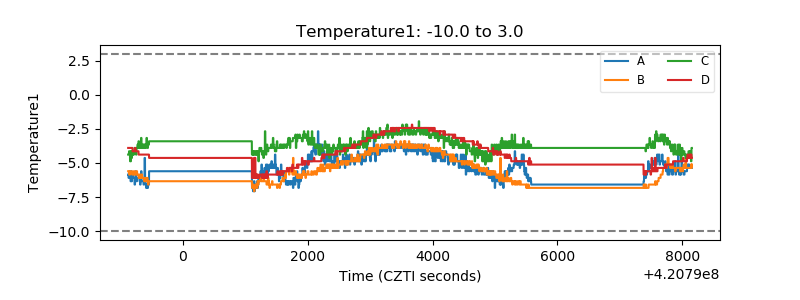 |
| Veto HV Monitor | 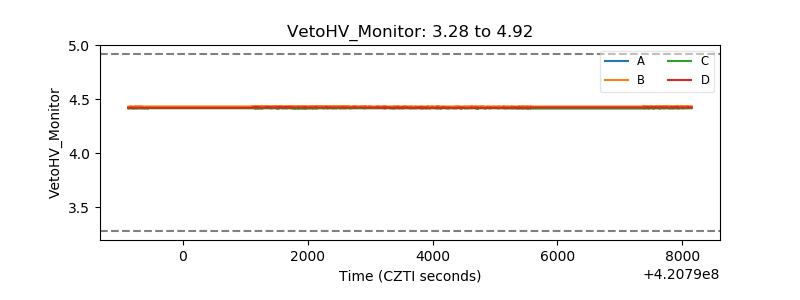 |
| Veto LLD | 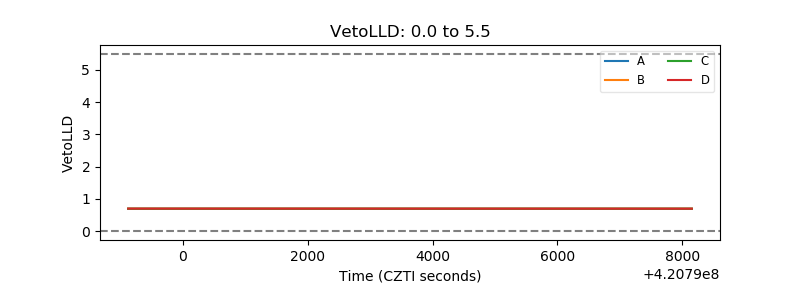 |
| Alpha Counter | 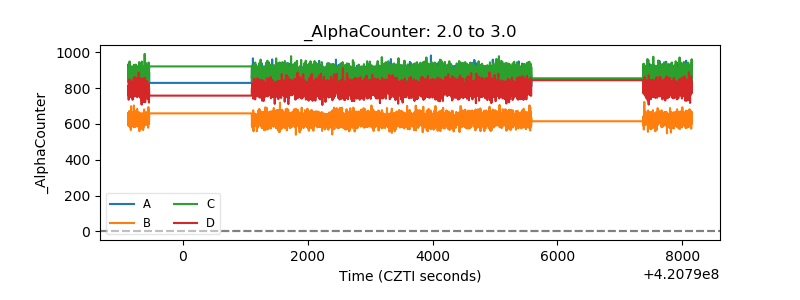 |
| _CPM_Rate | 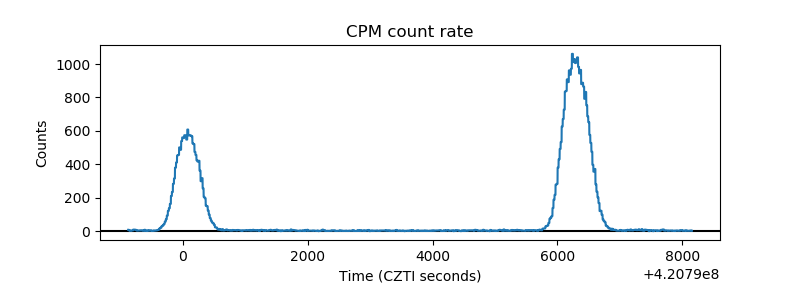 |
| CZT Counter | 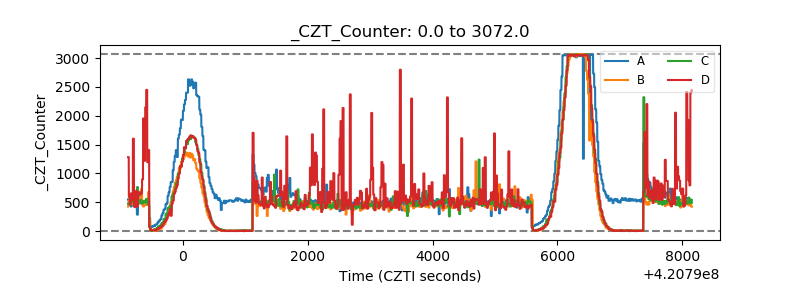 |
| +2.5 Volts monitor |  |
| +5 Volts monitor | 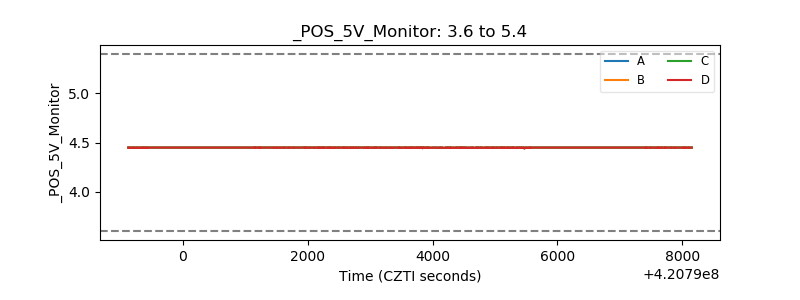 |
| _ROLL_ROT | 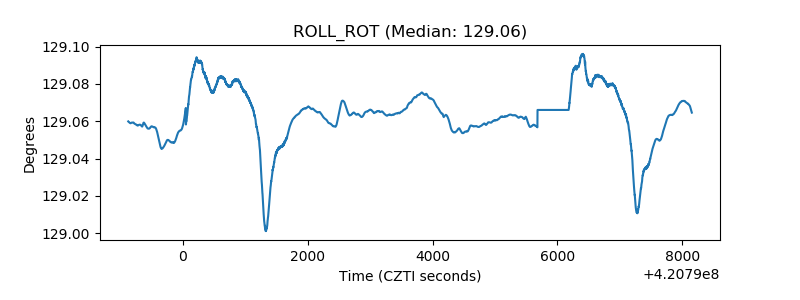 |
| _Roll_DEC | 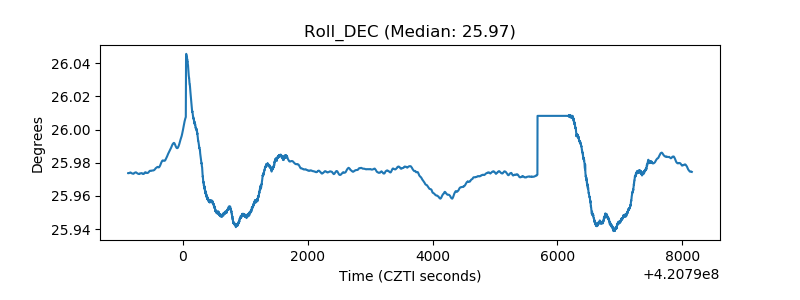 |
| _Roll_RA | 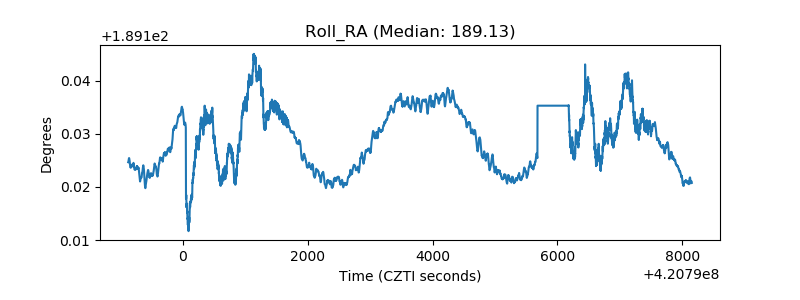 |
| Veto Counter | 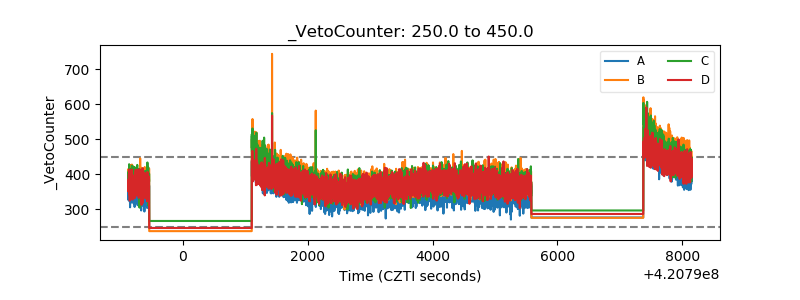 |