| Param | Original file | Final file |
|---|---|---|
| Filename | modeM0/AS1A12_093T02_9000005594_41068cztM0_level2.fits | modeM0/AS1A12_093T02_9000005594_41068cztM0_level2_quad_clean.evt |
| Size (bytes) | 361,618,560 | 105,946,560 |
| Size | 344.9 MB | 101.0 MB |
| Events in quadrant A | 3,414,355 | 728,019 |
| Events in quadrant B | 2,823,963 | 749,078 |
| Events in quadrant C | 3,032,476 | 696,807 |
| Events in quadrant D | 3,671,271 | 635,730 |
| Mode M0 | |||
|---|---|---|---|
| Quadrant | BADHDUFLAG | Total packets | Discarded packets |
| A | 0 | 13569 | 3 |
| B | 0 | 11701 | 2 |
| C | 0 | 12182 | 2 |
| D | 0 | 14603 | 2 |
| Mode SS | |||
|---|---|---|---|
| Quadrant | BADHDUFLAG | Total packets | Discarded packets |
| A | 0 | 118 | 0 |
| B | 0 | 118 | 0 |
| C | 0 | 118 | 0 |
| D | 0 | 118 | 0 |
| Mode M9 | |||
|---|---|---|---|
| Quadrant | BADHDUFLAG | Total packets | Discarded packets |
| A | 0 | 39 | 0 |
| B | 0 | 39 | 0 |
| C | 0 | 39 | 0 |
| D | 0 | 39 | 0 |
| Quadrant | Total seconds | Saturated seconds | Saturation percentage |
|---|---|---|---|
| A | 5703 | 52 | 0.911801% |
| B | 5703 | 13 | 0.227950% |
| C | 5703 | 33 | 0.578643% |
| D | 5703 | 166 | 2.910749% |
Noise dominated data is calculated using 1-second bins in cleaned event files. If a bin has >2000 counts, and if more than 50% of those come from <1% of pixels, then it is considered to be noise-dominated and hence unusable.
| Quadrant | # 1 sec bins | Bins with >0 counts | Bins with >2000 counts | High rate bins dominated by noise | Noise dominated (total time) | Noise dominated (detector-on time) | Marked lightcurve |
|---|---|---|---|---|---|---|---|
| A | 9589 | 5705 | 28 | 28 | 0.29% | 0.49% | 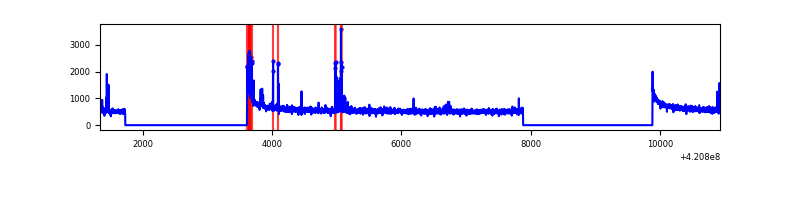 |
| B | 9589 | 5705 | 5 | 5 | 0.05% | 0.09% | 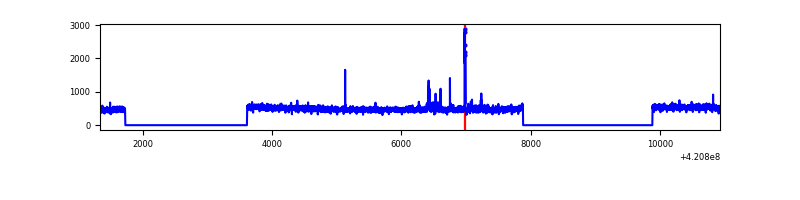 |
| C | 9589 | 5705 | 17 | 17 | 0.18% | 0.30% | 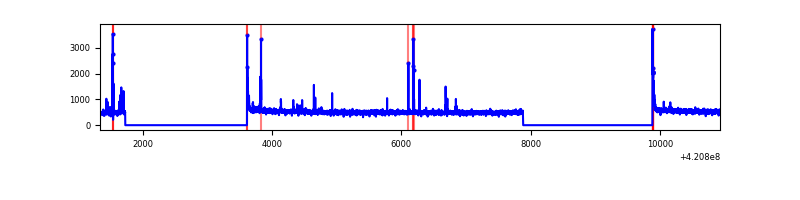 |
| D | 9589 | 5705 | 131 | 131 | 1.37% | 2.30% | 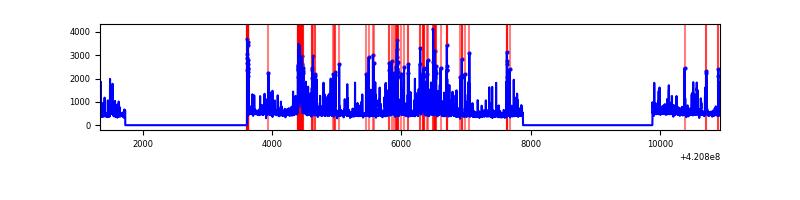 |
Top three noisy pixels from each quadrant. If the there are fewer than three noisy pixels in the level2.evt file, extra rows are filled as -1
| Pixel properties | Quadrant properties | ||||||
|---|---|---|---|---|---|---|---|
| Quadrant | DetID | PixID | Counts | Sigma | Mean | Median | Sigma |
| A | 10 | 83 | 511155 | 3604.39 | 703 | 692 | 141.6 |
| A | 13 | 248 | 150785 | 1059.81 | 703 | 692 | 141.6 |
| A | 12 | 189 | 17143 | 116.16 | 703 | 692 | 141.6 |
| B | 0 | 229 | 47585 | 353.07 | 691 | 673 | 132.9 |
| B | 0 | 190 | 40691 | 301.19 | 691 | 673 | 132.9 |
| B | 15 | 32 | 26294 | 192.83 | 691 | 673 | 132.9 |
| C | 15 | 214 | 244383 | 1554.54 | 676 | 681 | 156.8 |
| C | 14 | 254 | 85096 | 538.47 | 676 | 681 | 156.8 |
| C | 0 | 10 | 67756 | 427.86 | 676 | 681 | 156.8 |
| D | 2 | 16 | 378308 | 2300.05 | 674 | 657 | 164.2 |
| D | 2 | 249 | 257837 | 1566.33 | 674 | 657 | 164.2 |
| D | 12 | 79 | 206778 | 1255.36 | 674 | 657 | 164.2 |
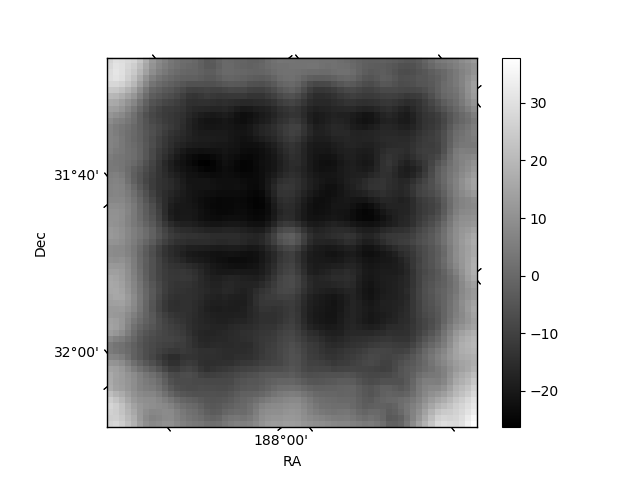
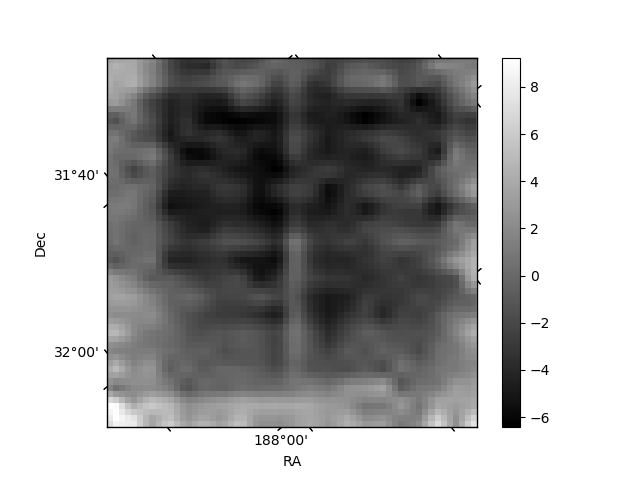
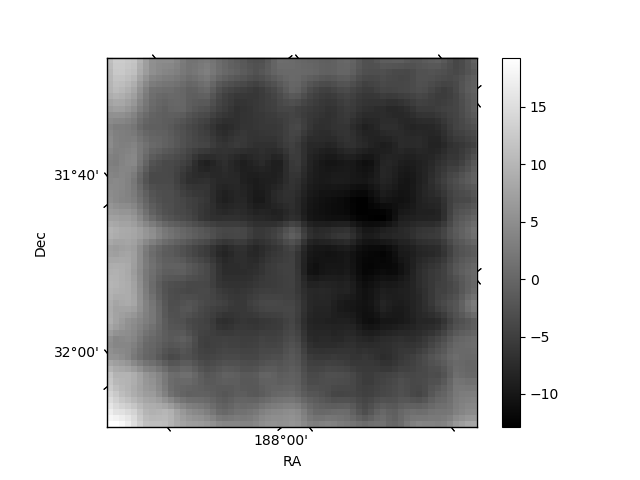
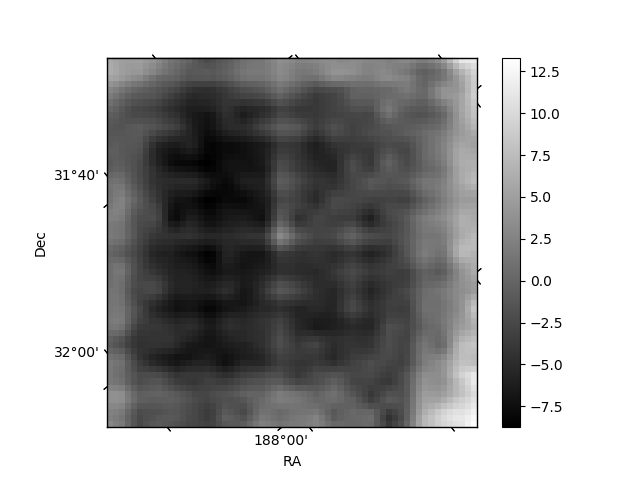
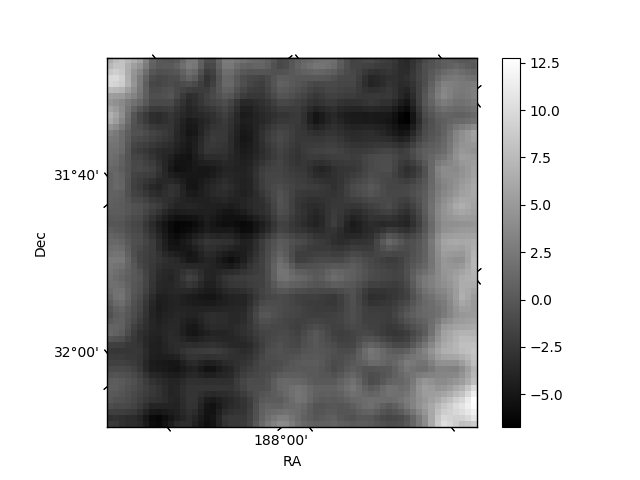
Histogram calculated using DETX and DETY for each event in the final _common_clean file
| Quadrant A | 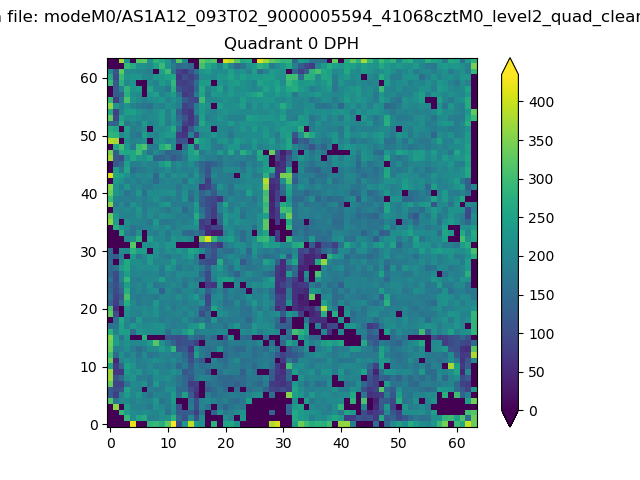 |
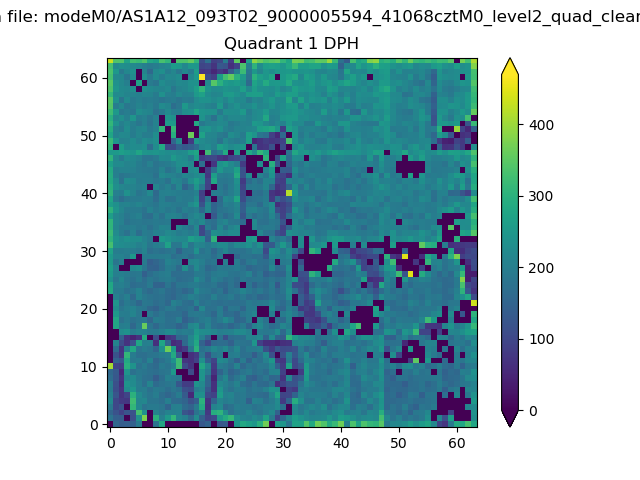 |
Quadrant B |
|---|---|---|---|
| Quadrant D | 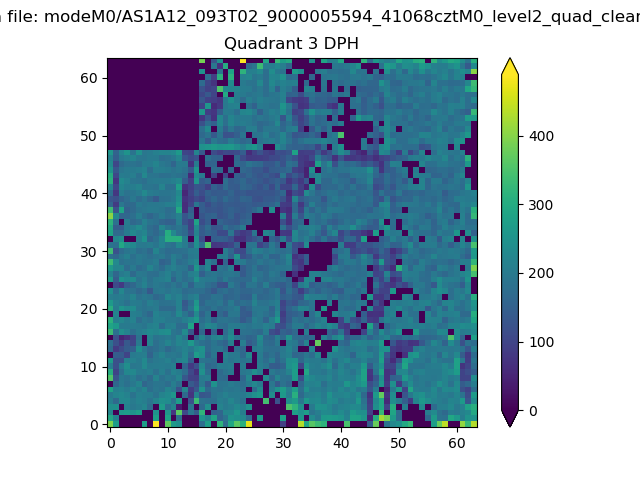 |
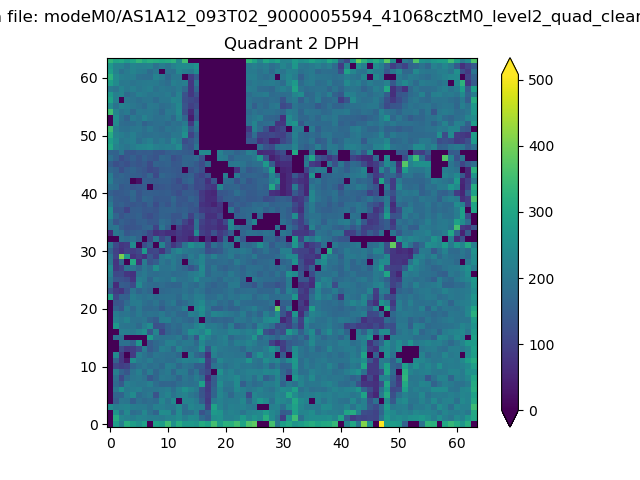 |
Quadrant C |
| Plot type | Count rate plots | Images |
|---|---|---|
| Comparison with Poisson distribution Blue bars denote a histogram of data divided into 1 sec bins. Red curve is a Poisson curve with rate = median count rate of data. |
 |
 |
| Quadrant-wise count rates Data is divided into 100 sec bins |
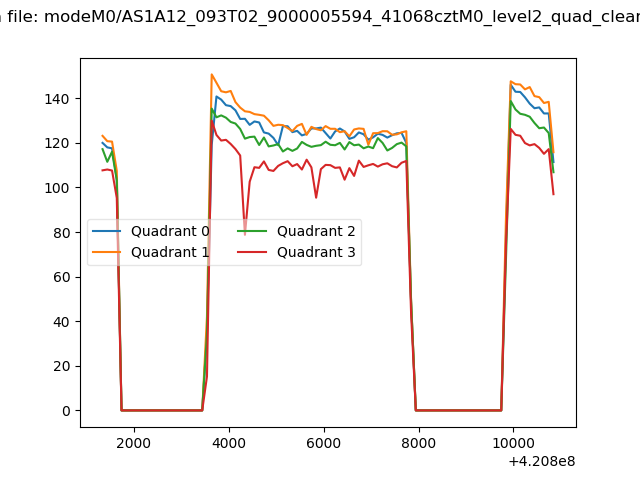 |
|
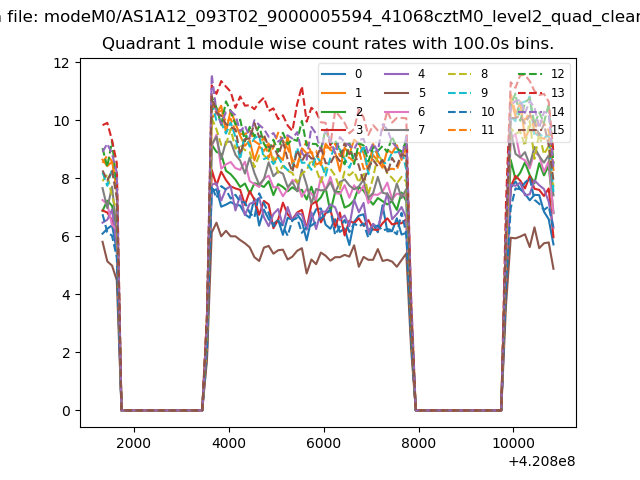
| Module-wise count rates for Quadrant A Data is divided into 100 sec bins |
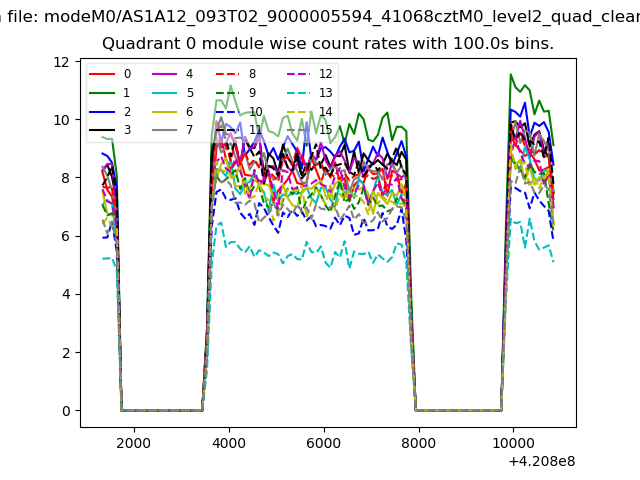 |
 |
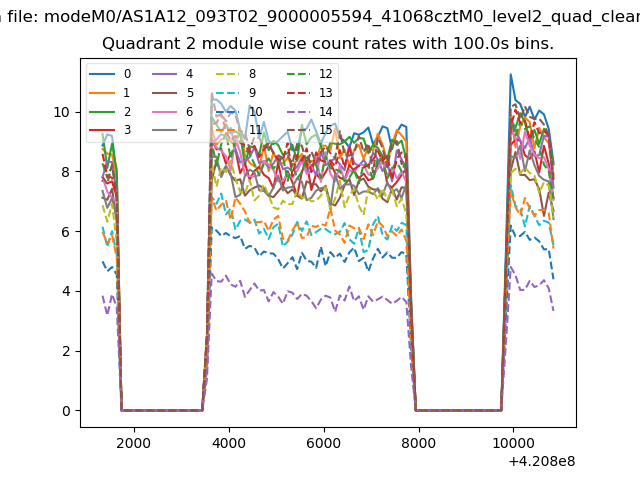
| Module-wise count rates for Quadrant B Data is divided into 100 sec bins |
 |
 |
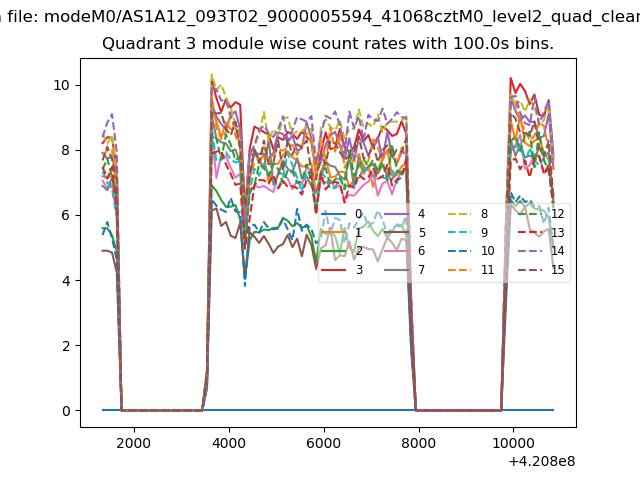
| Module-wise count rates for Quadrant C Data is divided into 100 sec bins |
 |
 |
| Module-wise count rates for Quadrant D Data is divided into 100 sec bins |
 |
 |
| Parameter | Plot |
|---|---|
| CZT HV Monitor | 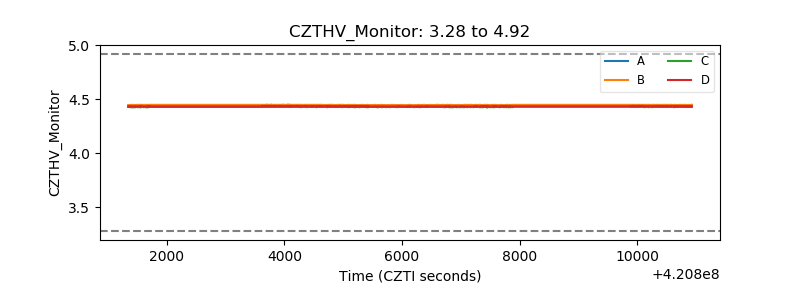 |
| D_VDD | 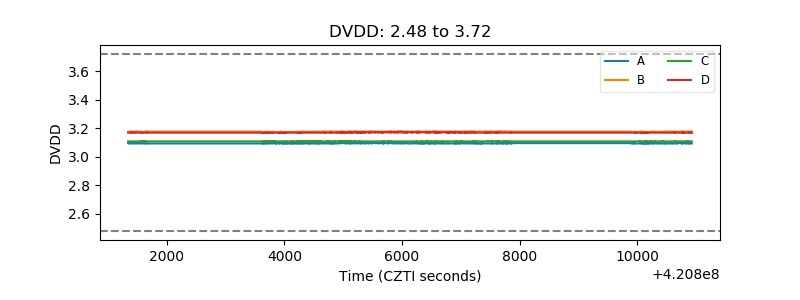 |
| Temperature 1 | 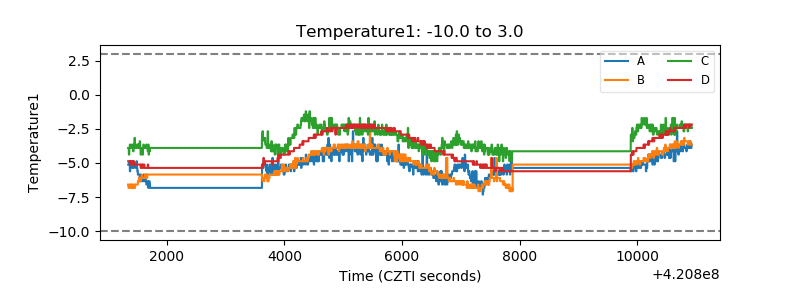 |
| Veto HV Monitor | 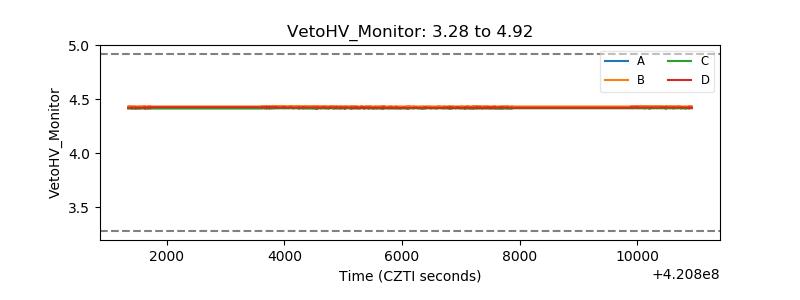 |
| Veto LLD | 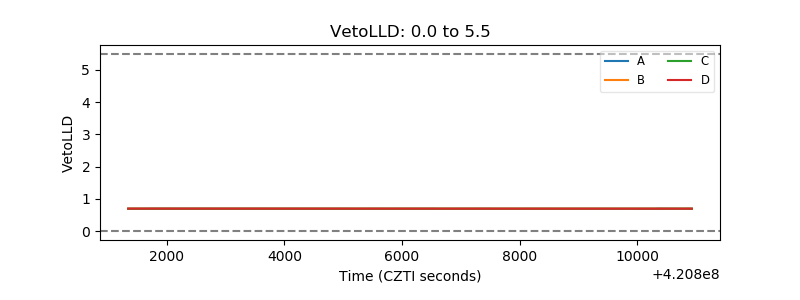 |
| Alpha Counter | 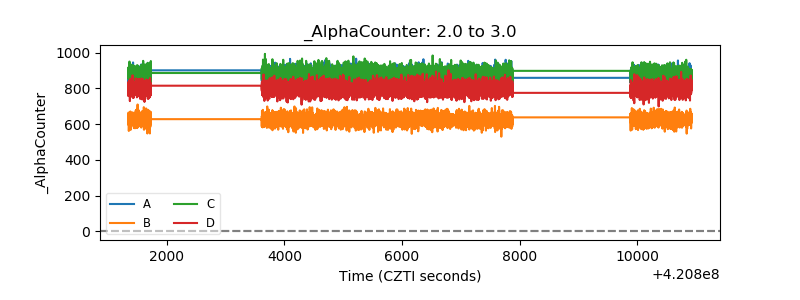 |
| _CPM_Rate | 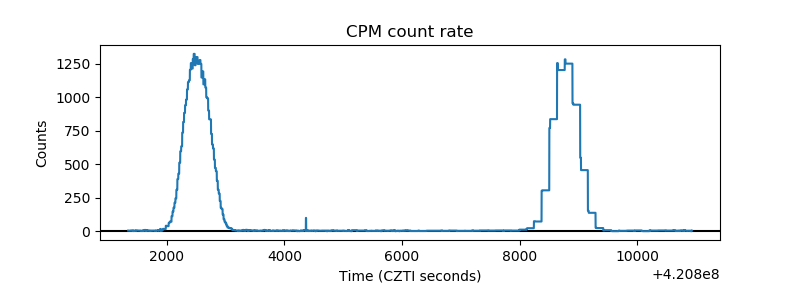 |
| CZT Counter | 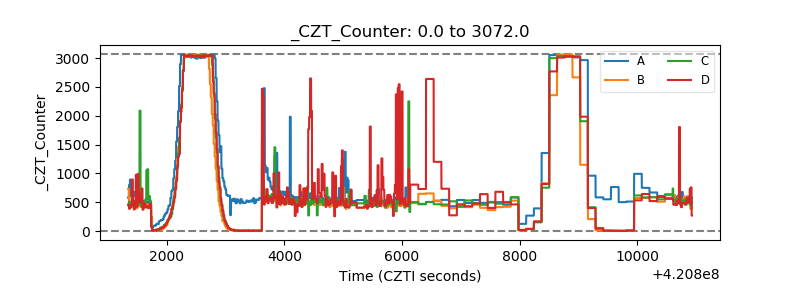 |
| +2.5 Volts monitor |  |
| +5 Volts monitor |  |
| _ROLL_ROT |  |
| _Roll_DEC | 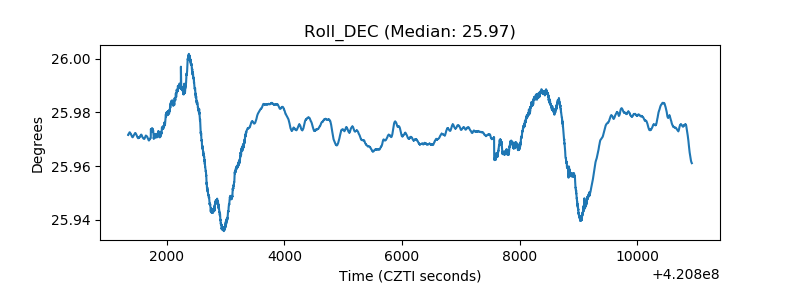 |
| _Roll_RA | 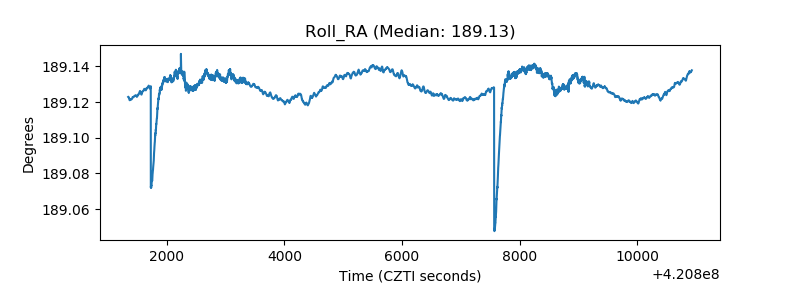 |
| Veto Counter | 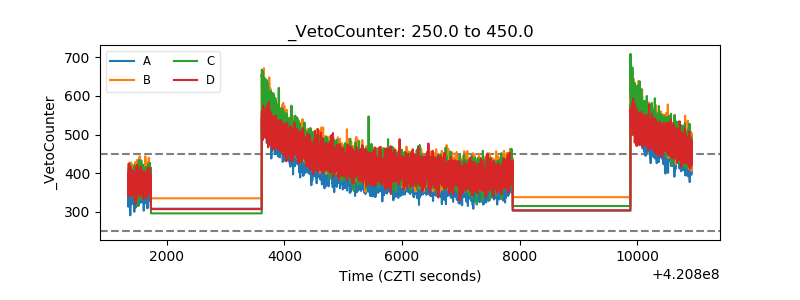 |