| Param | Original file | Final file |
|---|---|---|
| Filename | modeM0/AS1A12_093T02_9000005594_41069cztM0_level2.fits | modeM0/AS1A12_093T02_9000005594_41069cztM0_level2_quad_clean.evt |
| Size (bytes) | 331,585,920 | 98,187,840 |
| Size | 316.2 MB | 93.6 MB |
| Events in quadrant A | 3,063,357 | 679,446 |
| Events in quadrant B | 2,799,046 | 691,600 |
| Events in quadrant C | 2,794,838 | 642,773 |
| Events in quadrant D | 3,208,088 | 591,763 |
| Mode M0 | |||
|---|---|---|---|
| Quadrant | BADHDUFLAG | Total packets | Discarded packets |
| A | 0 | 12317 | 3 |
| B | 0 | 11312 | 2 |
| C | 0 | 11216 | 2 |
| D | 0 | 12960 | 2 |
| Mode SS | |||
|---|---|---|---|
| Quadrant | BADHDUFLAG | Total packets | Discarded packets |
| A | 0 | 108 | 0 |
| B | 0 | 108 | 0 |
| C | 0 | 108 | 0 |
| D | 0 | 108 | 0 |
| Mode M9 | |||
|---|---|---|---|
| Quadrant | BADHDUFLAG | Total packets | Discarded packets |
| A | 0 | 31 | 0 |
| B | 0 | 31 | 0 |
| C | 0 | 31 | 0 |
| D | 0 | 32 | 0 |
| Quadrant | Total seconds | Saturated seconds | Saturation percentage |
|---|---|---|---|
| A | 5250 | 15 | 0.285714% |
| B | 5250 | 10 | 0.190476% |
| C | 5250 | 48 | 0.914286% |
| D | 5250 | 130 | 2.476190% |
Noise dominated data is calculated using 1-second bins in cleaned event files. If a bin has >2000 counts, and if more than 50% of those come from <1% of pixels, then it is considered to be noise-dominated and hence unusable.
| Quadrant | # 1 sec bins | Bins with >0 counts | Bins with >2000 counts | High rate bins dominated by noise | Noise dominated (total time) | Noise dominated (detector-on time) | Marked lightcurve |
|---|---|---|---|---|---|---|---|
| A | 7343 | 5251 | 1 | 1 | 0.01% | 0.02% | 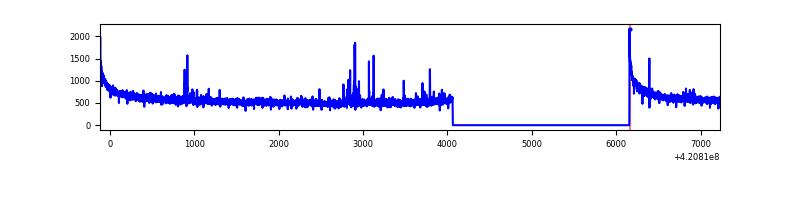 |
| B | 7343 | 5251 | 2 | 2 | 0.03% | 0.04% | 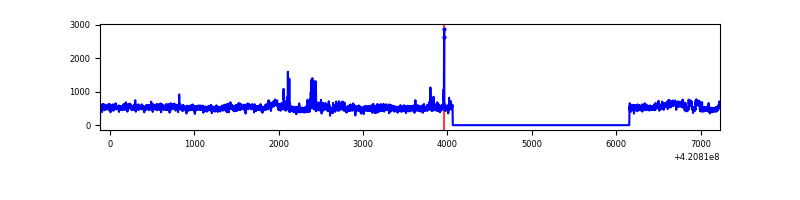 |
| C | 7343 | 5251 | 38 | 38 | 0.52% | 0.72% | 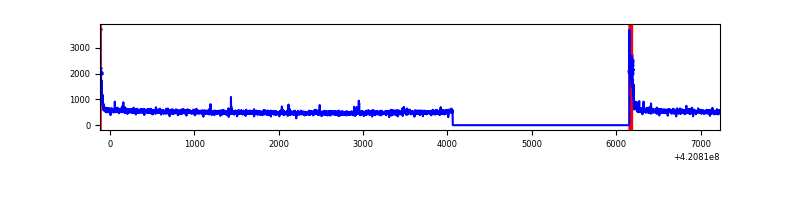 |
| D | 7343 | 5251 | 113 | 113 | 1.54% | 2.15% | 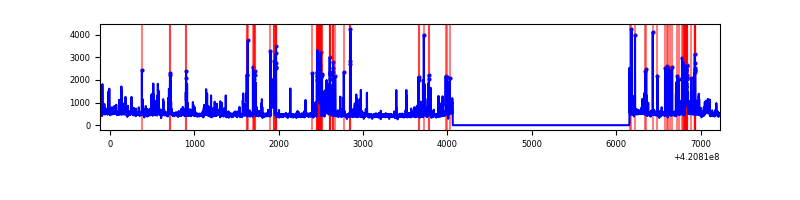 |
Top three noisy pixels from each quadrant. If the there are fewer than three noisy pixels in the level2.evt file, extra rows are filled as -1
| Pixel properties | Quadrant properties | ||||||
|---|---|---|---|---|---|---|---|
| Quadrant | DetID | PixID | Counts | Sigma | Mean | Median | Sigma |
| A | 10 | 83 | 488619 | 3760.21 | 644 | 631 | 129.8 |
| A | 13 | 248 | 38095 | 288.68 | 644 | 631 | 129.8 |
| A | 12 | 189 | 21485 | 160.69 | 644 | 631 | 129.8 |
| B | 0 | 229 | 248742 | 2050.97 | 631 | 614 | 121.0 |
| B | 15 | 32 | 37864 | 307.9 | 631 | 614 | 121.0 |
| B | 0 | 190 | 35454 | 287.98 | 631 | 614 | 121.0 |
| C | 15 | 214 | 225317 | 1558.99 | 622 | 626 | 144.1 |
| C | 0 | 10 | 128676 | 888.46 | 622 | 626 | 144.1 |
| C | 14 | 254 | 16173 | 107.87 | 622 | 626 | 144.1 |
| D | 13 | 249 | 411387 | 2726.61 | 624 | 608 | 150.7 |
| D | 2 | 16 | 179358 | 1186.48 | 624 | 608 | 150.7 |
| D | 2 | 249 | 126664 | 836.72 | 624 | 608 | 150.7 |
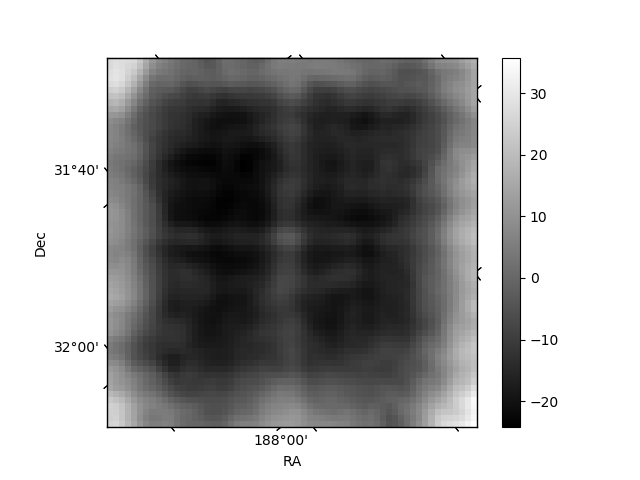
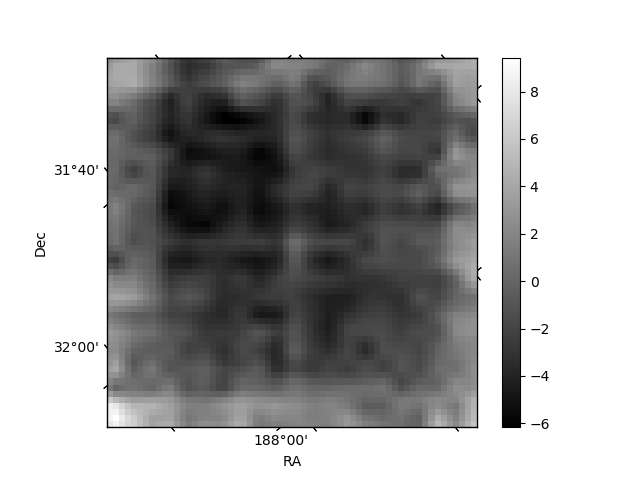
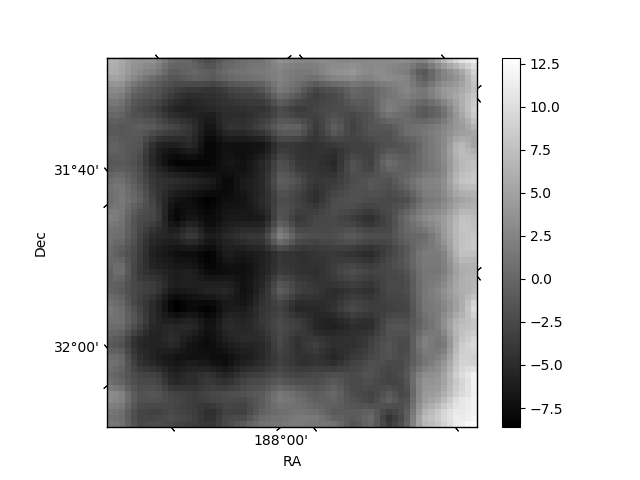
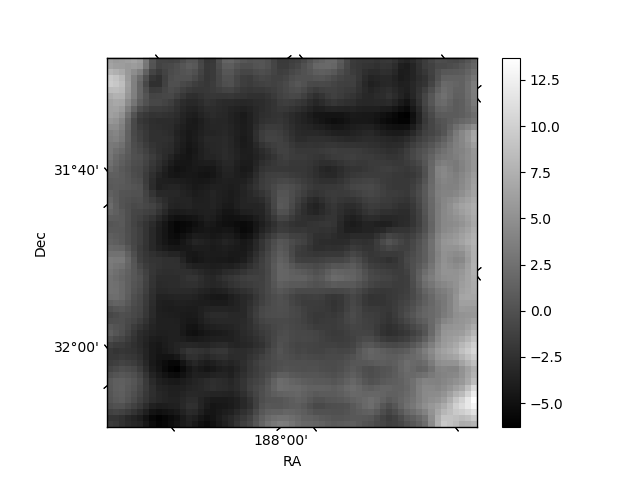
Histogram calculated using DETX and DETY for each event in the final _common_clean file
| Quadrant A | 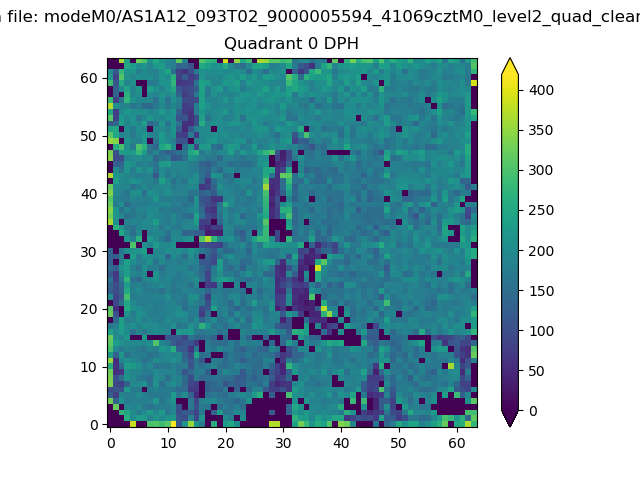 |
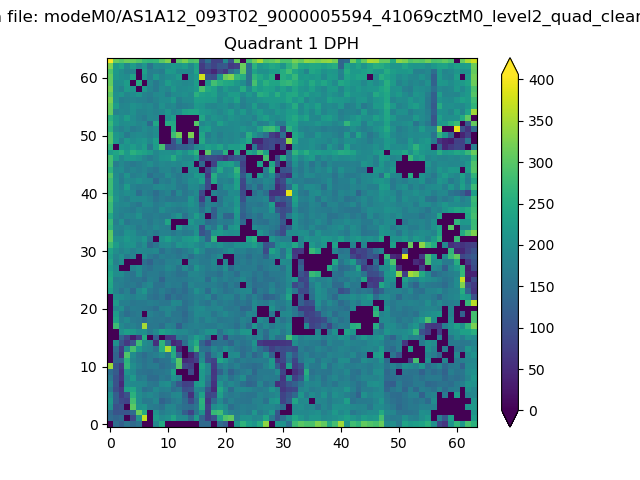 |
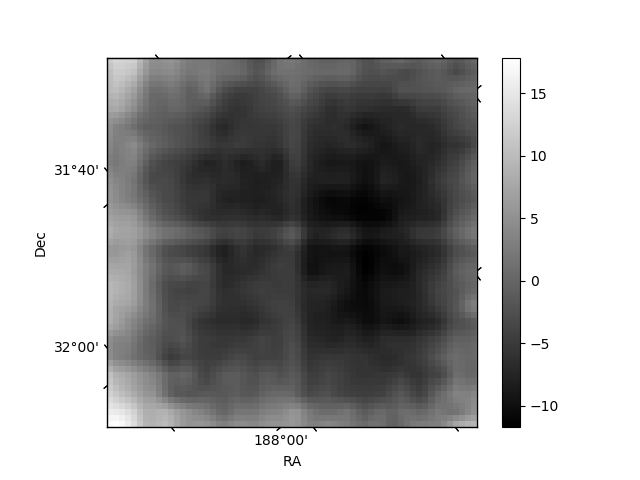
Quadrant B |
|---|---|---|---|
| Quadrant D | 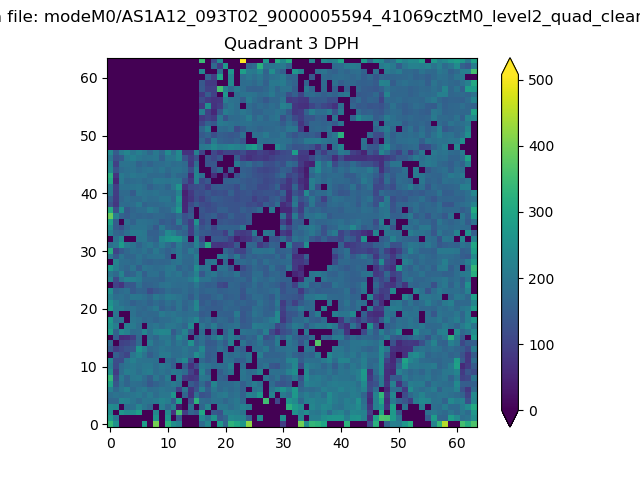 |
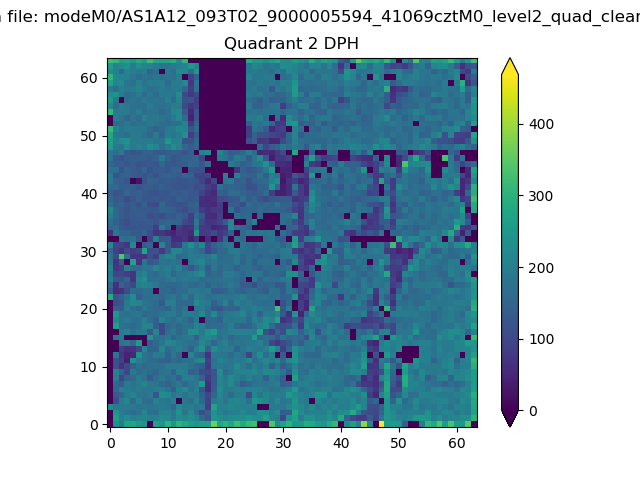 |
Quadrant C |
| Plot type | Count rate plots | Images |
|---|---|---|
| Comparison with Poisson distribution Blue bars denote a histogram of data divided into 1 sec bins. Red curve is a Poisson curve with rate = median count rate of data. |
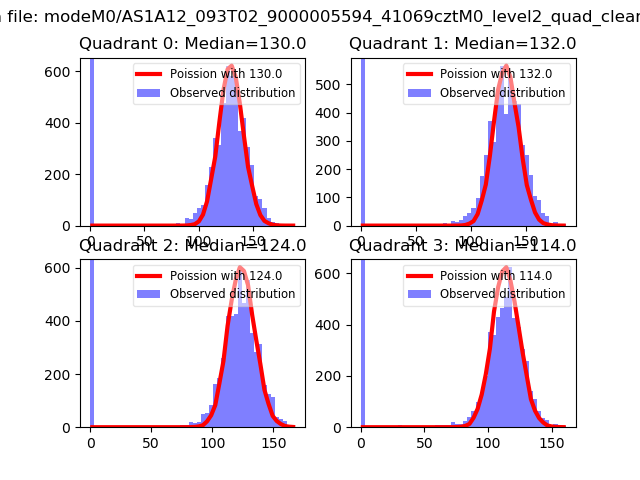 |
 |
| Quadrant-wise count rates Data is divided into 100 sec bins |
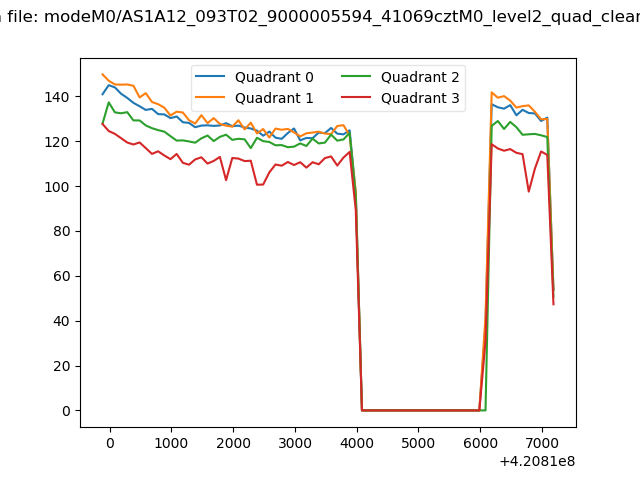 |
|
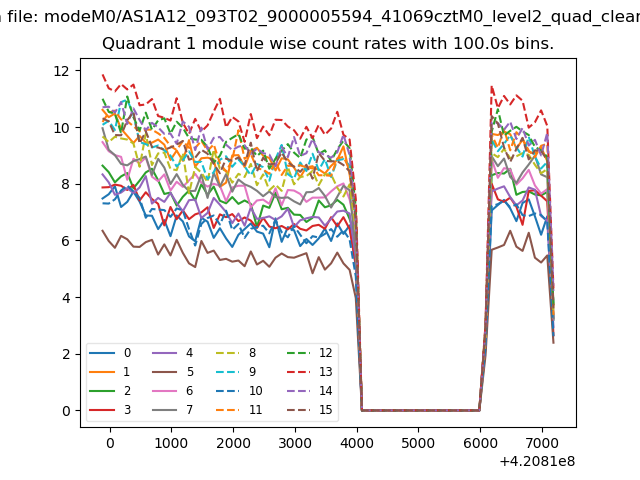
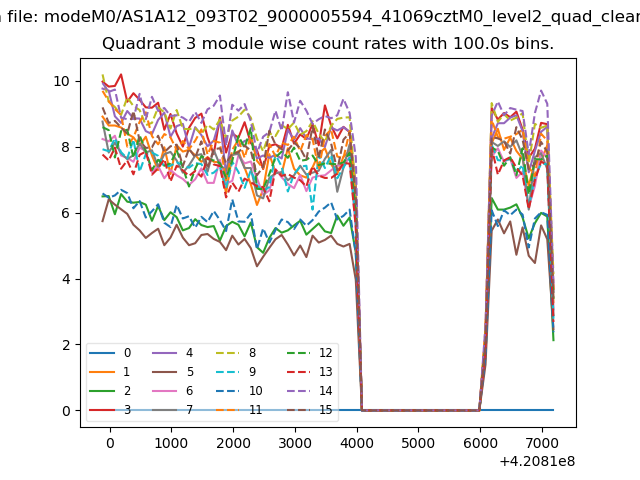
| Module-wise count rates for Quadrant A Data is divided into 100 sec bins |
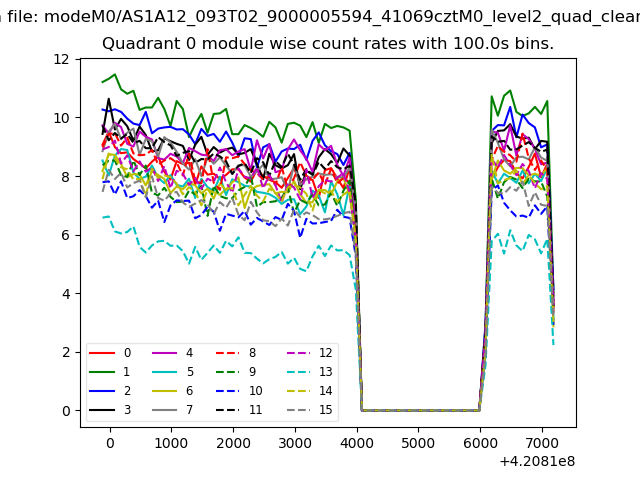 |
 |
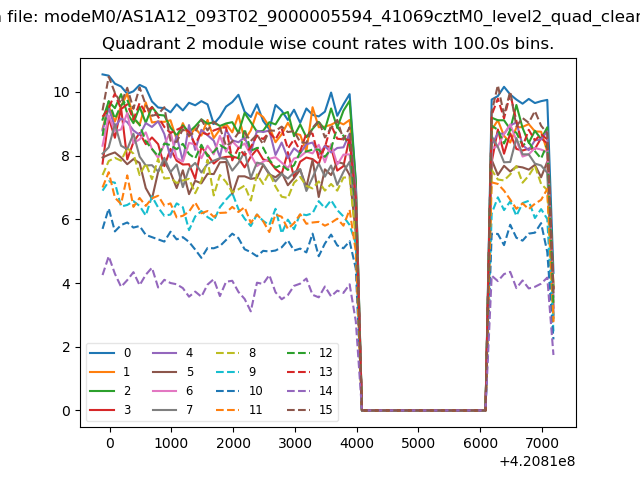
| Module-wise count rates for Quadrant B Data is divided into 100 sec bins |
 |
 |
| Module-wise count rates for Quadrant C Data is divided into 100 sec bins |
 |
 |
| Module-wise count rates for Quadrant D Data is divided into 100 sec bins |
 |
 |
| Parameter | Plot |
|---|---|
| CZT HV Monitor | 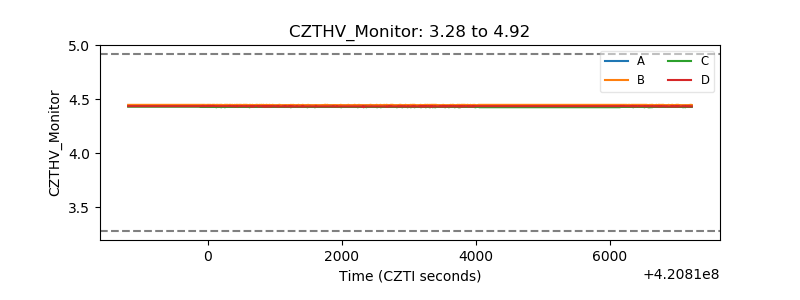 |
| D_VDD | 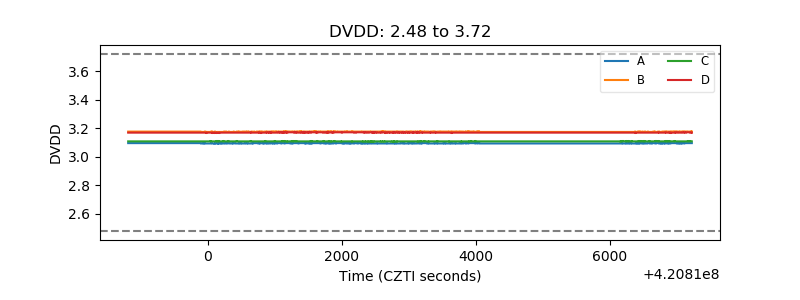 |
| Temperature 1 | 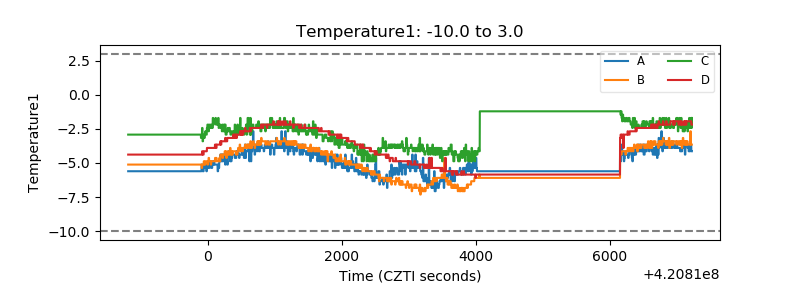 |
| Veto HV Monitor | 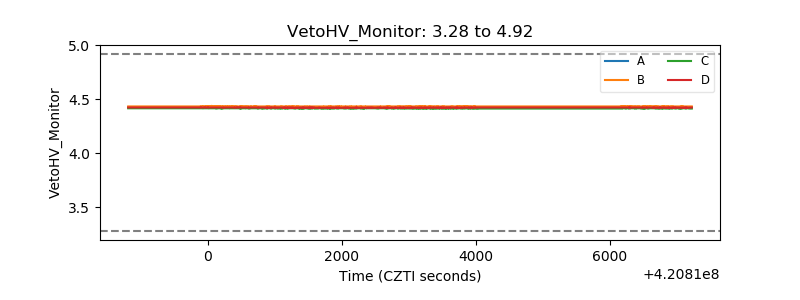 |
| Veto LLD | 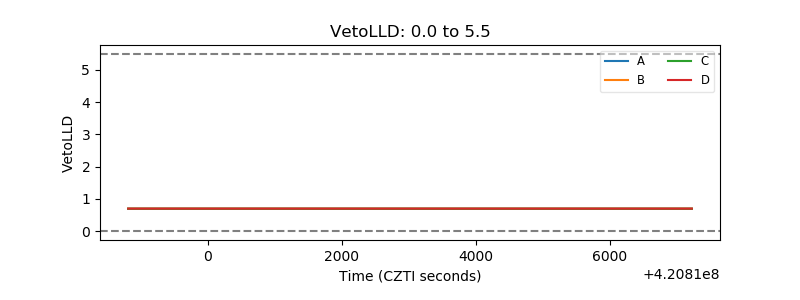 |
| Alpha Counter | 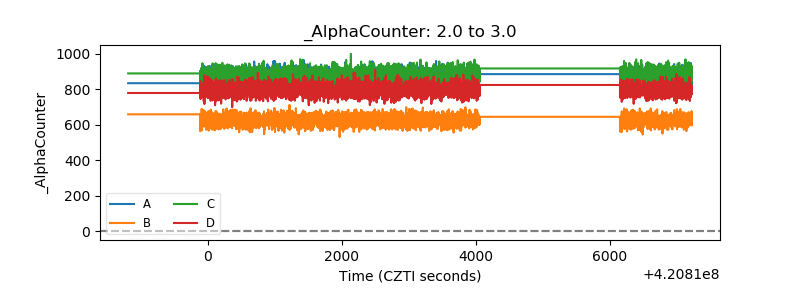 |
| _CPM_Rate | 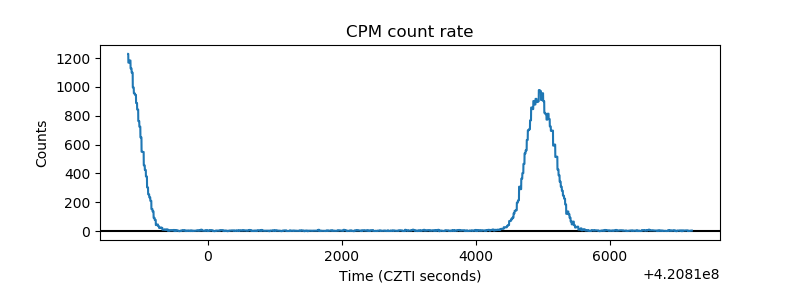 |
| CZT Counter | 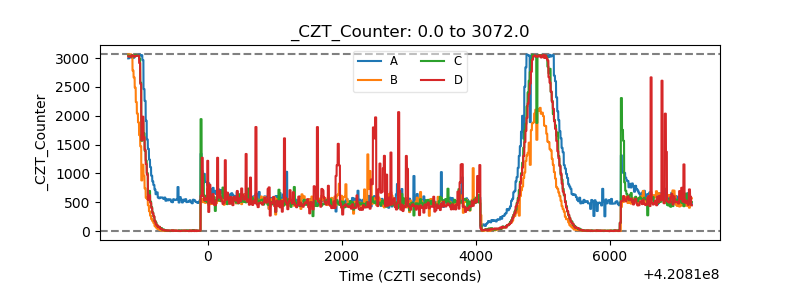 |
| +2.5 Volts monitor |  |
| +5 Volts monitor | 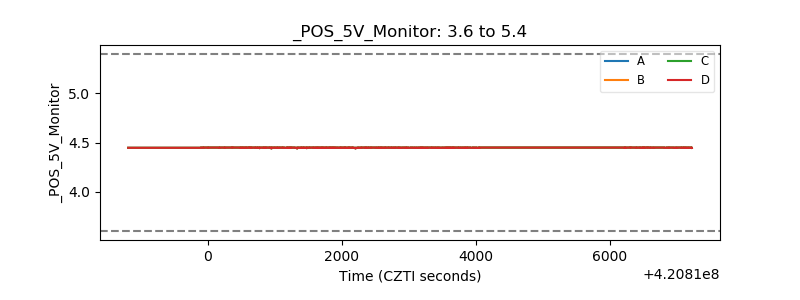 |
| _ROLL_ROT | 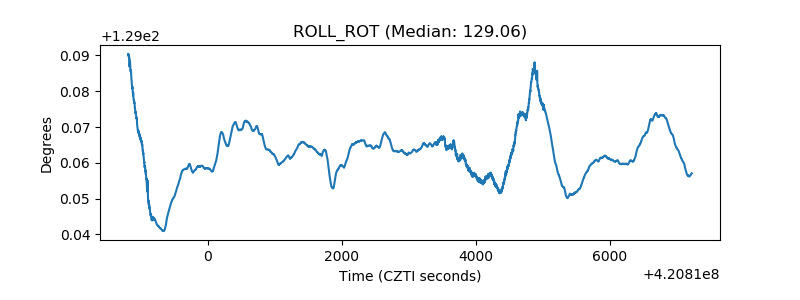 |
| _Roll_DEC | 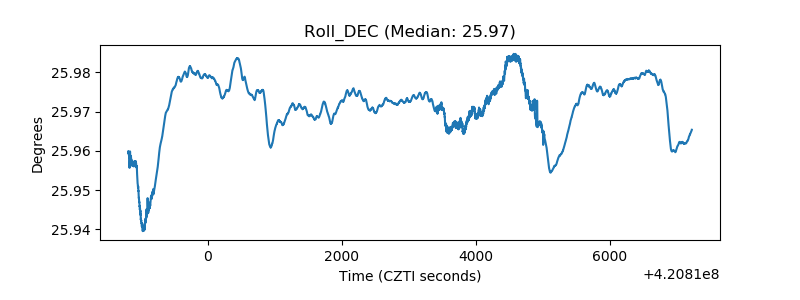 |
| _Roll_RA | 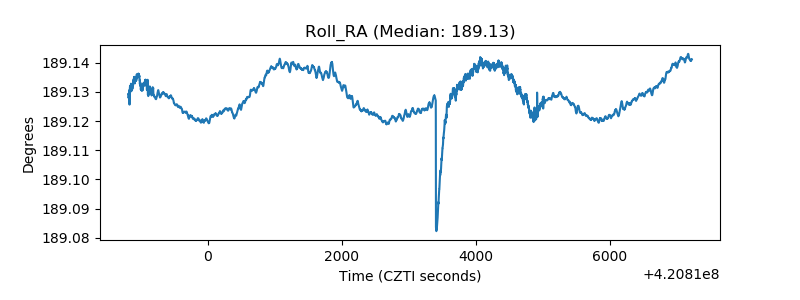 |
| Veto Counter | 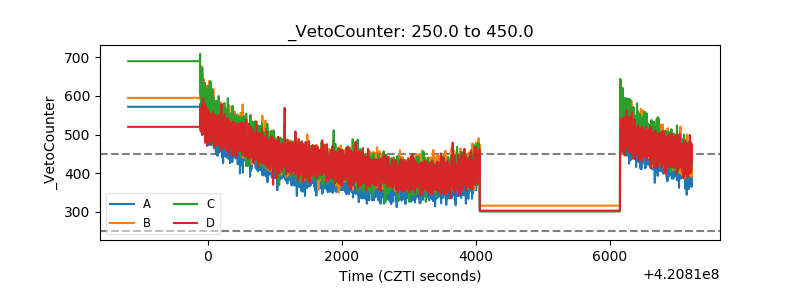 |