| Param | Original file | Final file |
|---|---|---|
| Filename | modeM0/AS1A12_093T02_9000005594_41070cztM0_level2.fits | modeM0/AS1A12_093T02_9000005594_41070cztM0_level2_quad_clean.evt |
| Size (bytes) | 141,618,240 | 40,760,640 |
| Size | 135.1 MB | 38.9 MB |
| Events in quadrant A | 1,279,300 | 282,328 |
| Events in quadrant B | 1,157,999 | 286,063 |
| Events in quadrant C | 1,195,308 | 263,226 |
| Events in quadrant D | 1,436,179 | 244,028 |
| Mode M0 | |||
|---|---|---|---|
| Quadrant | BADHDUFLAG | Total packets | Discarded packets |
| A | 0 | 5167 | 1 |
| B | 0 | 4870 | 1 |
| C | 0 | 4790 | 1 |
| D | 0 | 5629 | 1 |
| Mode SS | |||
|---|---|---|---|
| Quadrant | BADHDUFLAG | Total packets | Discarded packets |
| A | 0 | 44 | 0 |
| B | 0 | 44 | 0 |
| C | 0 | 44 | 0 |
| D | 0 | 44 | 0 |
| Mode M9 | |||
|---|---|---|---|
| Quadrant | BADHDUFLAG | Total packets | Discarded packets |
| A | 0 | 15 | 0 |
| B | 0 | 15 | 0 |
| C | 0 | 15 | 0 |
| D | 0 | 16 | 0 |
| Quadrant | Total seconds | Saturated seconds | Saturation percentage |
|---|---|---|---|
| A | 2198 | 7 | 0.318471% |
| B | 2198 | 2 | 0.090992% |
| C | 2198 | 35 | 1.592357% |
| D | 2198 | 74 | 3.366697% |
Noise dominated data is calculated using 1-second bins in cleaned event files. If a bin has >2000 counts, and if more than 50% of those come from <1% of pixels, then it is considered to be noise-dominated and hence unusable.
| Quadrant | # 1 sec bins | Bins with >0 counts | Bins with >2000 counts | High rate bins dominated by noise | Noise dominated (total time) | Noise dominated (detector-on time) | Marked lightcurve |
|---|---|---|---|---|---|---|---|
| A | 2198 | 2198 | 1 | 1 | 0.05% | 0.05% | 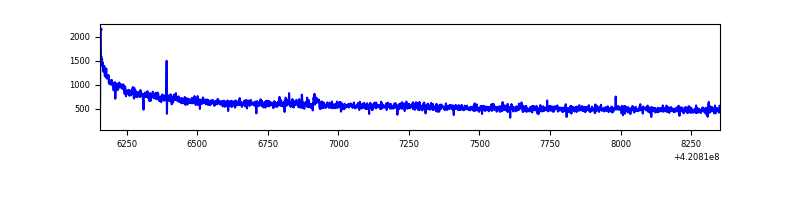 |
| B | 2198 | 2198 | 0 | 0 | 0.00% | 0.00% | 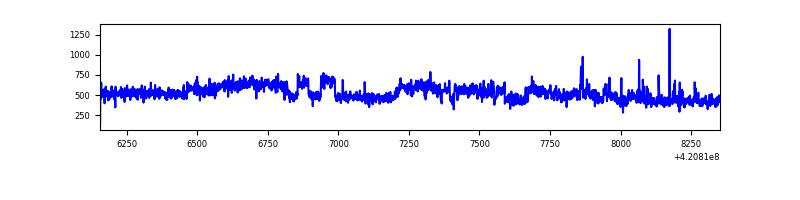 |
| C | 2198 | 2198 | 31 | 31 | 1.41% | 1.41% | 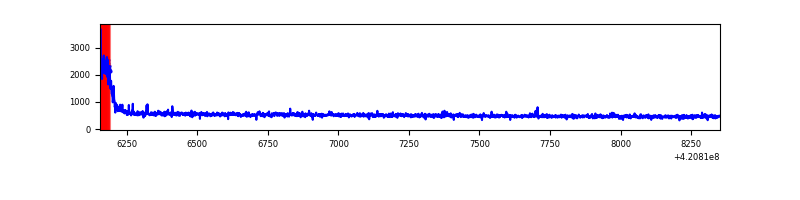 |
| D | 2198 | 2198 | 59 | 59 | 2.68% | 2.68% | 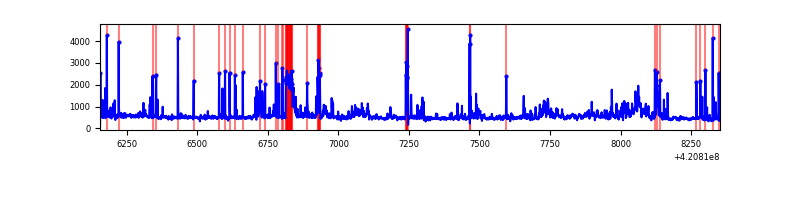 |
Top three noisy pixels from each quadrant. If the there are fewer than three noisy pixels in the level2.evt file, extra rows are filled as -1
| Pixel properties | Quadrant properties | ||||||
|---|---|---|---|---|---|---|---|
| Quadrant | DetID | PixID | Counts | Sigma | Mean | Median | Sigma |
| A | 10 | 83 | 222855 | 4053.07 | 267 | 263 | 54.9 |
| A | 2 | 79 | 9045 | 159.91 | 267 | 263 | 54.9 |
| A | 12 | 189 | 7004 | 122.74 | 267 | 263 | 54.9 |
| B | 0 | 229 | 124031 | 2376.49 | 260 | 253 | 52.1 |
| B | 15 | 32 | 12389 | 233.01 | 260 | 253 | 52.1 |
| B | 12 | 111 | 6129 | 112.82 | 260 | 253 | 52.1 |
| C | 15 | 214 | 94957 | 1544.26 | 258 | 260 | 61.3 |
| C | 0 | 10 | 88540 | 1439.62 | 258 | 260 | 61.3 |
| C | 14 | 254 | 5623 | 87.46 | 258 | 260 | 61.3 |
| D | 2 | 16 | 206705 | 3194.88 | 260 | 253 | 64.6 |
| D | 2 | 249 | 101454 | 1566.1 | 260 | 253 | 64.6 |
| D | 9 | 19 | 49321 | 759.34 | 260 | 253 | 64.6 |
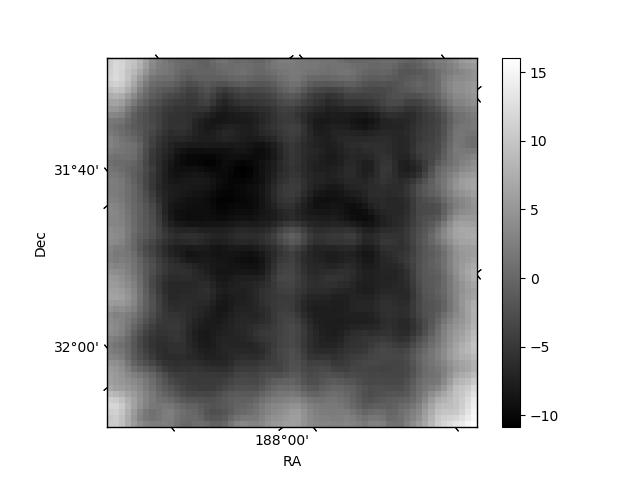
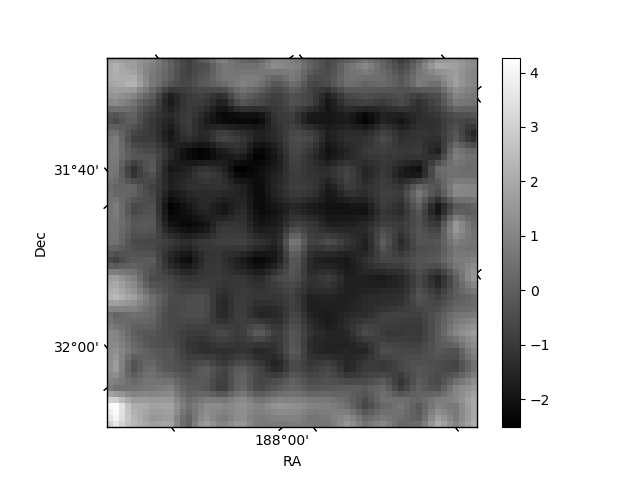
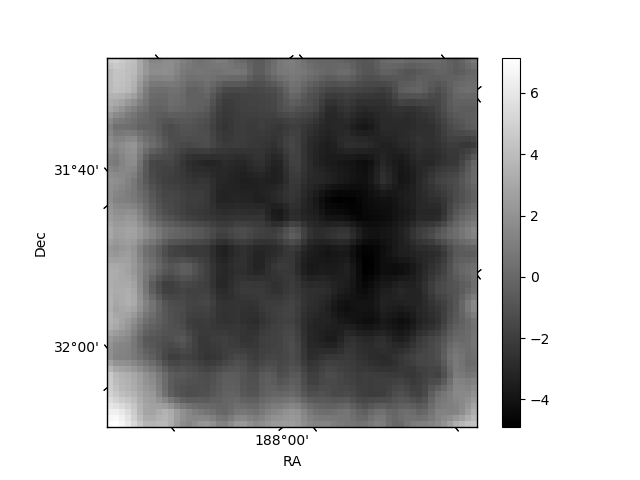
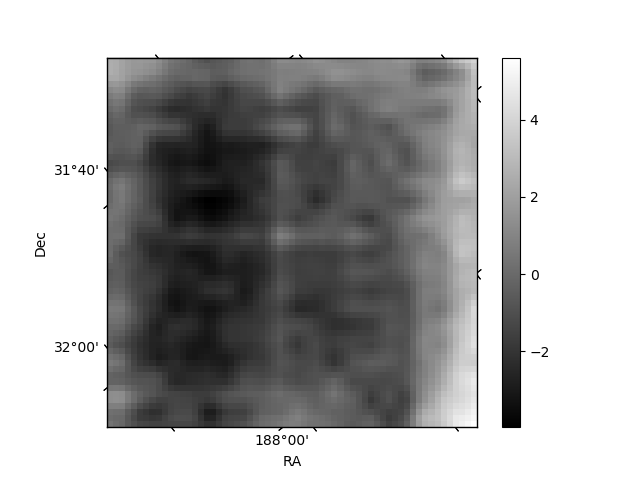
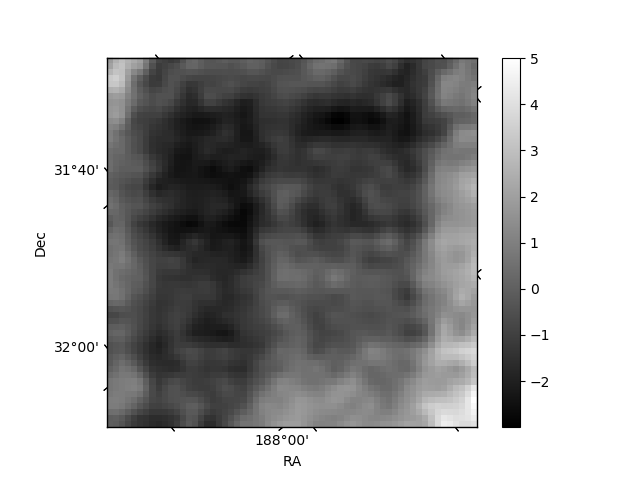
Histogram calculated using DETX and DETY for each event in the final _common_clean file
| Quadrant A | 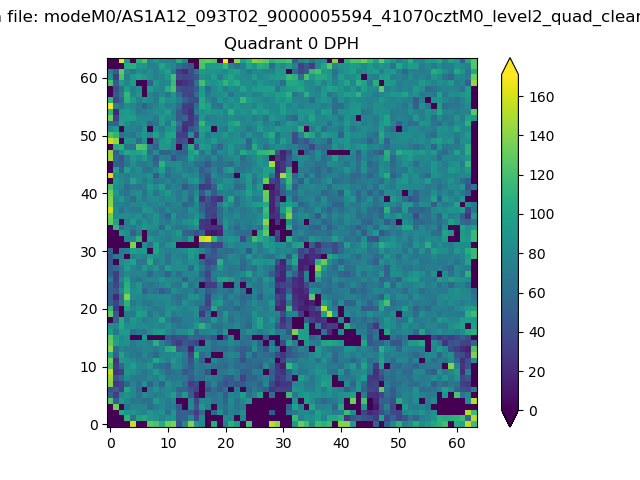 |
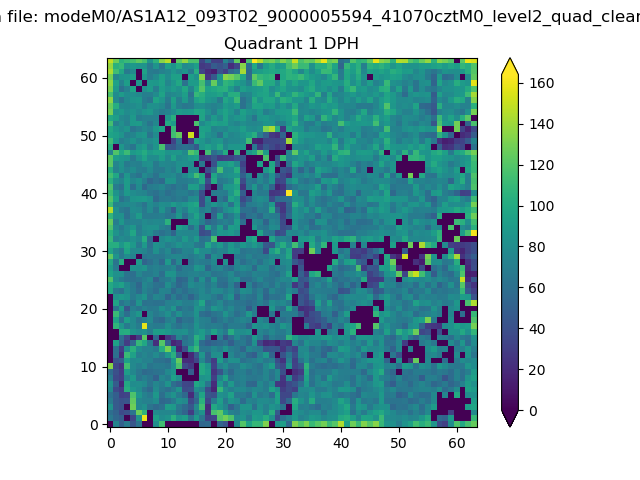 |
Quadrant B |
|---|---|---|---|
| Quadrant D | 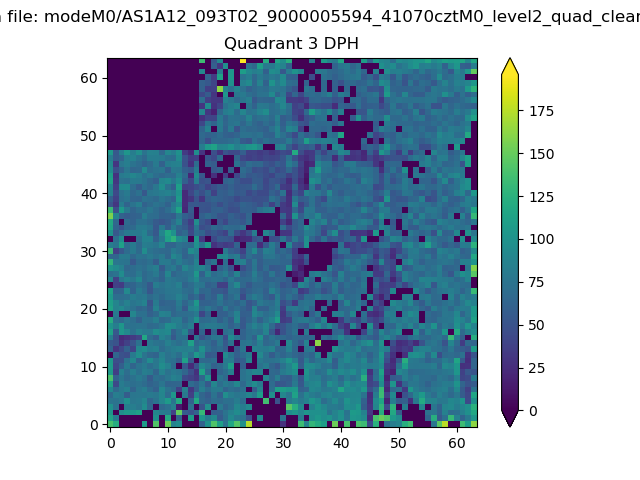 |
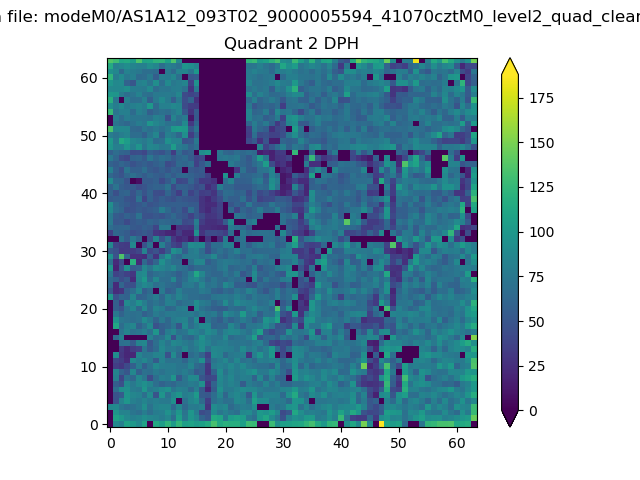 |
Quadrant C |
| Plot type | Count rate plots | Images |
|---|---|---|
| Comparison with Poisson distribution Blue bars denote a histogram of data divided into 1 sec bins. Red curve is a Poisson curve with rate = median count rate of data. |
 |
 |
| Quadrant-wise count rates Data is divided into 100 sec bins |
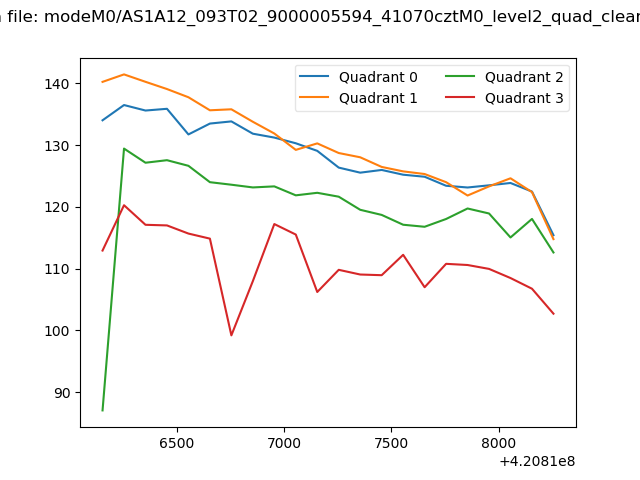 |
|
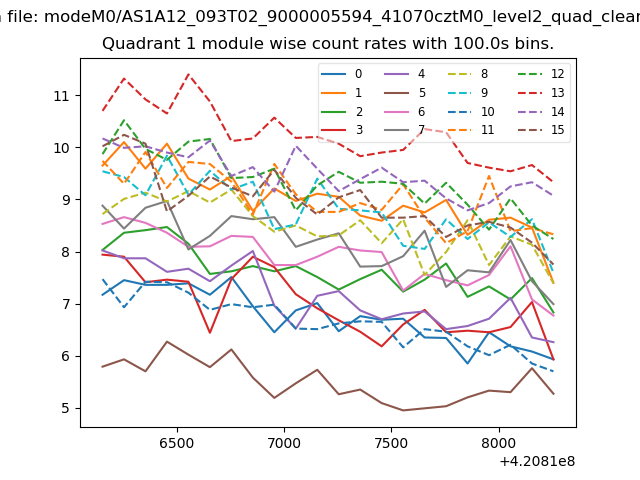
| Module-wise count rates for Quadrant A Data is divided into 100 sec bins |
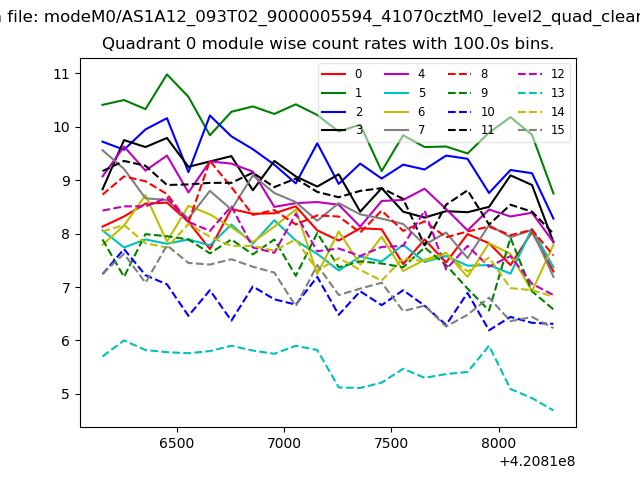 |
 |
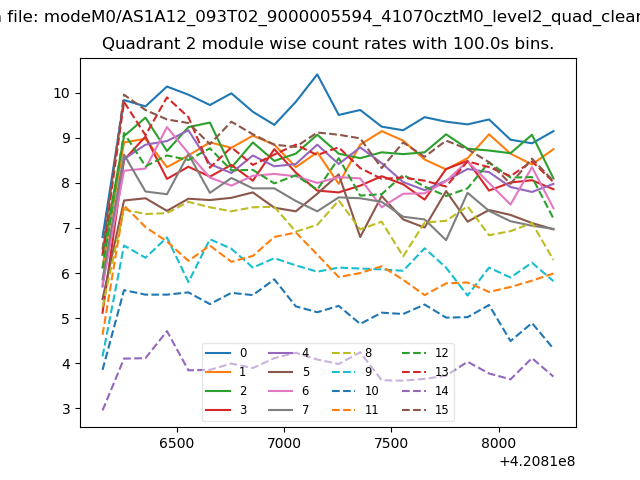
| Module-wise count rates for Quadrant B Data is divided into 100 sec bins |
 |
 |
| Module-wise count rates for Quadrant C Data is divided into 100 sec bins |
 |
 |
| Module-wise count rates for Quadrant D Data is divided into 100 sec bins |
 |
 |
| Parameter | Plot |
|---|---|
| CZT HV Monitor |  |
| D_VDD | 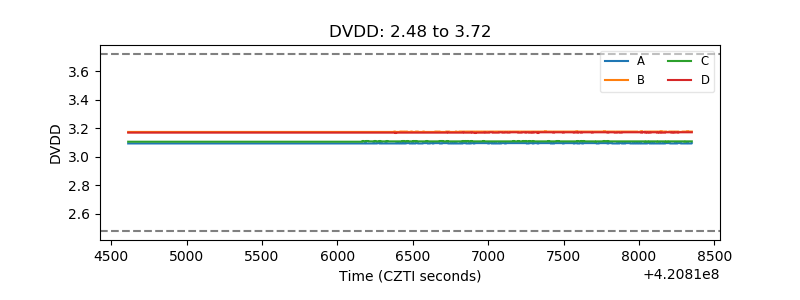 |
| Temperature 1 | 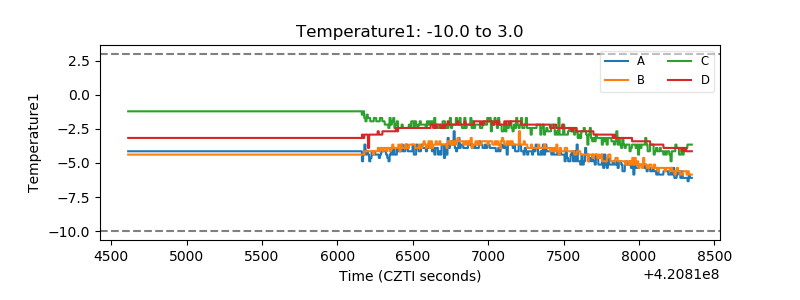 |
| Veto HV Monitor | 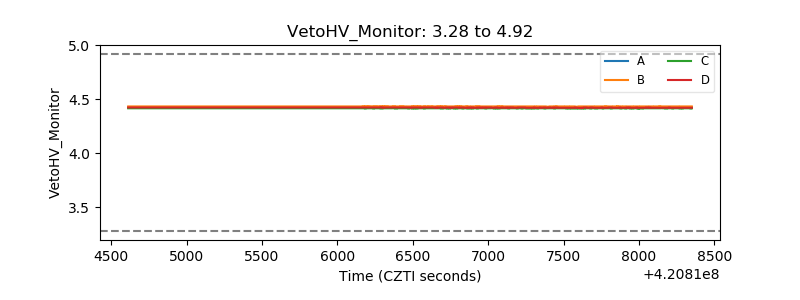 |
| Veto LLD | 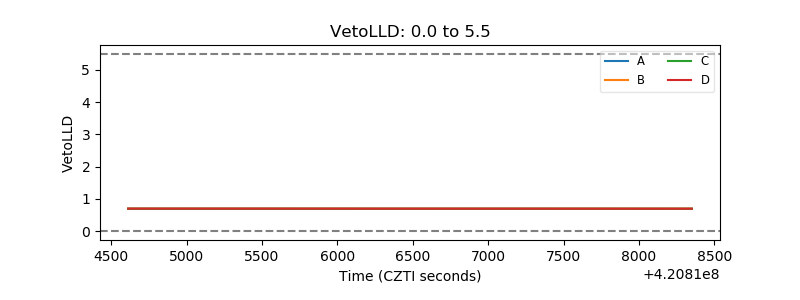 |
| Alpha Counter | 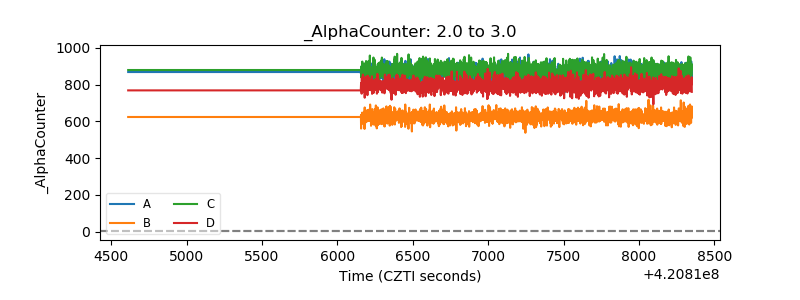 |
| _CPM_Rate | 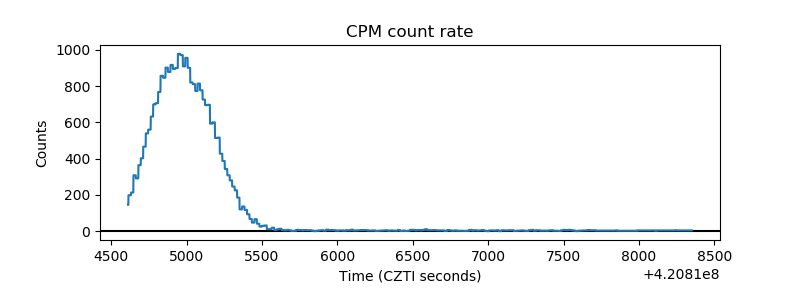 |
| CZT Counter | 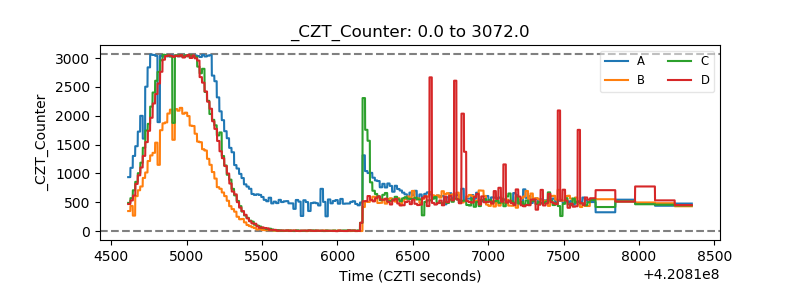 |
| +2.5 Volts monitor |  |
| +5 Volts monitor | 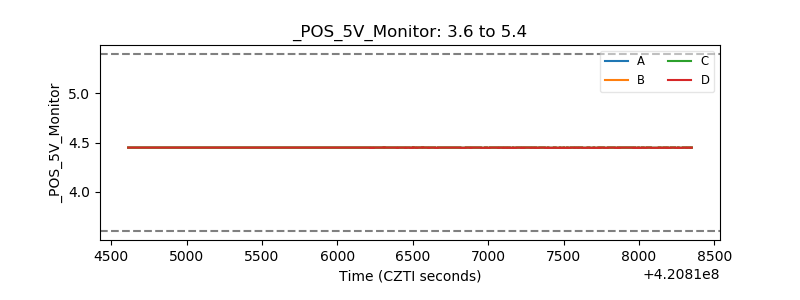 |
| _ROLL_ROT | 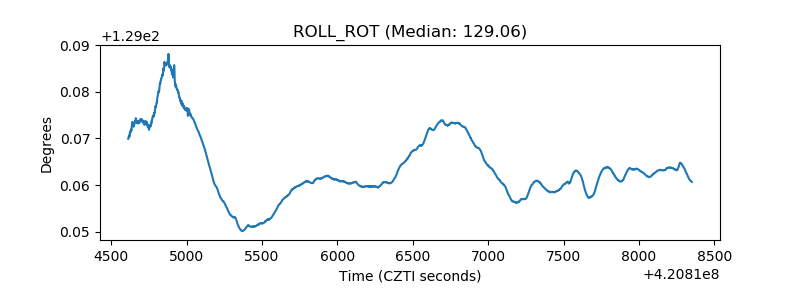 |
| _Roll_DEC | 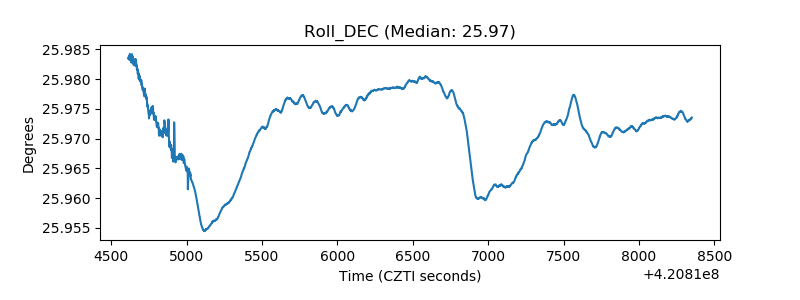 |
| _Roll_RA | 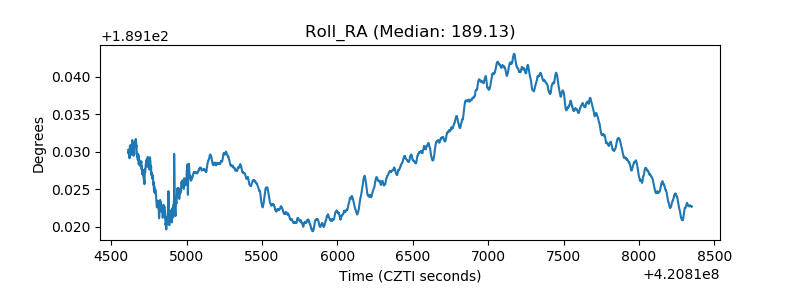 |
| Veto Counter |  |