| Param | Original file | Final file |
|---|---|---|
| Filename | modeM0/AS1A12_095T02_9000005596_41071cztM0_level2.fits | modeM0/AS1A12_095T02_9000005596_41071cztM0_level2_quad_clean.evt |
| Size (bytes) | 293,005,440 | 78,243,840 |
| Size | 279.4 MB | 74.6 MB |
| Events in quadrant A | 2,718,362 | 523,886 |
| Events in quadrant B | 3,003,972 | 529,973 |
| Events in quadrant C | 2,289,555 | 513,697 |
| Events in quadrant D | 2,472,179 | 474,823 |
| Mode M0 | |||
|---|---|---|---|
| Quadrant | BADHDUFLAG | Total packets | Discarded packets |
| A | 0 | 11784 | 733 |
| B | 0 | 12910 | 741 |
| C | 0 | 10248 | 551 |
| D | 0 | 11247 | 730 |
| Mode SS | |||
|---|---|---|---|
| Quadrant | BADHDUFLAG | Total packets | Discarded packets |
| A | 0 | 103 | 1 |
| B | 0 | 101 | 0 |
| C | 0 | 100 | 1 |
| D | 0 | 103 | 1 |
| Mode M9 | |||
|---|---|---|---|
| Quadrant | BADHDUFLAG | Total packets | Discarded packets |
| A | 0 | 20 | 0 |
| B | 0 | 20 | 0 |
| C | 0 | 20 | 0 |
| D | 0 | 20 | 1 |
| Quadrant | Total seconds | Saturated seconds | Saturation percentage |
|---|---|---|---|
| A | 4621 | 13 | 0.281324% |
| B | 4647 | 152 | 3.270927% |
| C | 4633 | 36 | 0.777034% |
| D | 4627 | 44 | 0.950940% |
Noise dominated data is calculated using 1-second bins in cleaned event files. If a bin has >2000 counts, and if more than 50% of those come from <1% of pixels, then it is considered to be noise-dominated and hence unusable.
| Quadrant | # 1 sec bins | Bins with >0 counts | Bins with >2000 counts | High rate bins dominated by noise | Noise dominated (total time) | Noise dominated (detector-on time) | Marked lightcurve |
|---|---|---|---|---|---|---|---|
| A | 7058 | 4865 | 4 | 4 | 0.06% | 0.08% | 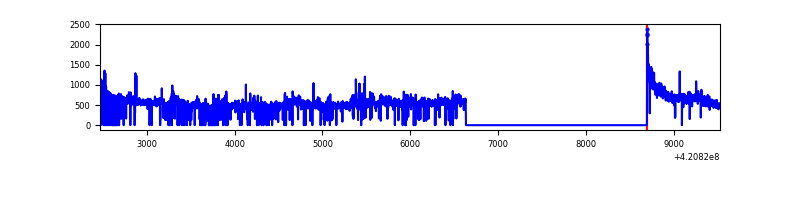 |
| B | 7059 | 4883 | 105 | 105 | 1.49% | 2.15% | 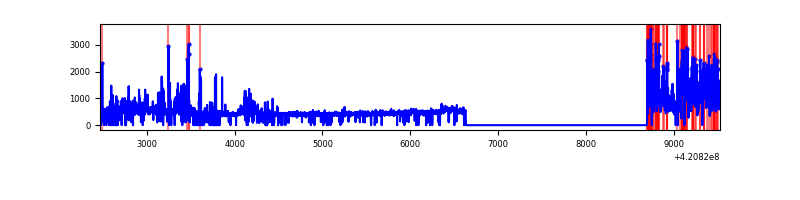 |
| C | 7060 | 4875 | 31 | 31 | 0.44% | 0.64% | 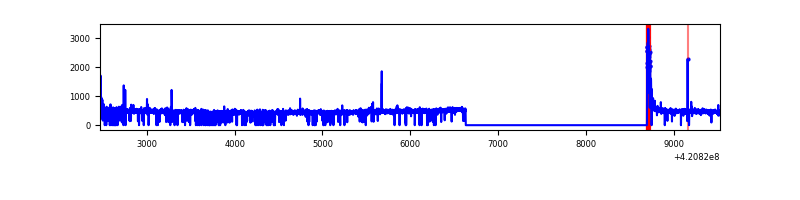 |
| D | 7060 | 4863 | 38 | 38 | 0.54% | 0.78% | 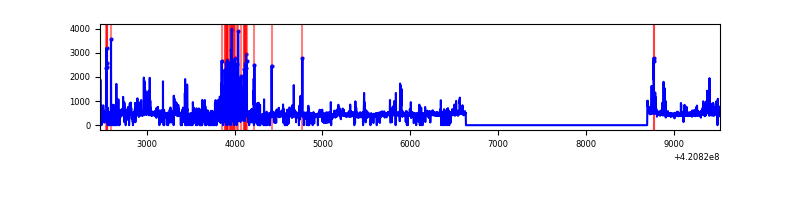 |
Top three noisy pixels from each quadrant. If the there are fewer than three noisy pixels in the level2.evt file, extra rows are filled as -1
| Pixel properties | Quadrant properties | ||||||
|---|---|---|---|---|---|---|---|
| Quadrant | DetID | PixID | Counts | Sigma | Mean | Median | Sigma |
| A | 10 | 83 | 461822 | 4371.7 | 512 | 502 | 105.5 |
| A | 12 | 189 | 254369 | 2405.77 | 512 | 502 | 105.5 |
| A | 13 | 6 | 9214 | 82.56 | 512 | 502 | 105.5 |
| B | 0 | 186 | 456965 | 4654.48 | 508 | 495 | 98.1 |
| B | 0 | 190 | 214191 | 2178.99 | 508 | 495 | 98.1 |
| B | 5 | 255 | 196706 | 2000.7 | 508 | 495 | 98.1 |
| C | 15 | 214 | 196818 | 1665.7 | 502 | 506 | 117.9 |
| C | 0 | 10 | 108099 | 912.92 | 502 | 506 | 117.9 |
| C | 14 | 254 | 22396 | 185.74 | 502 | 506 | 117.9 |
| D | 2 | 16 | 152905 | 1236.98 | 500 | 485 | 123.2 |
| D | 12 | 79 | 145579 | 1177.53 | 500 | 485 | 123.2 |
| D | 2 | 153 | 51860 | 416.94 | 500 | 485 | 123.2 |
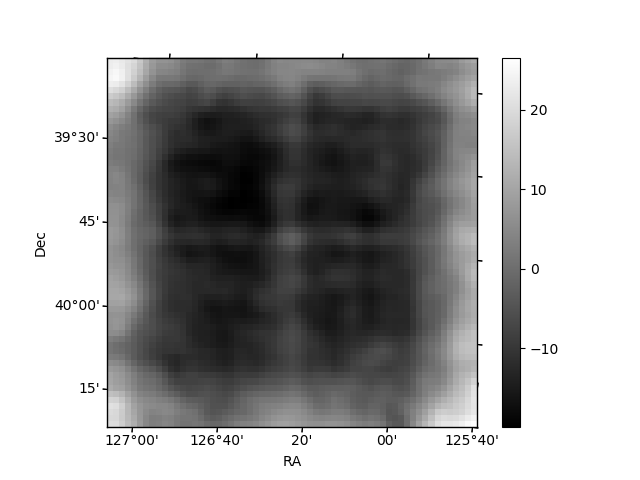
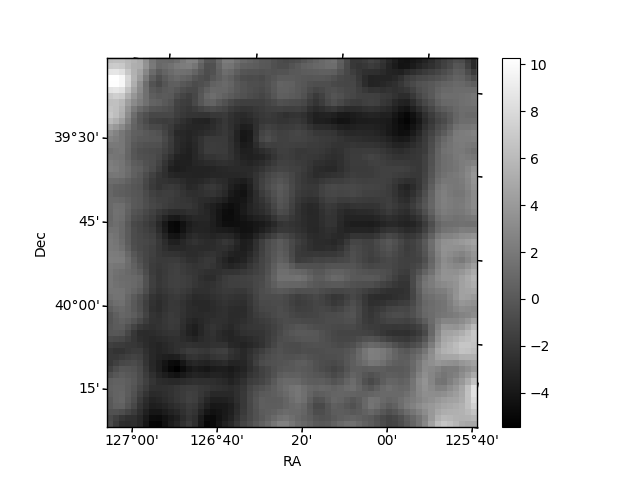
Histogram calculated using DETX and DETY for each event in the final _common_clean file
| Quadrant A | 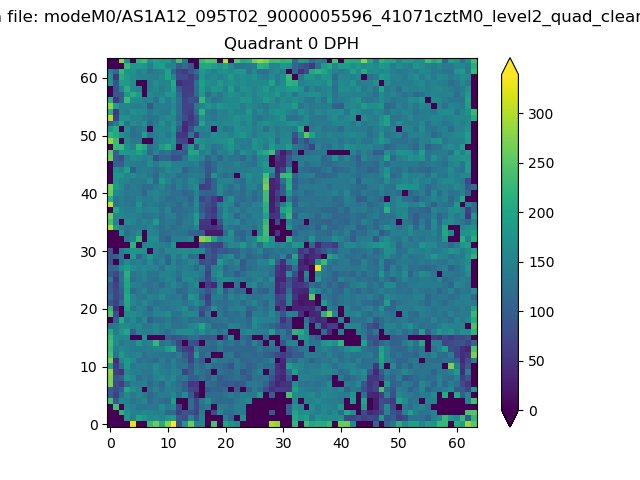 |
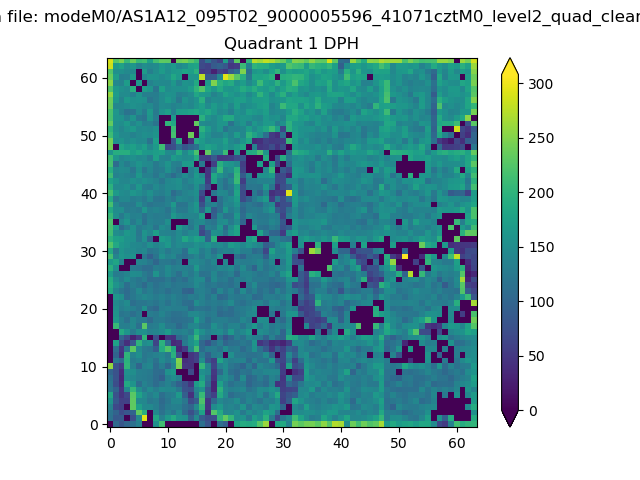 |
Quadrant B |
|---|---|---|---|
| Quadrant D | 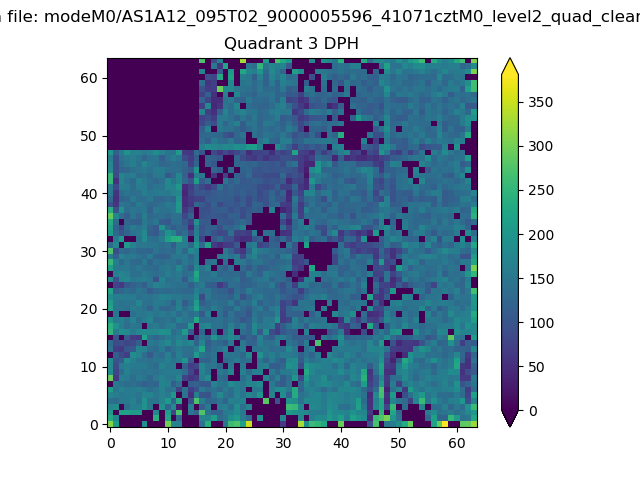 |
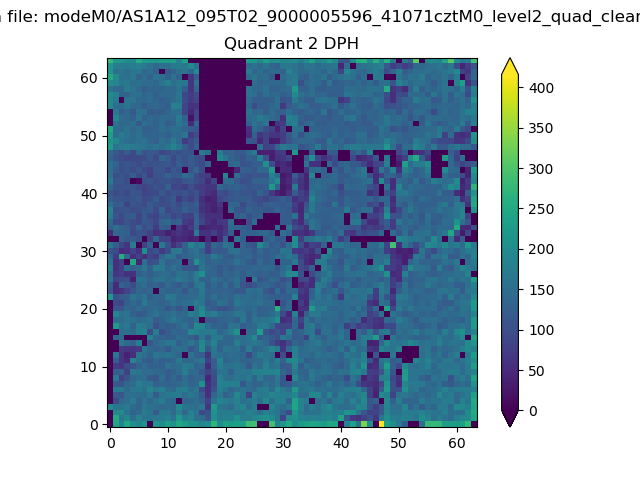 |
Quadrant C |
| Plot type | Count rate plots | Images |
|---|---|---|
| Comparison with Poisson distribution Blue bars denote a histogram of data divided into 1 sec bins. Red curve is a Poisson curve with rate = median count rate of data. |
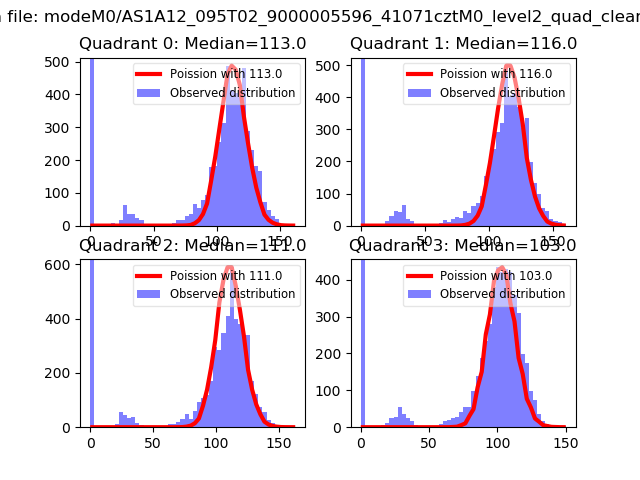 |
 |
| Quadrant-wise count rates Data is divided into 100 sec bins |
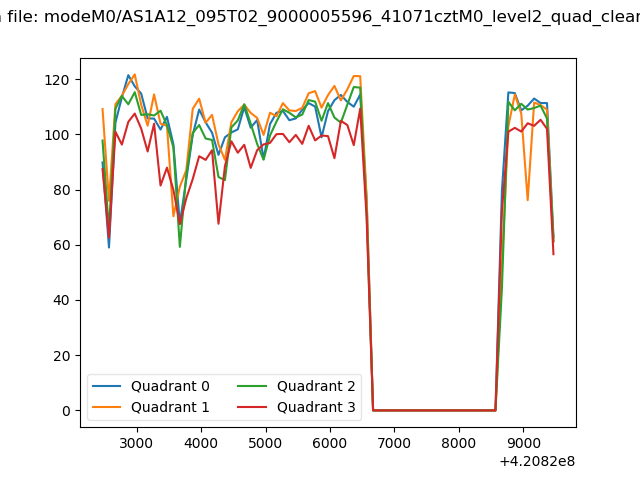 |
|
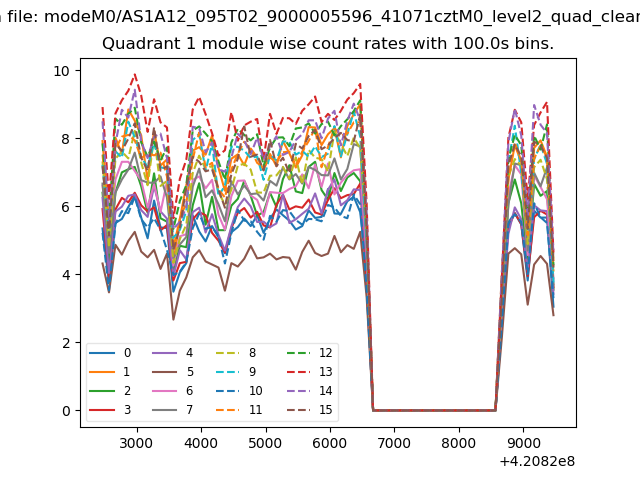
| Module-wise count rates for Quadrant A Data is divided into 100 sec bins |
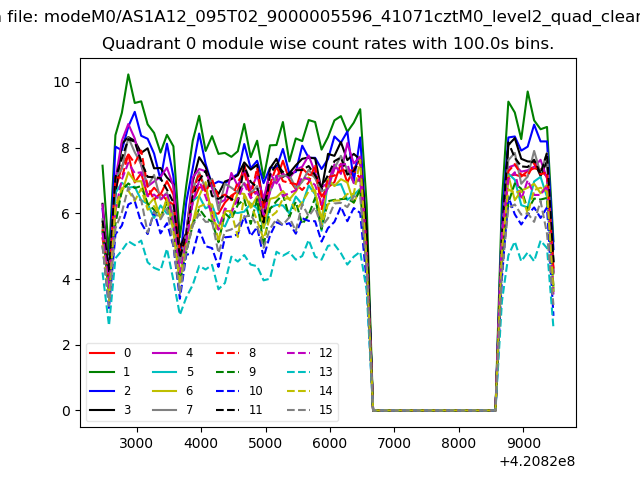 |
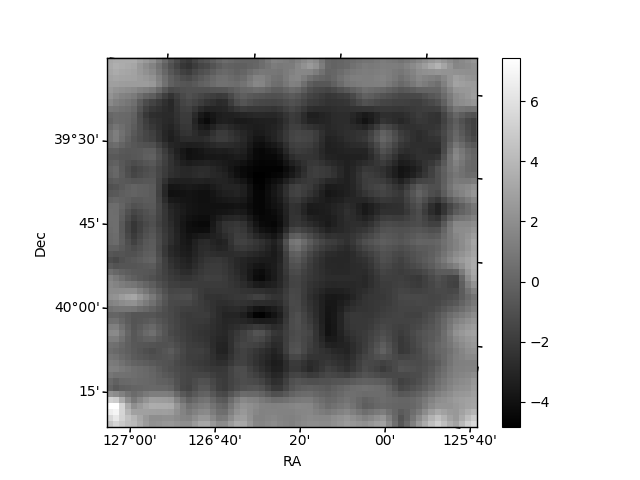 |
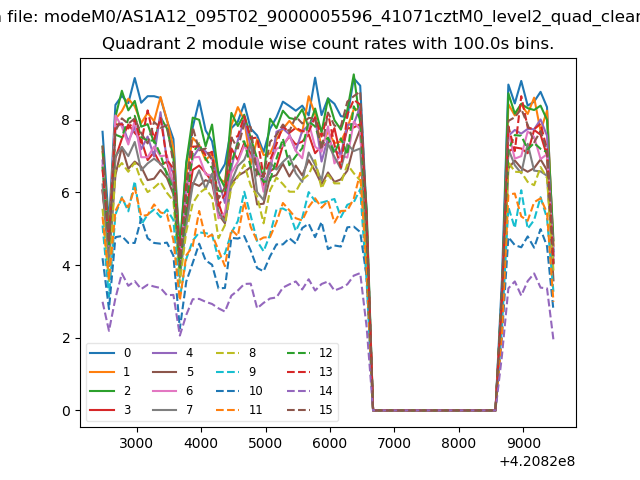
| Module-wise count rates for Quadrant B Data is divided into 100 sec bins |
 |
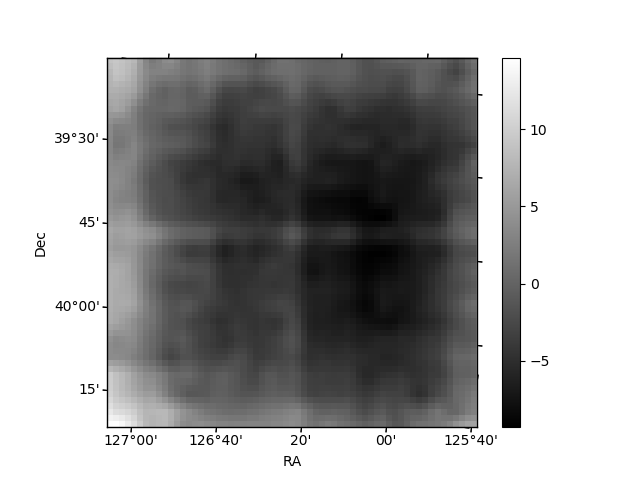 |
| Module-wise count rates for Quadrant C Data is divided into 100 sec bins |
 |
 |
| Module-wise count rates for Quadrant D Data is divided into 100 sec bins |
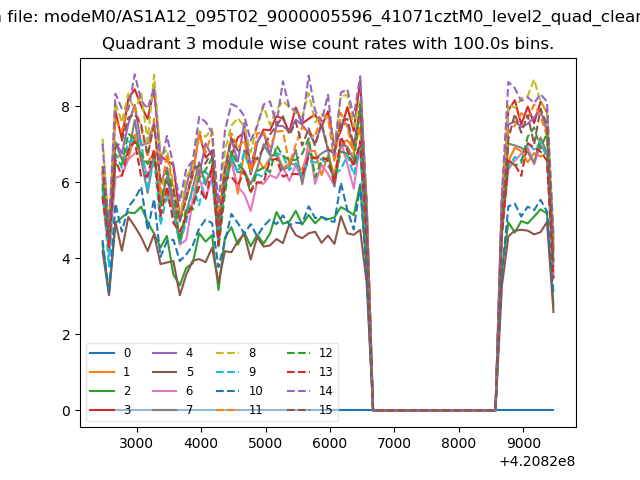 |
 |
| Parameter | Plot |
|---|---|
| CZT HV Monitor | 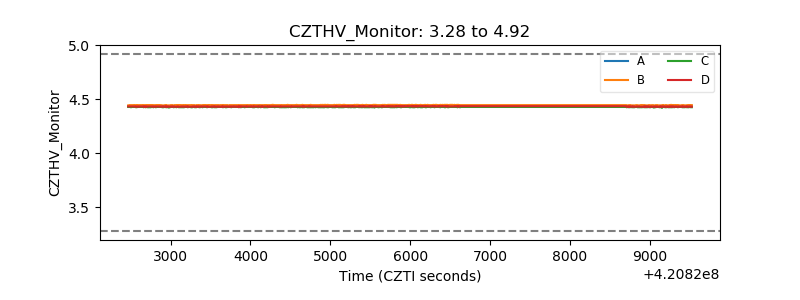 |
| D_VDD | 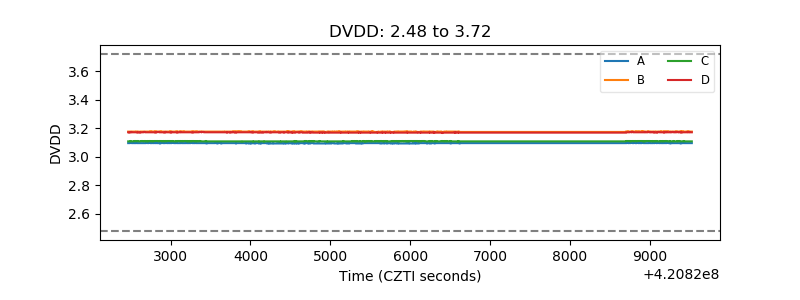 |
| Temperature 1 | 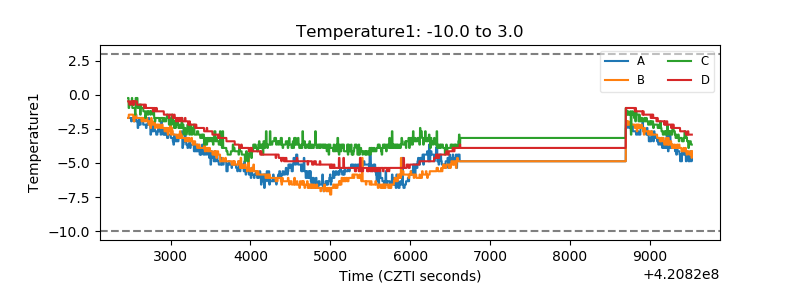 |
| Veto HV Monitor |  |
| Veto LLD | 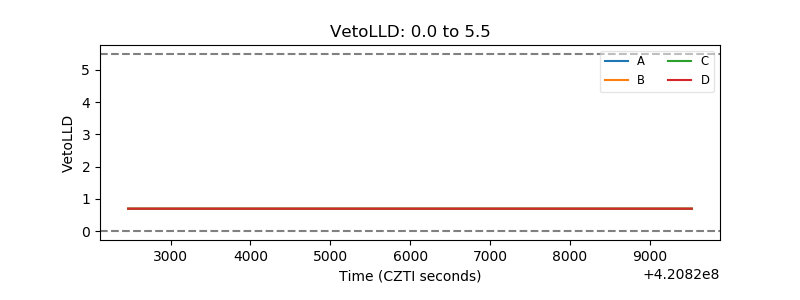 |
| Alpha Counter | 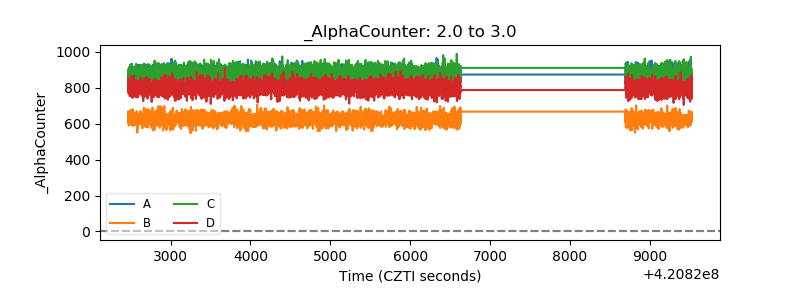 |
| _CPM_Rate | 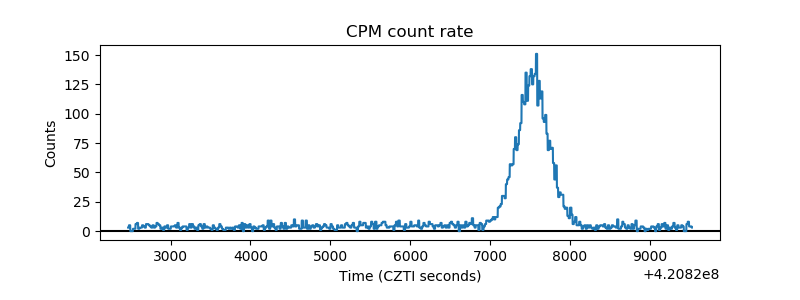 |
| CZT Counter |  |
| +2.5 Volts monitor | 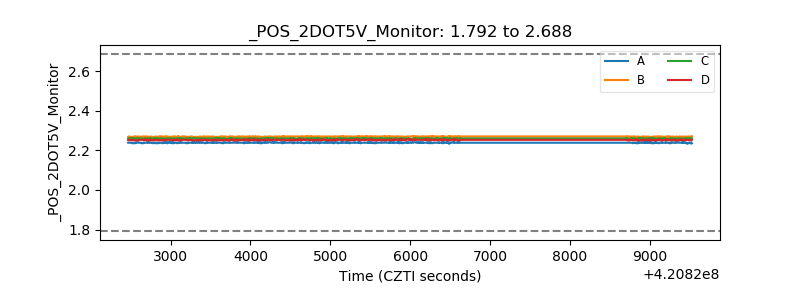 |
| +5 Volts monitor | 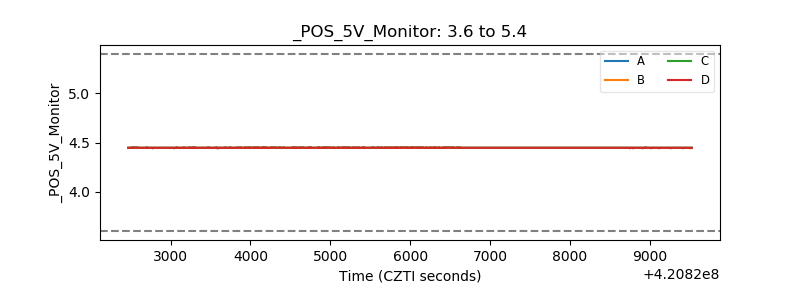 |
| _ROLL_ROT | 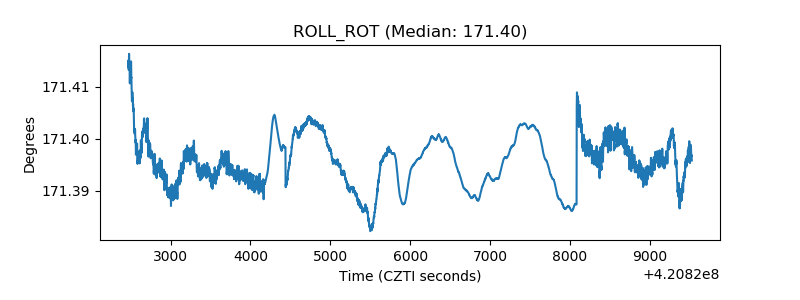 |
| _Roll_DEC |  |
| _Roll_RA | 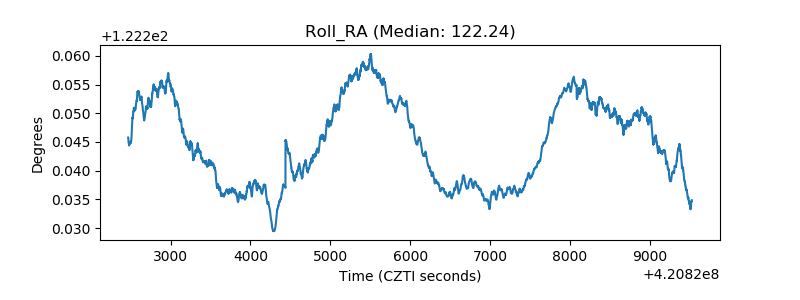 |
| Veto Counter | 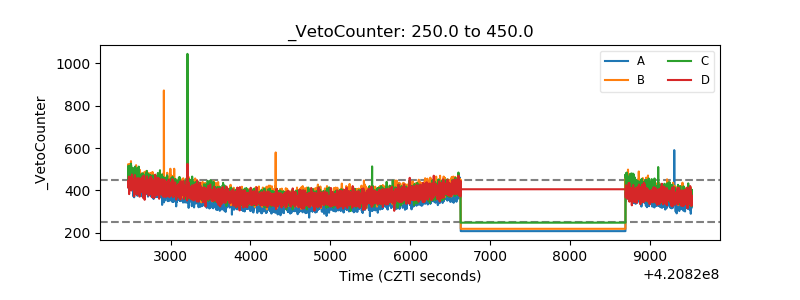 |