| Param | Original file | Final file |
|---|---|---|
| Filename | modeM0/AS1A12_095T02_9000005596_41072cztM0_level2.fits | modeM0/AS1A12_095T02_9000005596_41072cztM0_level2_quad_clean.evt |
| Size (bytes) | 536,048,640 | 144,875,520 |
| Size | 511.2 MB | 138.2 MB |
| Events in quadrant A | 5,028,782 | 971,124 |
| Events in quadrant B | 4,966,236 | 984,910 |
| Events in quadrant C | 4,320,978 | 950,265 |
| Events in quadrant D | 4,848,900 | 873,976 |
| Mode M0 | |||
|---|---|---|---|
| Quadrant | BADHDUFLAG | Total packets | Discarded packets |
| A | 0 | 20486 | 3 |
| B | 0 | 20863 | 2 |
| C | 0 | 18434 | 2 |
| D | 0 | 20537 | 2 |
| Mode SS | |||
|---|---|---|---|
| Quadrant | BADHDUFLAG | Total packets | Discarded packets |
| A | 0 | 180 | 0 |
| B | 0 | 180 | 0 |
| C | 0 | 180 | 0 |
| D | 0 | 180 | 0 |
| Mode M9 | |||
|---|---|---|---|
| Quadrant | BADHDUFLAG | Total packets | Discarded packets |
| A | 0 | 38 | 0 |
| B | 0 | 38 | 0 |
| C | 0 | 38 | 0 |
| D | 0 | 38 | 0 |
| Quadrant | Total seconds | Saturated seconds | Saturation percentage |
|---|---|---|---|
| A | 8732 | 25 | 0.286303% |
| B | 8732 | 182 | 2.084288% |
| C | 8732 | 79 | 0.904718% |
| D | 8732 | 127 | 1.454421% |
Noise dominated data is calculated using 1-second bins in cleaned event files. If a bin has >2000 counts, and if more than 50% of those come from <1% of pixels, then it is considered to be noise-dominated and hence unusable.
| Quadrant | # 1 sec bins | Bins with >0 counts | Bins with >2000 counts | High rate bins dominated by noise | Noise dominated (total time) | Noise dominated (detector-on time) | Marked lightcurve |
|---|---|---|---|---|---|---|---|
| A | 12618 | 8734 | 11 | 11 | 0.09% | 0.13% | 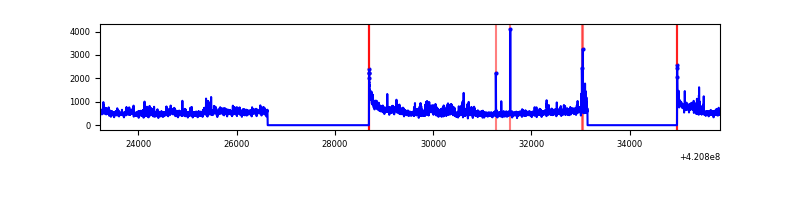 |
| B | 12618 | 8734 | 140 | 140 | 1.11% | 1.60% | 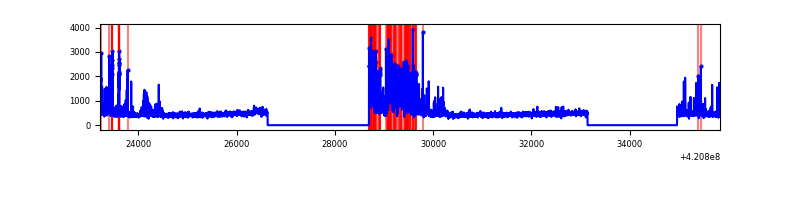 |
| C | 12618 | 8734 | 76 | 76 | 0.60% | 0.87% | 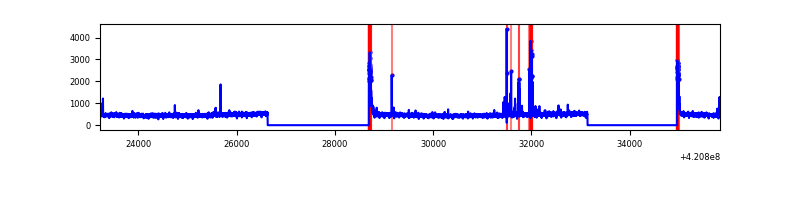 |
| D | 12618 | 8734 | 121 | 121 | 0.96% | 1.39% | 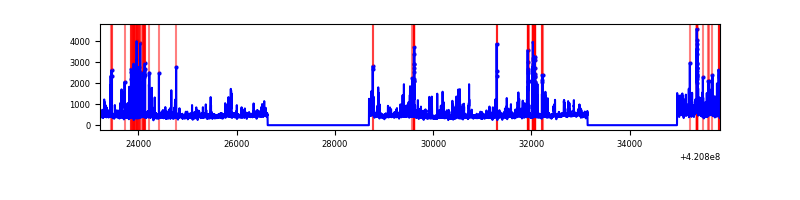 |
Top three noisy pixels from each quadrant. If the there are fewer than three noisy pixels in the level2.evt file, extra rows are filled as -1
| Pixel properties | Quadrant properties | ||||||
|---|---|---|---|---|---|---|---|
| Quadrant | DetID | PixID | Counts | Sigma | Mean | Median | Sigma |
| A | 10 | 83 | 752065 | 3864.14 | 951 | 932 | 194.4 |
| A | 12 | 189 | 520691 | 2673.85 | 951 | 932 | 194.4 |
| A | 13 | 248 | 62615 | 317.32 | 951 | 932 | 194.4 |
| B | 0 | 186 | 467109 | 2566.88 | 945 | 917 | 181.6 |
| B | 5 | 255 | 365901 | 2009.62 | 945 | 917 | 181.6 |
| B | 0 | 190 | 233229 | 1279.12 | 945 | 917 | 181.6 |
| C | 15 | 214 | 363184 | 1675.56 | 931 | 938 | 216.2 |
| C | 0 | 10 | 178587 | 821.71 | 931 | 938 | 216.2 |
| C | 14 | 254 | 143623 | 659.99 | 931 | 938 | 216.2 |
| D | 12 | 79 | 475687 | 2090.24 | 924 | 899 | 227.1 |
| D | 2 | 249 | 268561 | 1178.38 | 924 | 899 | 227.1 |
| D | 2 | 16 | 168663 | 738.58 | 924 | 899 | 227.1 |
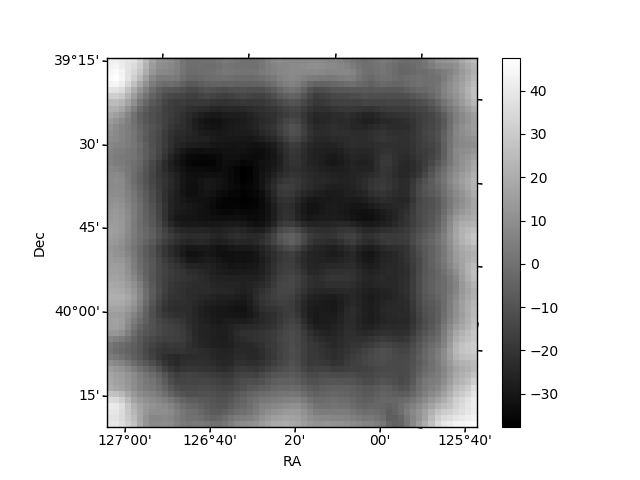
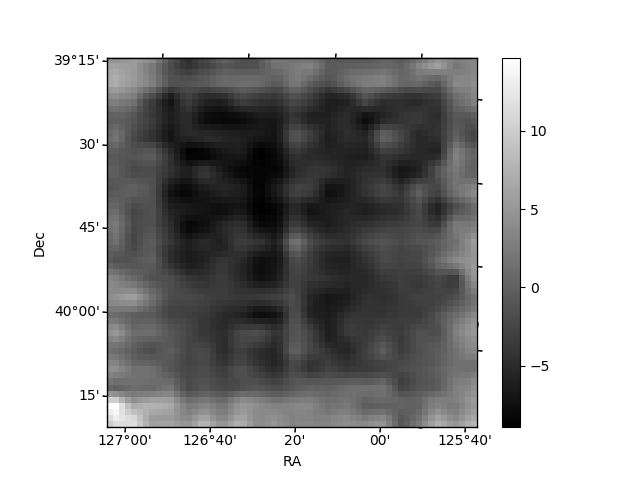
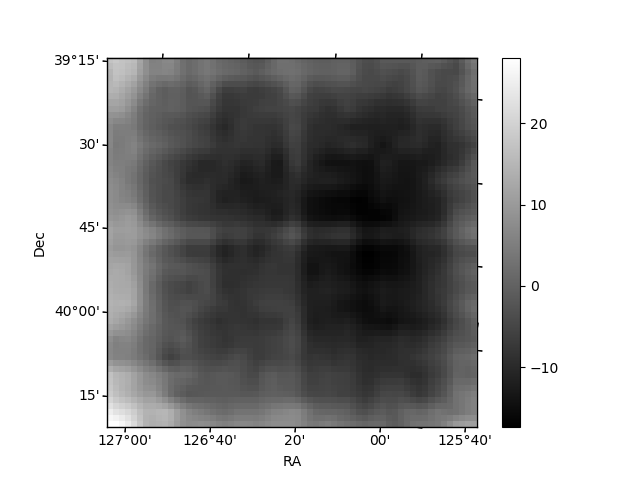
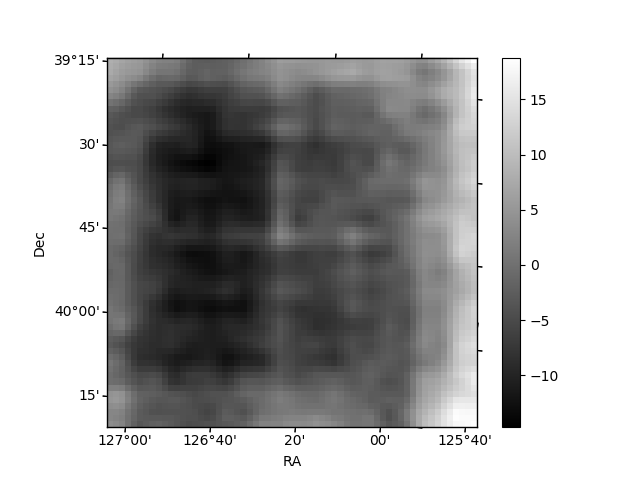
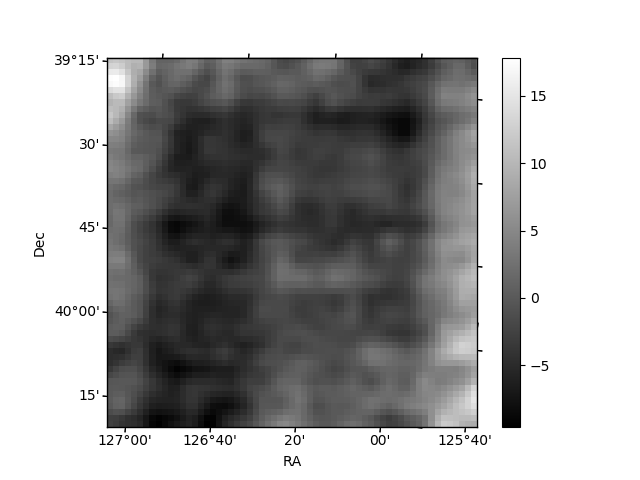
Histogram calculated using DETX and DETY for each event in the final _common_clean file
| Quadrant A | 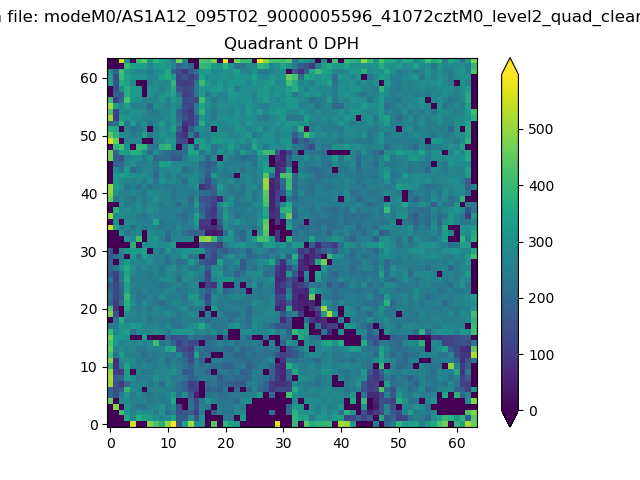 |
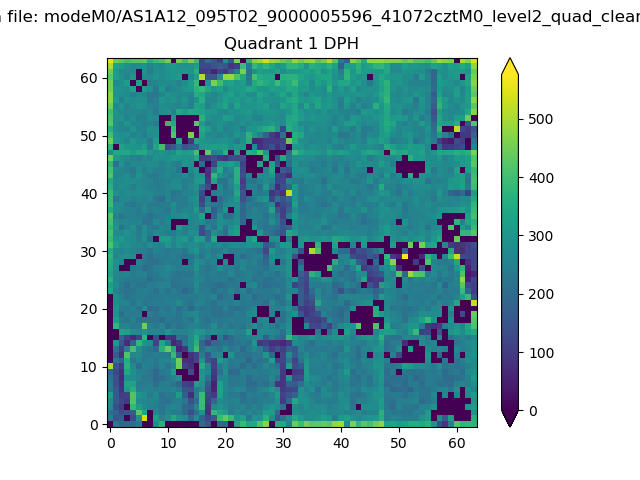 |
Quadrant B |
|---|---|---|---|
| Quadrant D | 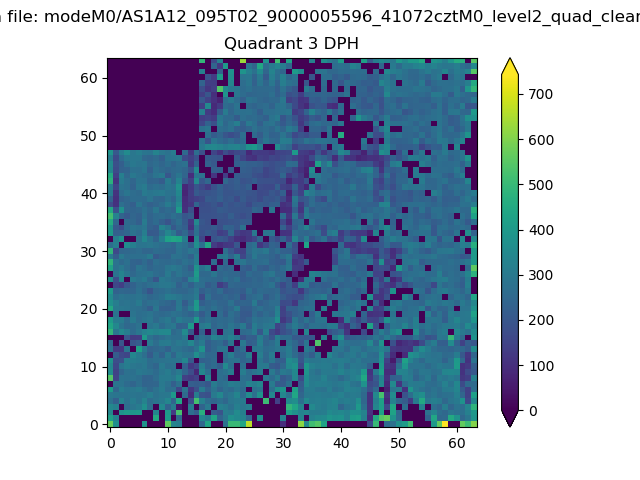 |
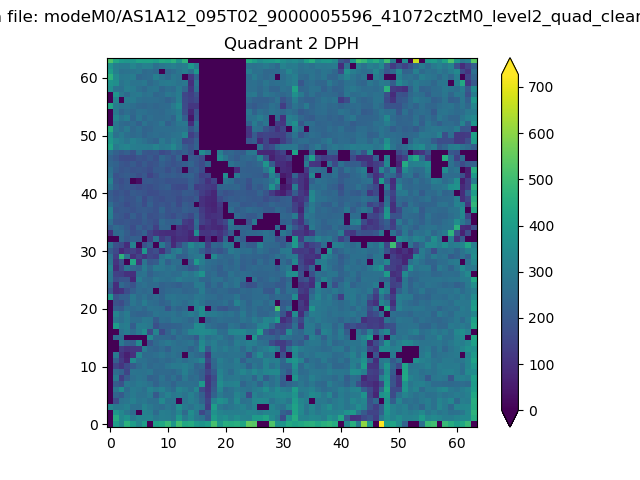 |
Quadrant C |
| Plot type | Count rate plots | Images |
|---|---|---|
| Comparison with Poisson distribution Blue bars denote a histogram of data divided into 1 sec bins. Red curve is a Poisson curve with rate = median count rate of data. |
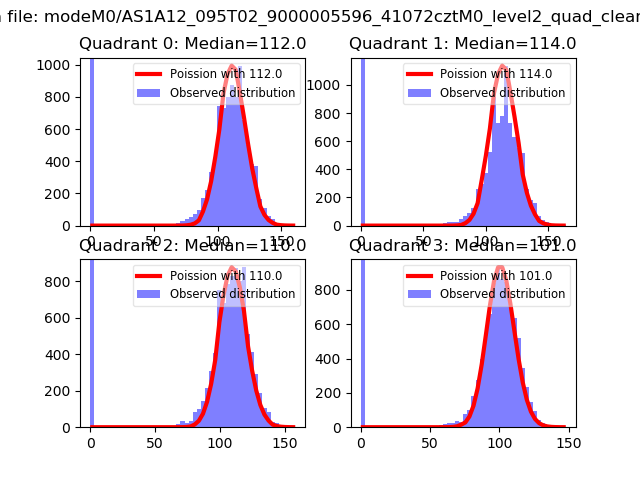 |
 |
| Quadrant-wise count rates Data is divided into 100 sec bins |
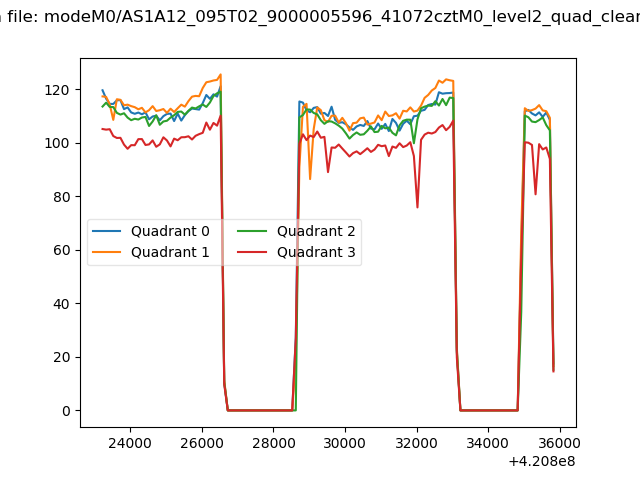 |
|
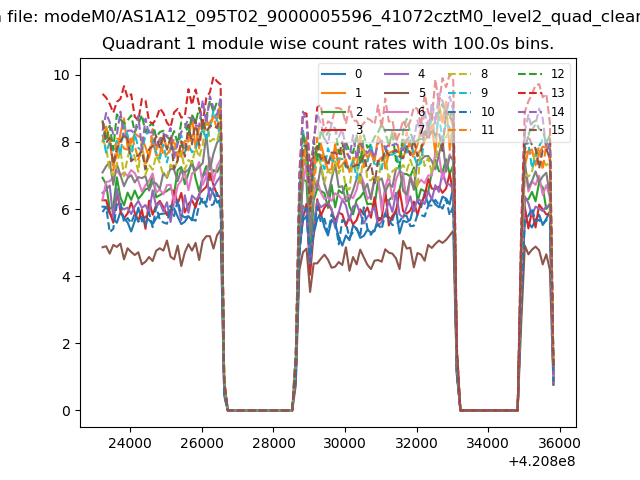
| Module-wise count rates for Quadrant A Data is divided into 100 sec bins |
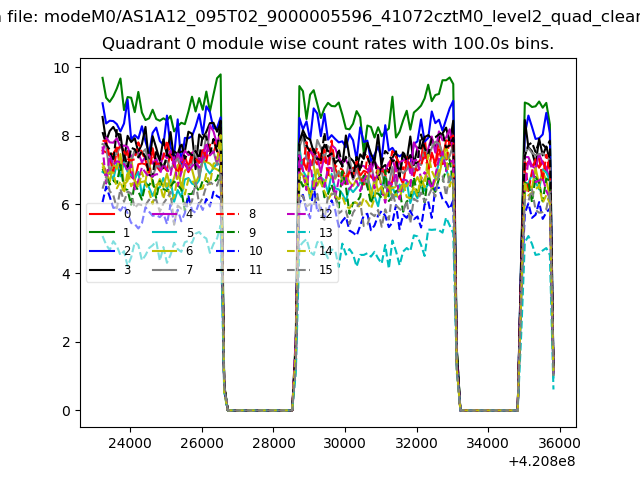 |
 |
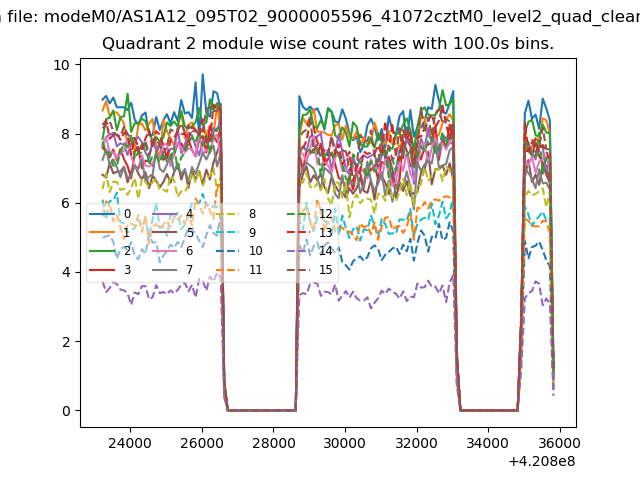
| Module-wise count rates for Quadrant B Data is divided into 100 sec bins |
 |
 |
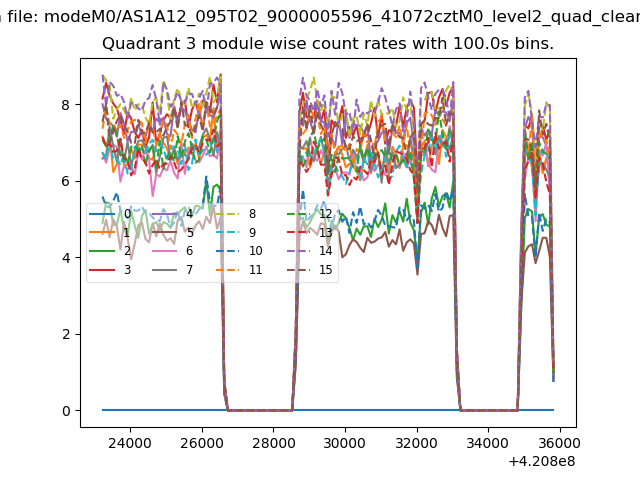
| Module-wise count rates for Quadrant C Data is divided into 100 sec bins |
 |
 |
| Module-wise count rates for Quadrant D Data is divided into 100 sec bins |
 |
 |
| Parameter | Plot |
|---|---|
| CZT HV Monitor |  |
| D_VDD | 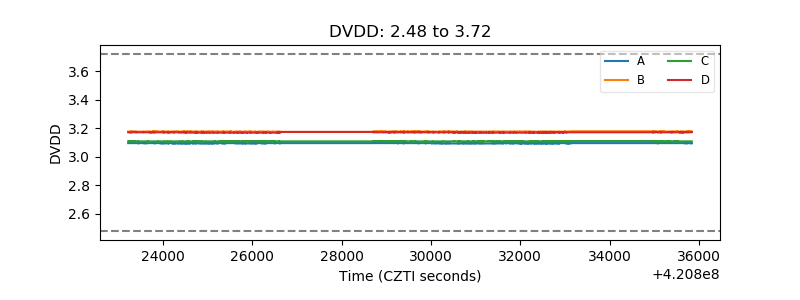 |
| Temperature 1 | 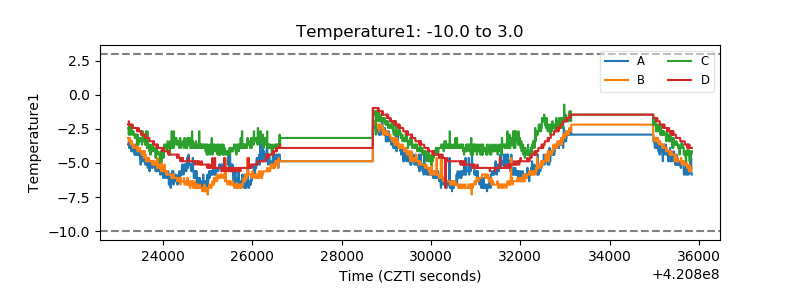 |
| Veto HV Monitor | 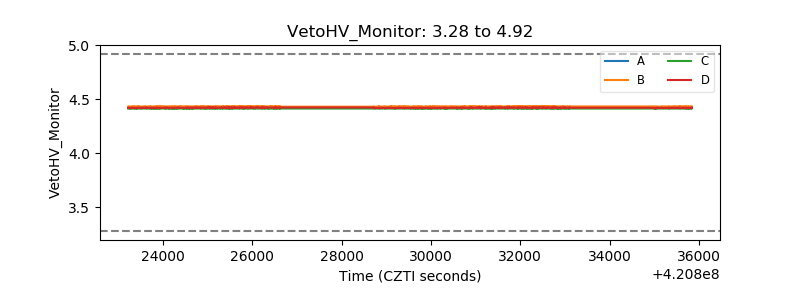 |
| Veto LLD | 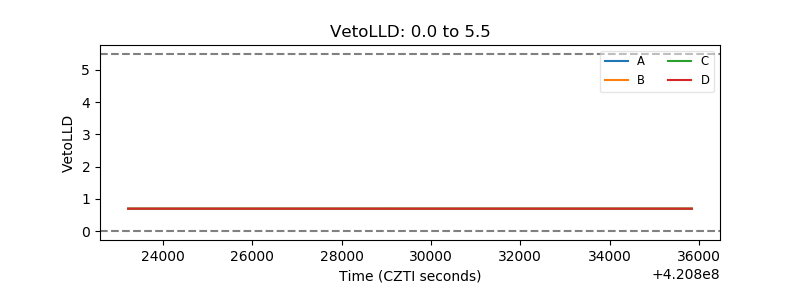 |
| Alpha Counter | 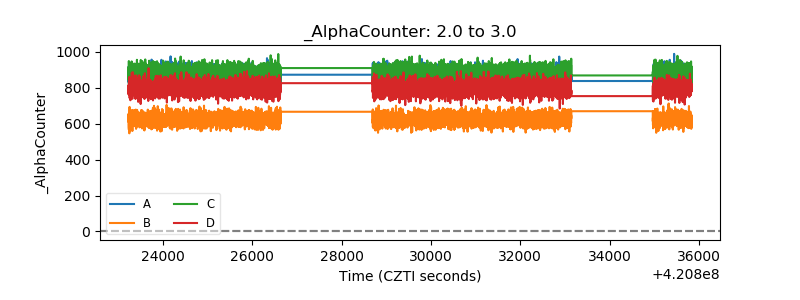 |
| _CPM_Rate | 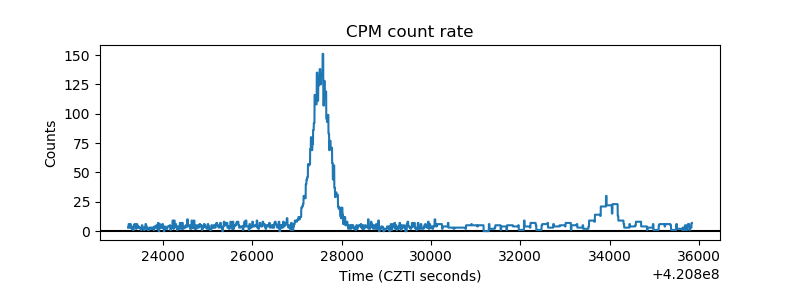 |
| CZT Counter | 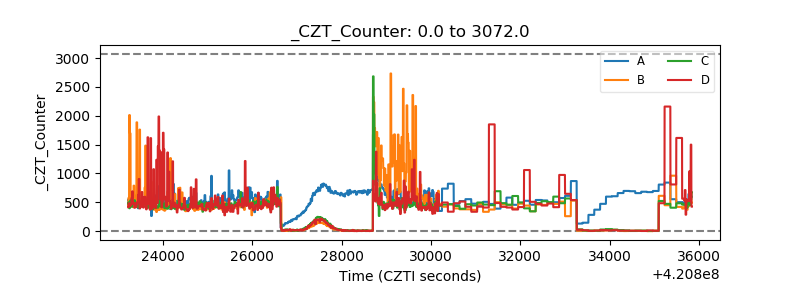 |
| +2.5 Volts monitor | 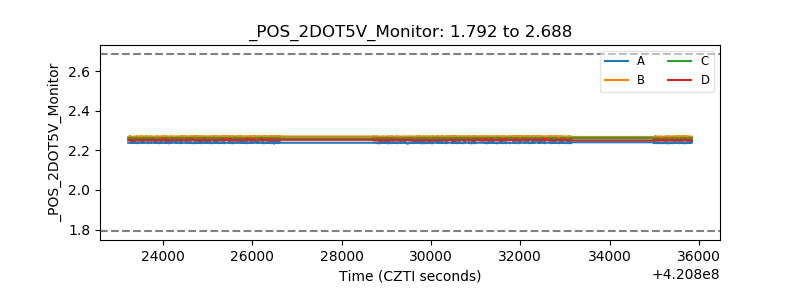 |
| +5 Volts monitor |  |
| _ROLL_ROT | 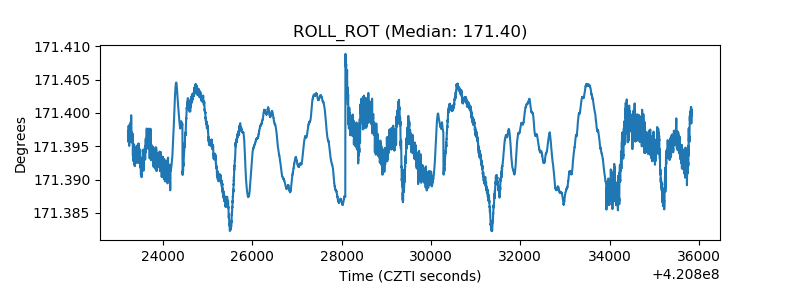 |
| _Roll_DEC | 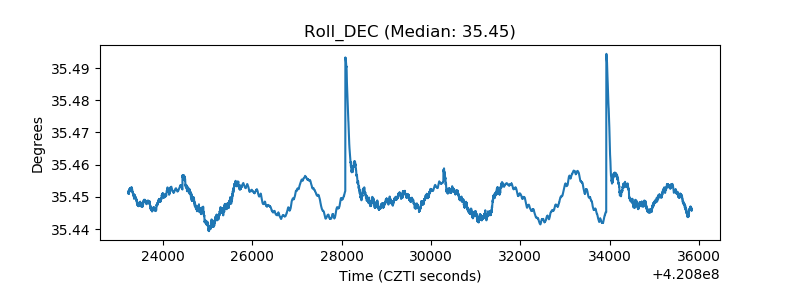 |
| _Roll_RA | 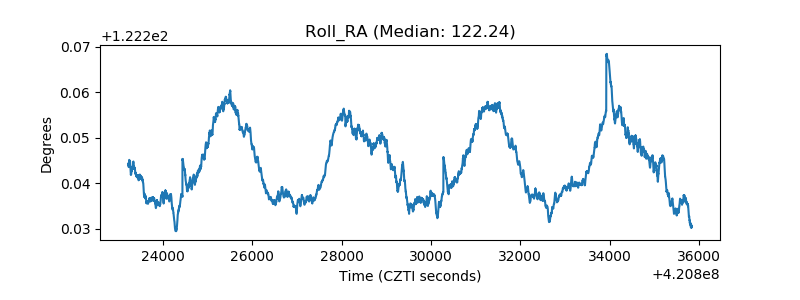 |
| Veto Counter | 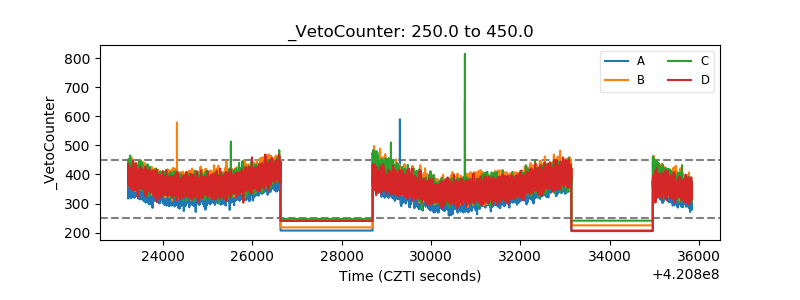 |