| Param | Original file | Final file |
|---|---|---|
| Filename | modeM0/AS1A12_095T02_9000005596_41073cztM0_level2.fits | modeM0/AS1A12_095T02_9000005596_41073cztM0_level2_quad_clean.evt |
| Size (bytes) | 358,623,360 | 91,811,520 |
| Size | 342.0 MB | 87.6 MB |
| Events in quadrant A | 3,151,522 | 617,233 |
| Events in quadrant B | 2,681,665 | 627,454 |
| Events in quadrant C | 2,769,325 | 600,002 |
| Events in quadrant D | 4,233,731 | 540,590 |
| Mode M0 | |||
|---|---|---|---|
| Quadrant | BADHDUFLAG | Total packets | Discarded packets |
| A | 0 | 12812 | 3 |
| B | 0 | 11919 | 2 |
| C | 0 | 11803 | 2 |
| D | 0 | 16478 | 2 |
| Mode SS | |||
|---|---|---|---|
| Quadrant | BADHDUFLAG | Total packets | Discarded packets |
| A | 0 | 116 | 0 |
| B | 0 | 116 | 0 |
| C | 0 | 116 | 0 |
| D | 0 | 116 | 0 |
| Mode M9 | |||
|---|---|---|---|
| Quadrant | BADHDUFLAG | Total packets | Discarded packets |
| A | 0 | 19 | 0 |
| B | 0 | 19 | 0 |
| C | 0 | 19 | 0 |
| D | 0 | 20 | 0 |
| Quadrant | Total seconds | Saturated seconds | Saturation percentage |
|---|---|---|---|
| A | 5637 | 18 | 0.319319% |
| B | 5637 | 33 | 0.585418% |
| C | 5637 | 37 | 0.656378% |
| D | 5637 | 255 | 4.523683% |
Noise dominated data is calculated using 1-second bins in cleaned event files. If a bin has >2000 counts, and if more than 50% of those come from <1% of pixels, then it is considered to be noise-dominated and hence unusable.
| Quadrant | # 1 sec bins | Bins with >0 counts | Bins with >2000 counts | High rate bins dominated by noise | Noise dominated (total time) | Noise dominated (detector-on time) | Marked lightcurve |
|---|---|---|---|---|---|---|---|
| A | 7100 | 5638 | 7 | 7 | 0.10% | 0.12% | 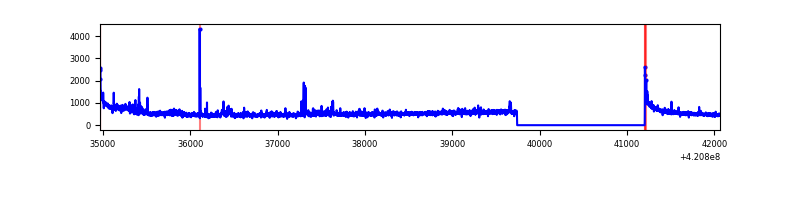 |
| B | 7100 | 5638 | 18 | 18 | 0.25% | 0.32% | 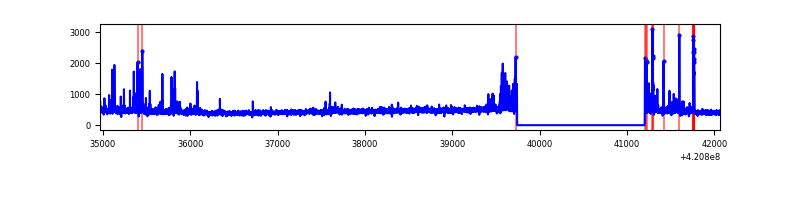 |
| C | 7100 | 5638 | 43 | 43 | 0.61% | 0.76% | 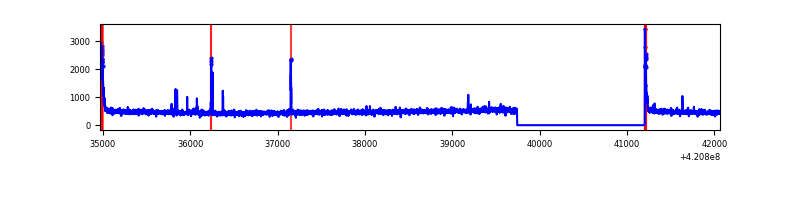 |
| D | 7100 | 5638 | 217 | 217 | 3.06% | 3.85% | 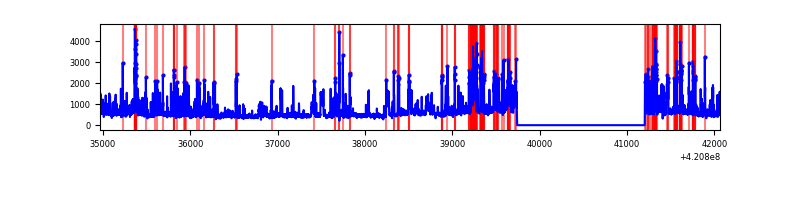 |
Top three noisy pixels from each quadrant. If the there are fewer than three noisy pixels in the level2.evt file, extra rows are filled as -1
| Pixel properties | Quadrant properties | ||||||
|---|---|---|---|---|---|---|---|
| Quadrant | DetID | PixID | Counts | Sigma | Mean | Median | Sigma |
| A | 10 | 83 | 550025 | 4312.73 | 617 | 605 | 127.4 |
| A | 12 | 189 | 173604 | 1357.98 | 617 | 605 | 127.4 |
| A | 13 | 248 | 30170 | 232.07 | 617 | 605 | 127.4 |
| B | 5 | 255 | 145428 | 1205.43 | 615 | 599 | 120.1 |
| B | 0 | 186 | 60022 | 494.58 | 615 | 599 | 120.1 |
| B | 0 | 190 | 21675 | 175.41 | 615 | 599 | 120.1 |
| C | 15 | 214 | 238919 | 1683.54 | 603 | 607 | 141.6 |
| C | 0 | 10 | 121888 | 856.78 | 603 | 607 | 141.6 |
| C | 14 | 254 | 39347 | 273.68 | 603 | 607 | 141.6 |
| D | 12 | 79 | 1424826 | 9682.84 | 595 | 576 | 147.1 |
| D | 2 | 249 | 157014 | 1063.55 | 595 | 576 | 147.1 |
| D | 13 | 171 | 89255 | 602.89 | 595 | 576 | 147.1 |
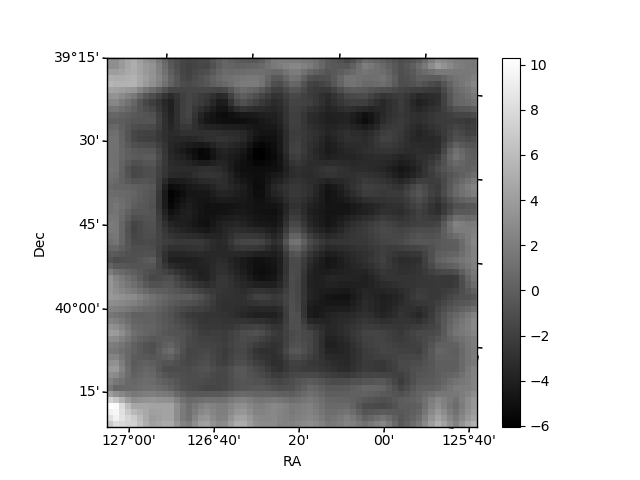
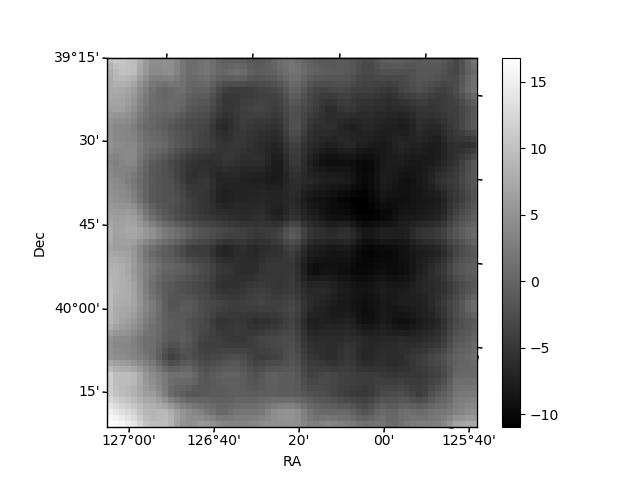
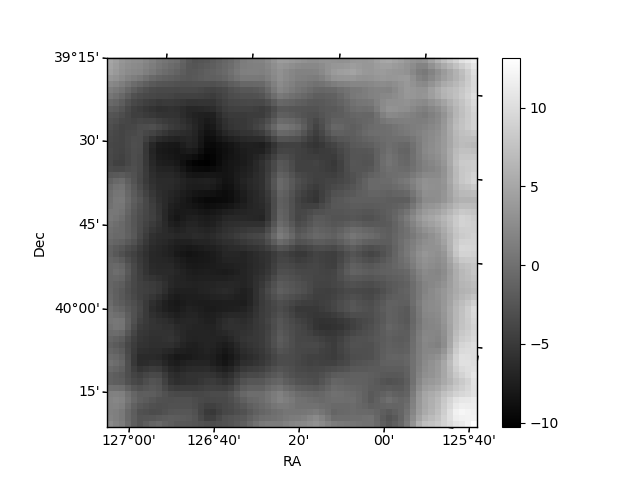
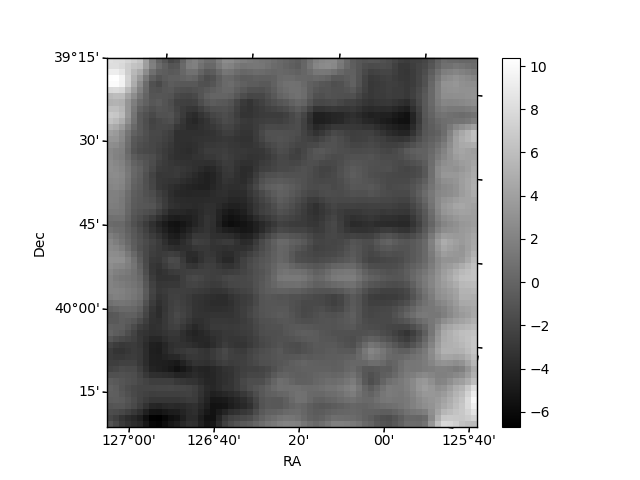
Histogram calculated using DETX and DETY for each event in the final _common_clean file
| Quadrant A | 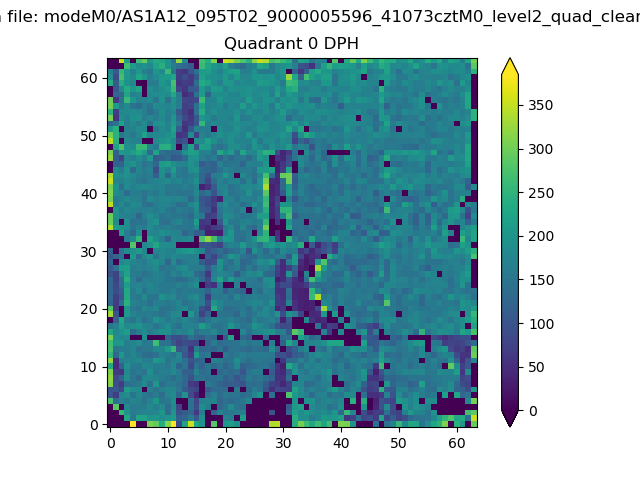 |
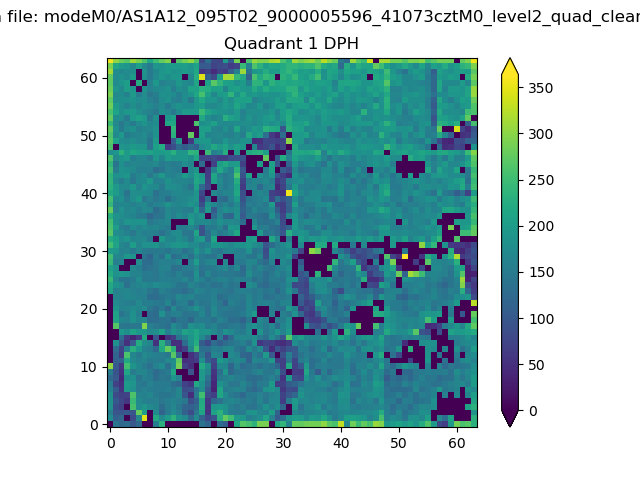 |
Quadrant B |
|---|---|---|---|
| Quadrant D | 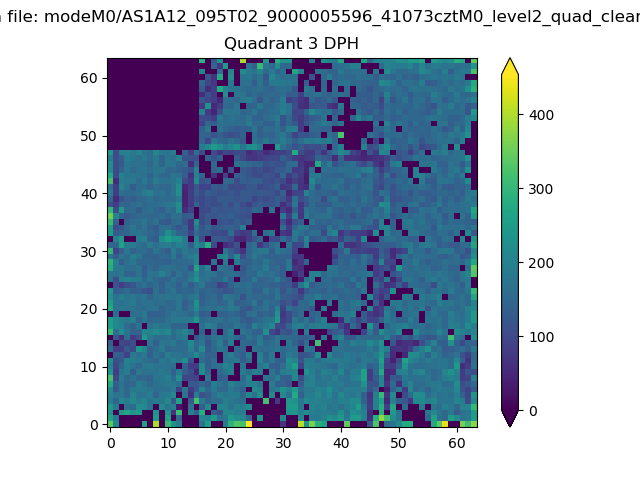 |
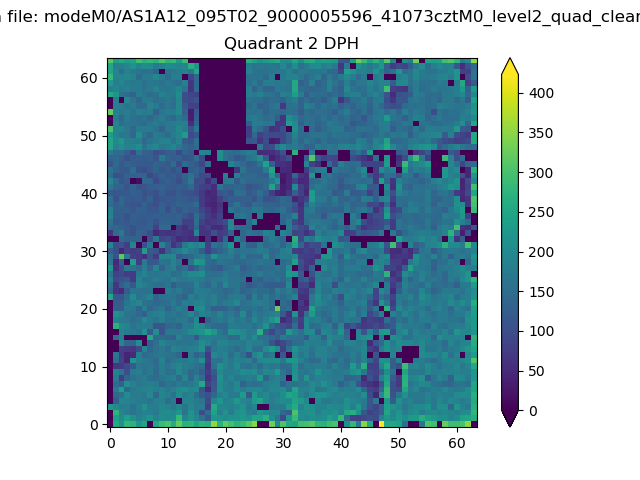 |
Quadrant C |
| Plot type | Count rate plots | Images |
|---|---|---|
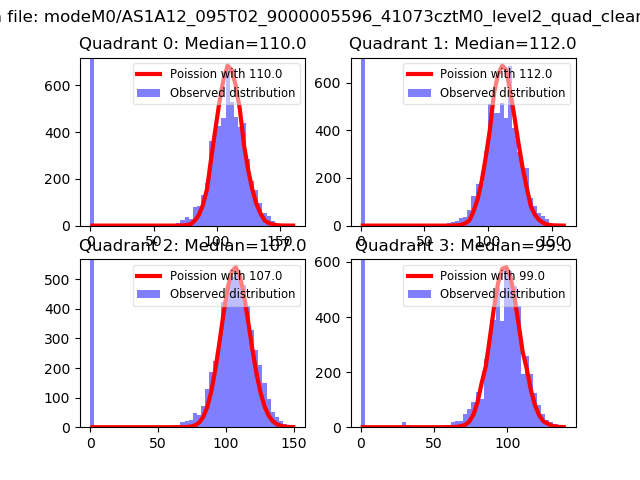
| Comparison with Poisson distribution Blue bars denote a histogram of data divided into 1 sec bins. Red curve is a Poisson curve with rate = median count rate of data. |
 |
 |
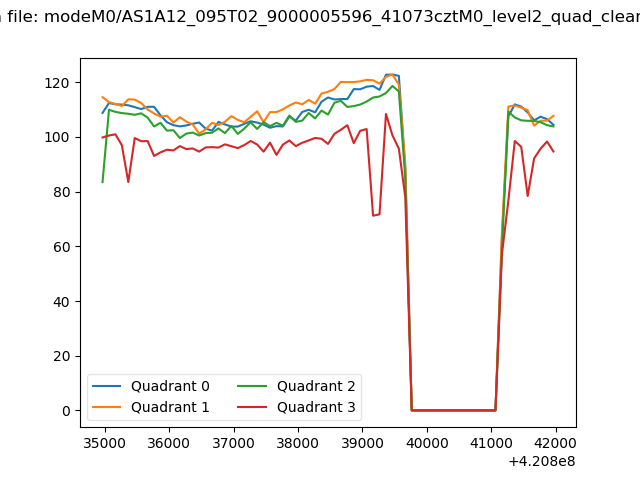
| Quadrant-wise count rates Data is divided into 100 sec bins |
 |
|
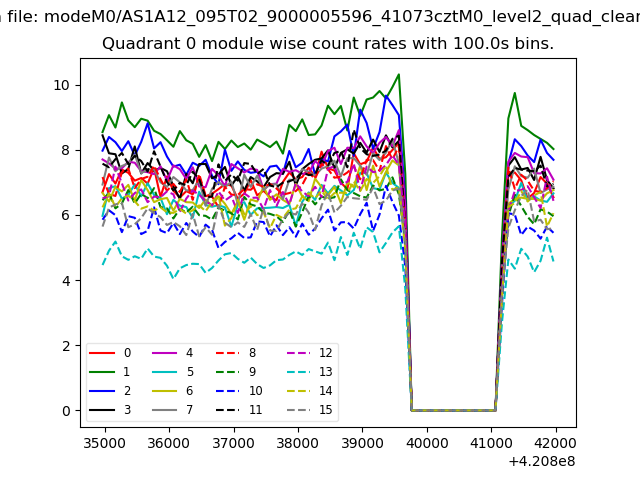
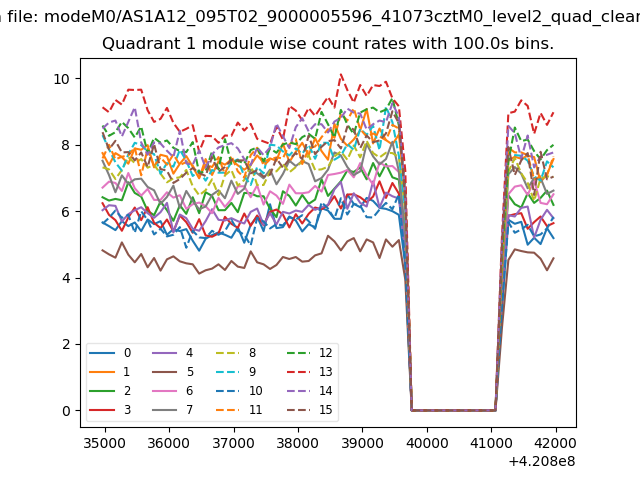
| Module-wise count rates for Quadrant A Data is divided into 100 sec bins |
 |
 |
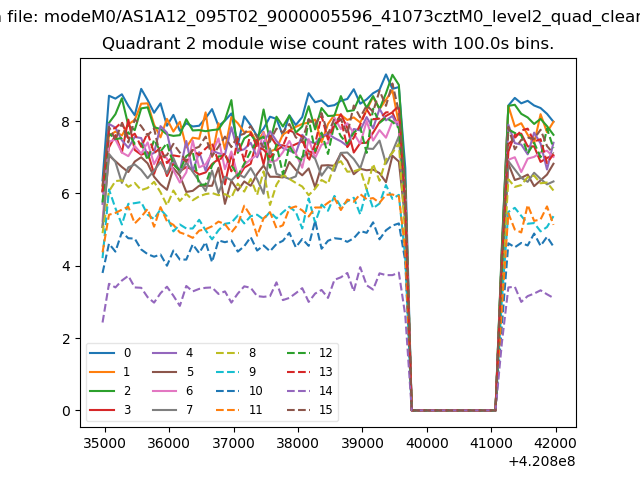
| Module-wise count rates for Quadrant B Data is divided into 100 sec bins |
 |
 |
| Module-wise count rates for Quadrant C Data is divided into 100 sec bins |
 |
 |
| Module-wise count rates for Quadrant D Data is divided into 100 sec bins |
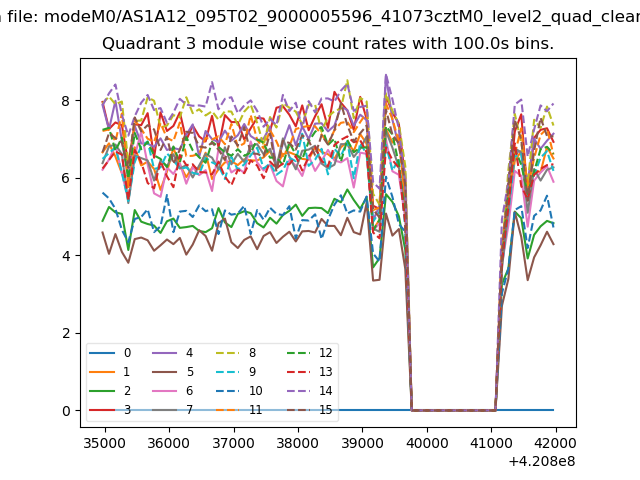 |
 |
| Parameter | Plot |
|---|---|
| CZT HV Monitor | 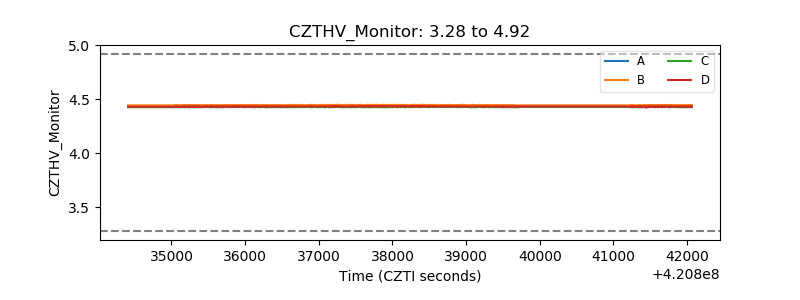 |
| D_VDD | 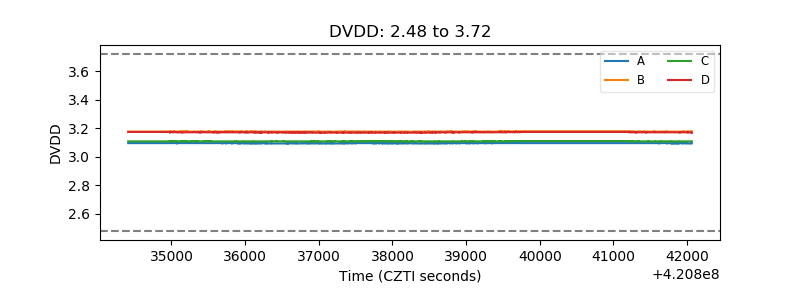 |
| Temperature 1 | 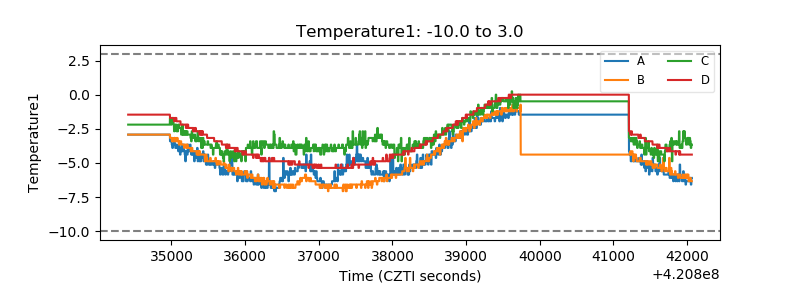 |
| Veto HV Monitor | 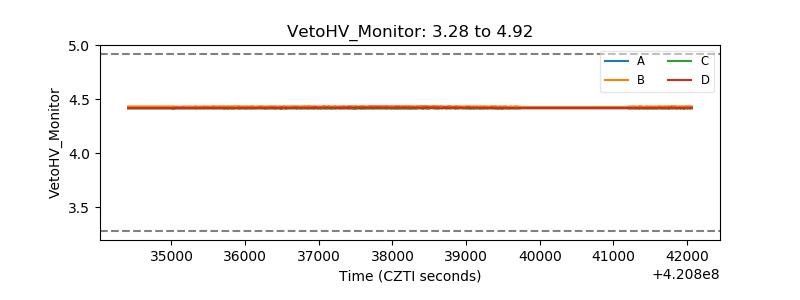 |
| Veto LLD | 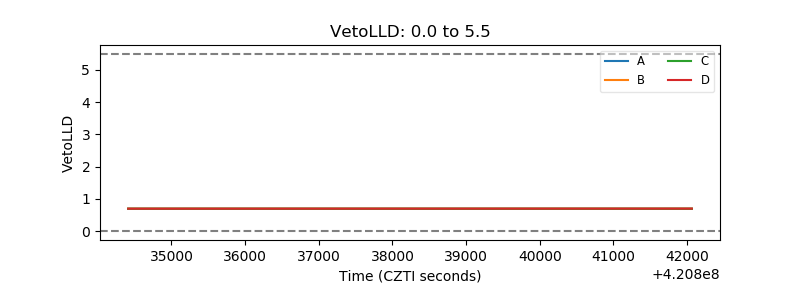 |
| Alpha Counter | 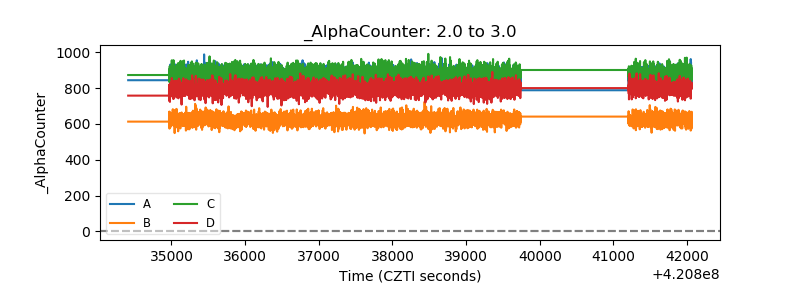 |
| _CPM_Rate | 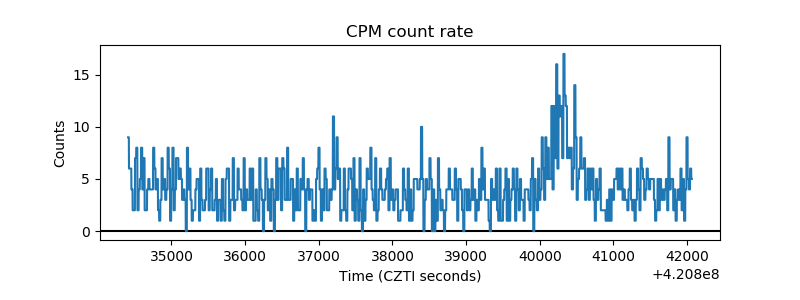 |
| CZT Counter | 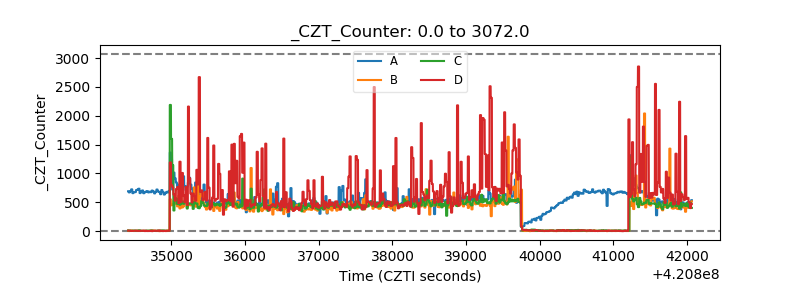 |
| +2.5 Volts monitor | 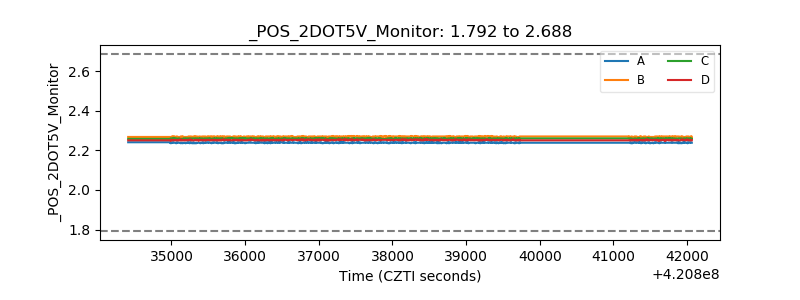 |
| +5 Volts monitor | 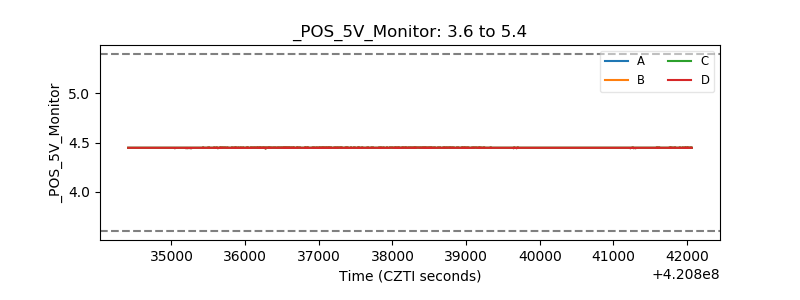 |
| _ROLL_ROT | 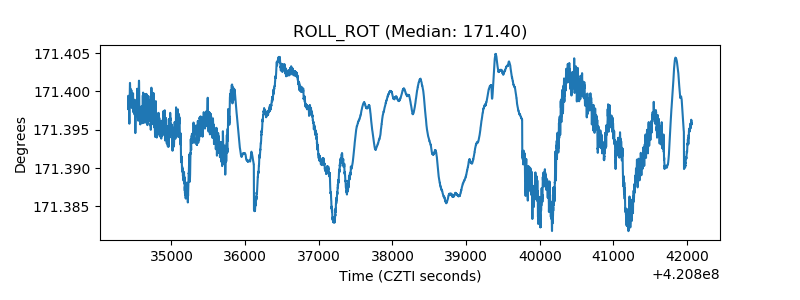 |
| _Roll_DEC | 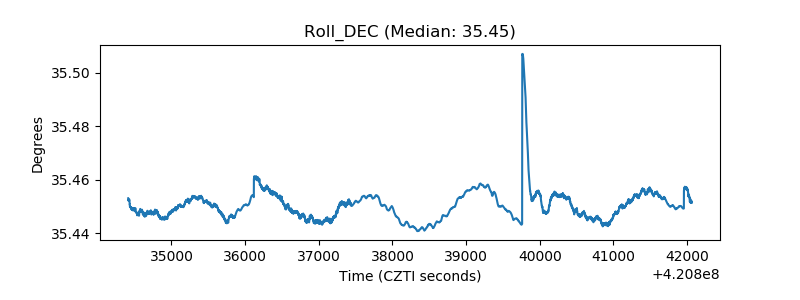 |
| _Roll_RA | 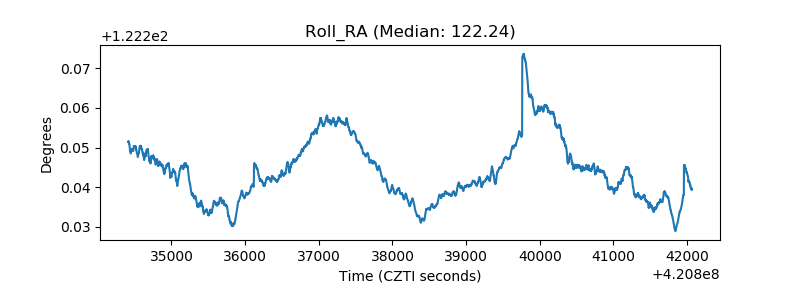 |
| Veto Counter | 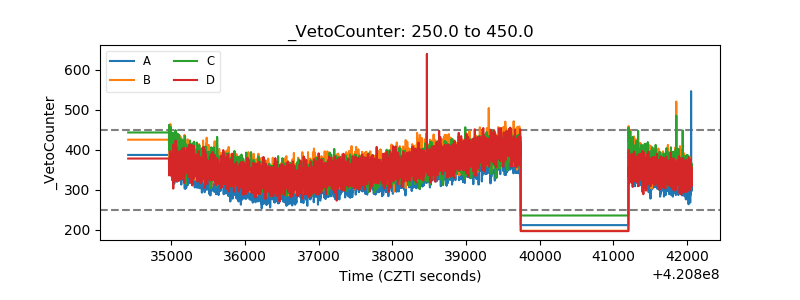 |