| Param | Original file | Final file |
|---|---|---|
| Filename | modeM0/AS1A12_095T02_9000005596_41075cztM0_level2.fits | modeM0/AS1A12_095T02_9000005596_41075cztM0_level2_quad_clean.evt |
| Size (bytes) | 474,649,920 | 92,390,400 |
| Size | 452.7 MB | 88.1 MB |
| Events in quadrant A | 3,526,097 | 645,107 |
| Events in quadrant B | 3,732,950 | 630,095 |
| Events in quadrant C | 3,092,382 | 635,674 |
| Events in quadrant D | 6,749,888 | 465,326 |
| Mode M0 | |||
|---|---|---|---|
| Quadrant | BADHDUFLAG | Total packets | Discarded packets |
| A | 0 | 14281 | 3 |
| B | 0 | 15359 | 2 |
| C | 0 | 12965 | 2 |
| D | 0 | 24197 | 2 |
| Mode SS | |||
|---|---|---|---|
| Quadrant | BADHDUFLAG | Total packets | Discarded packets |
| A | 0 | 124 | 0 |
| B | 0 | 124 | 0 |
| C | 0 | 124 | 0 |
| D | 0 | 124 | 0 |
| Mode M9 | |||
|---|---|---|---|
| Quadrant | BADHDUFLAG | Total packets | Discarded packets |
| A | 0 | 20 | 0 |
| B | 0 | 20 | 0 |
| C | 0 | 20 | 0 |
| D | 0 | 21 | 0 |
| Quadrant | Total seconds | Saturated seconds | Saturation percentage |
|---|---|---|---|
| A | 6025 | 17 | 0.282158% |
| B | 6025 | 337 | 5.593361% |
| C | 6025 | 52 | 0.863071% |
| D | 6025 | 1405 | 23.319502% |
Noise dominated data is calculated using 1-second bins in cleaned event files. If a bin has >2000 counts, and if more than 50% of those come from <1% of pixels, then it is considered to be noise-dominated and hence unusable.
| Quadrant | # 1 sec bins | Bins with >0 counts | Bins with >2000 counts | High rate bins dominated by noise | Noise dominated (total time) | Noise dominated (detector-on time) | Marked lightcurve |
|---|---|---|---|---|---|---|---|
| A | 7338 | 6026 | 8 | 8 | 0.11% | 0.13% | 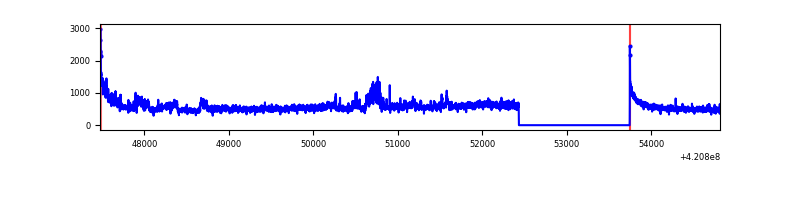 |
| B | 7338 | 6026 | 227 | 227 | 3.09% | 3.77% | 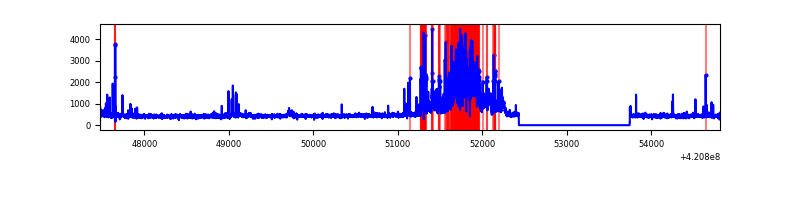 |
| C | 7338 | 6026 | 42 | 42 | 0.57% | 0.70% | 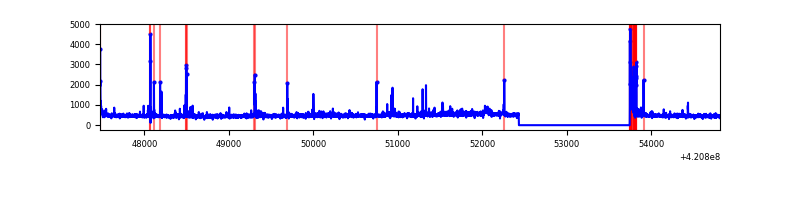 |
| D | 7338 | 6026 | 1172 | 1172 | 15.97% | 19.45% | 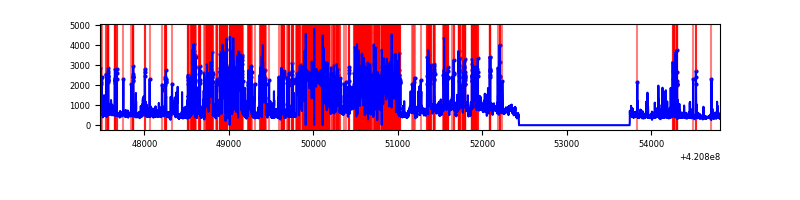 |
Top three noisy pixels from each quadrant. If the there are fewer than three noisy pixels in the level2.evt file, extra rows are filled as -1
| Pixel properties | Quadrant properties | ||||||
|---|---|---|---|---|---|---|---|
| Quadrant | DetID | PixID | Counts | Sigma | Mean | Median | Sigma |
| A | 10 | 83 | 571644 | 4150.97 | 663 | 647 | 137.6 |
| A | 12 | 189 | 372972 | 2706.69 | 663 | 647 | 137.6 |
| A | 13 | 254 | 11771 | 80.87 | 663 | 647 | 137.6 |
| B | 0 | 186 | 902022 | 7065.11 | 647 | 629 | 127.6 |
| B | 5 | 255 | 176531 | 1378.72 | 647 | 629 | 127.6 |
| B | 0 | 229 | 46217 | 357.32 | 647 | 629 | 127.6 |
| C | 15 | 214 | 258954 | 1693.52 | 649 | 655 | 152.5 |
| C | 12 | 249 | 122696 | 800.15 | 649 | 655 | 152.5 |
| C | 14 | 254 | 98315 | 640.3 | 649 | 655 | 152.5 |
| D | 13 | 249 | 2526533 | 17944.36 | 569 | 552 | 140.8 |
| D | 12 | 79 | 1553097 | 11029.15 | 569 | 552 | 140.8 |
| D | 2 | 249 | 292431 | 2073.48 | 569 | 552 | 140.8 |
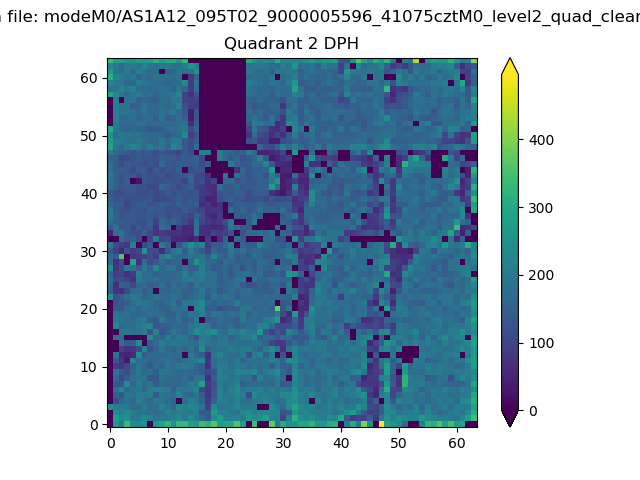
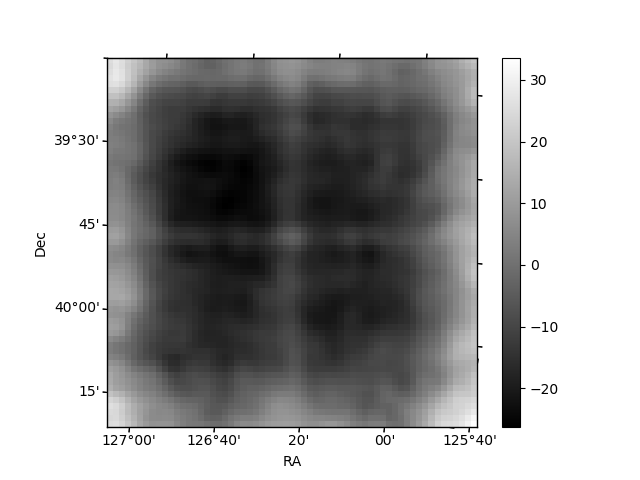
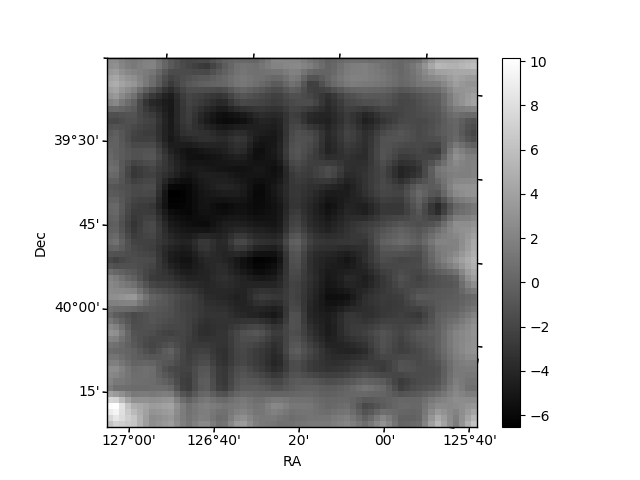
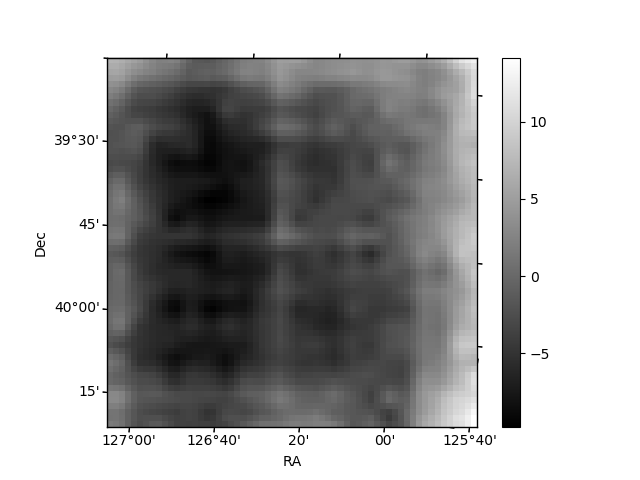
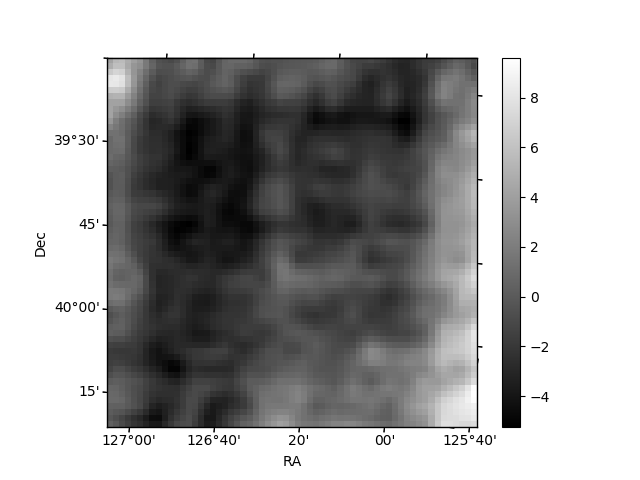
Histogram calculated using DETX and DETY for each event in the final _common_clean file
| Quadrant A | 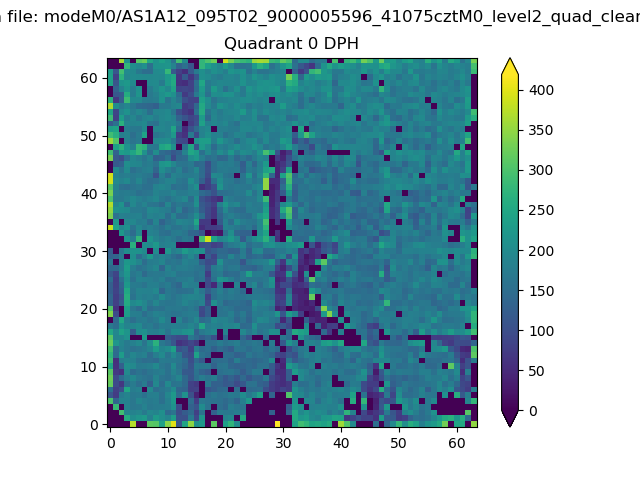 |
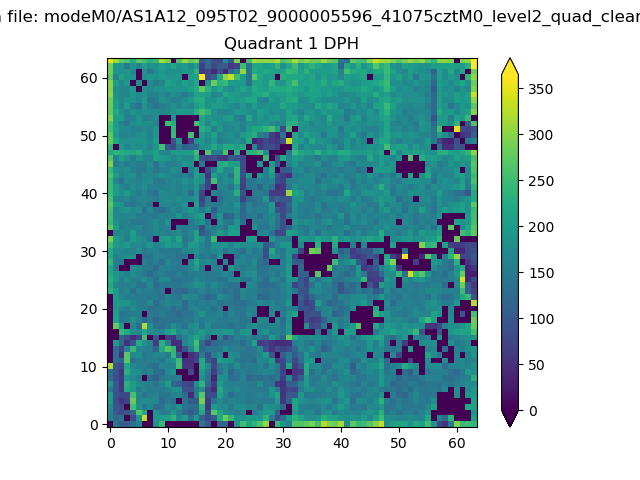 |
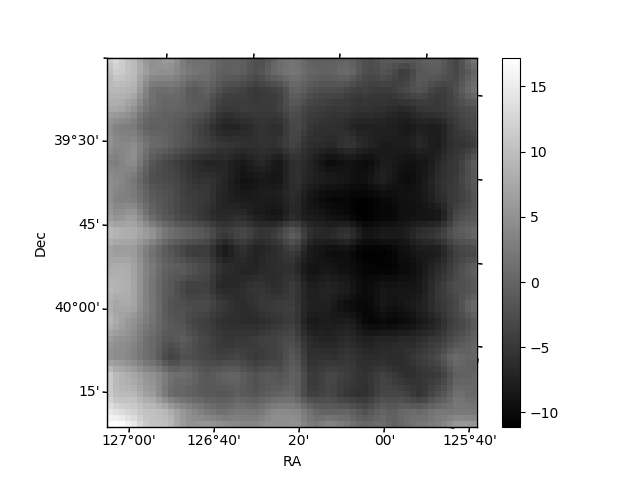
Quadrant B |
|---|---|---|---|
| Quadrant D | 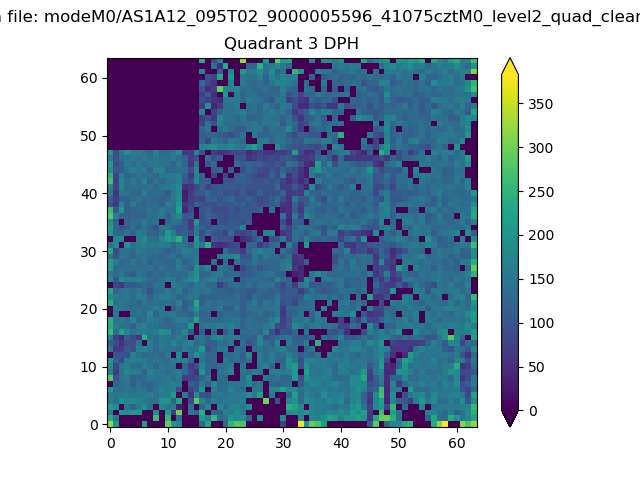 |
 |
Quadrant C |
| Plot type | Count rate plots | Images |
|---|---|---|
| Comparison with Poisson distribution Blue bars denote a histogram of data divided into 1 sec bins. Red curve is a Poisson curve with rate = median count rate of data. |
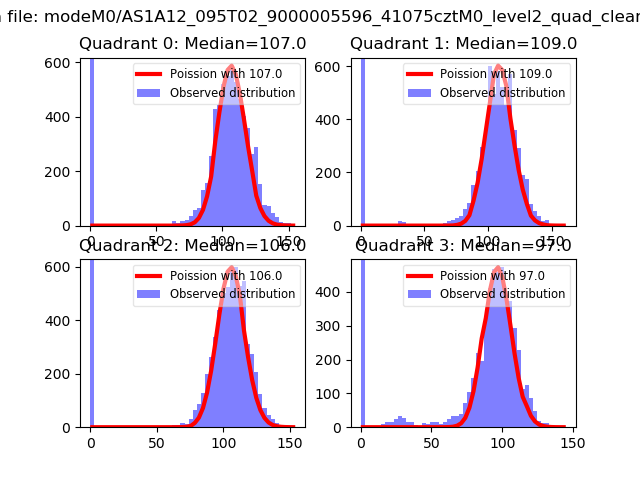 |
 |
| Quadrant-wise count rates Data is divided into 100 sec bins |
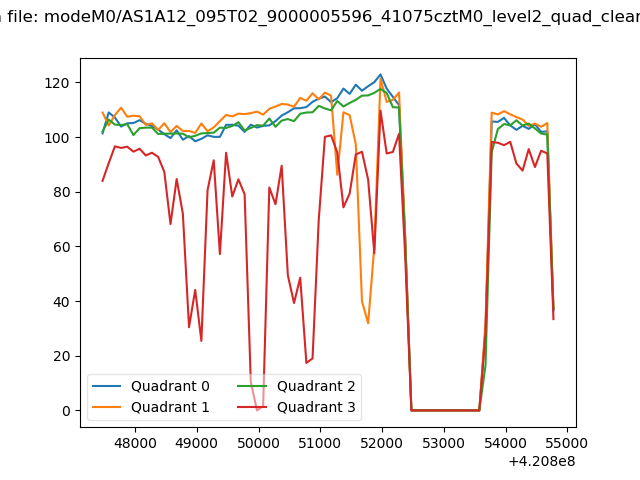 |
|
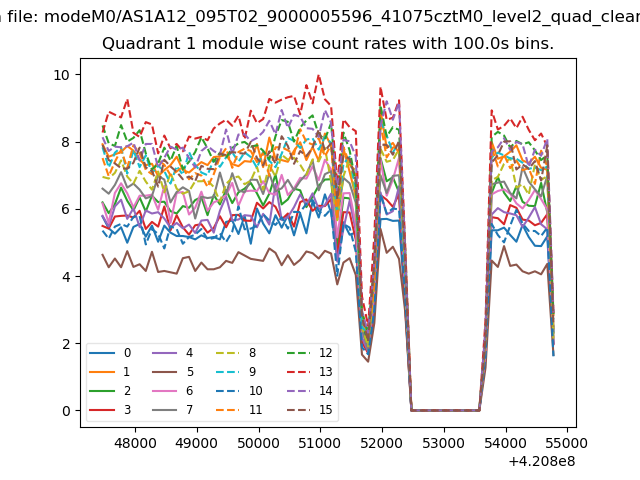
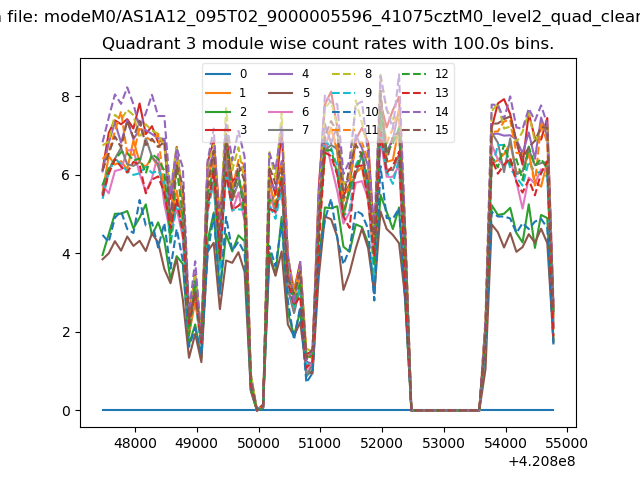
| Module-wise count rates for Quadrant A Data is divided into 100 sec bins |
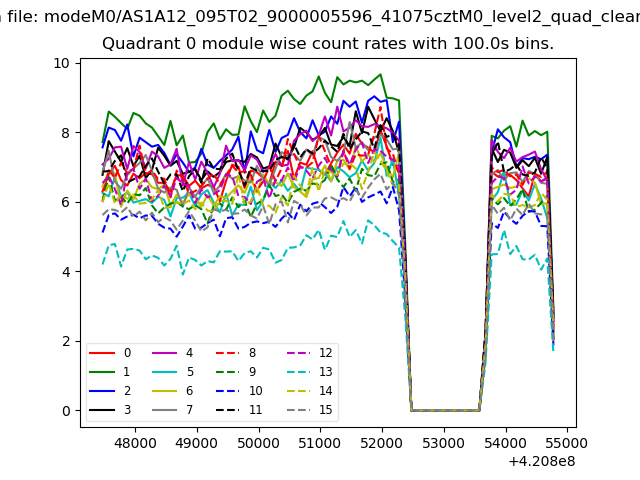 |
 |
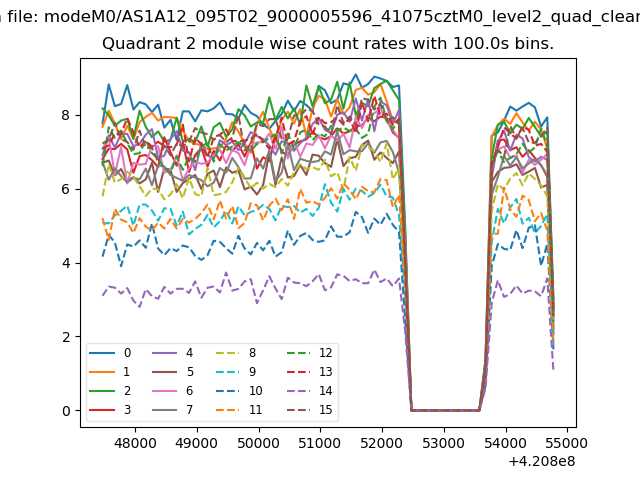
| Module-wise count rates for Quadrant B Data is divided into 100 sec bins |
 |
 |
| Module-wise count rates for Quadrant C Data is divided into 100 sec bins |
 |
 |
| Module-wise count rates for Quadrant D Data is divided into 100 sec bins |
 |
 |
| Parameter | Plot |
|---|---|
| CZT HV Monitor | 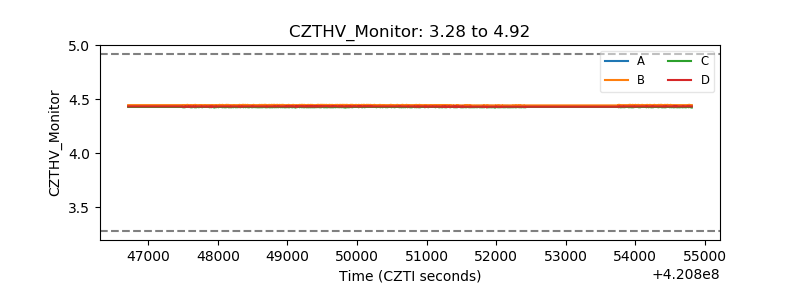 |
| D_VDD | 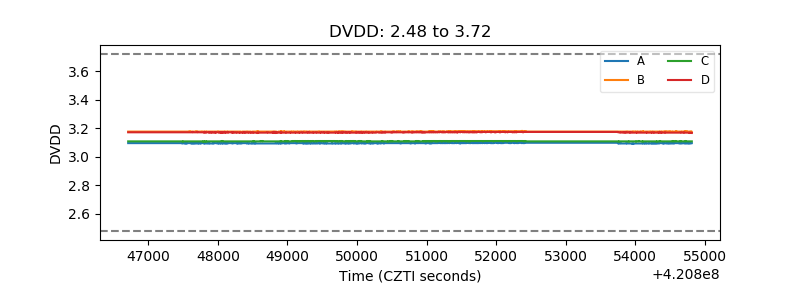 |
| Temperature 1 | 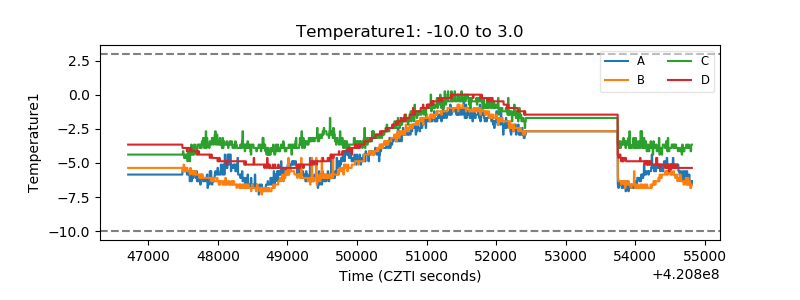 |
| Veto HV Monitor | 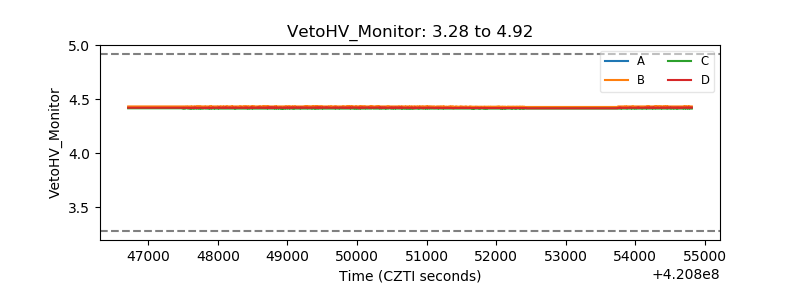 |
| Veto LLD | 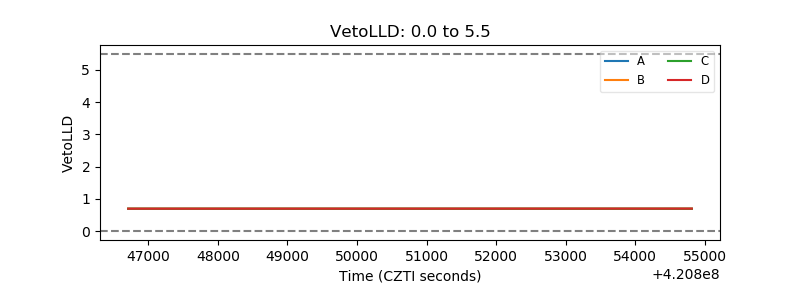 |
| Alpha Counter | 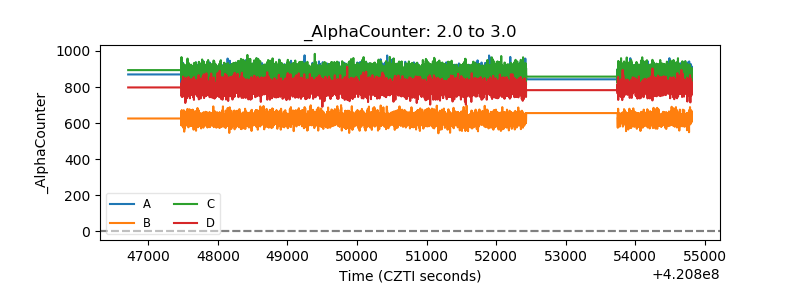 |
| _CPM_Rate | 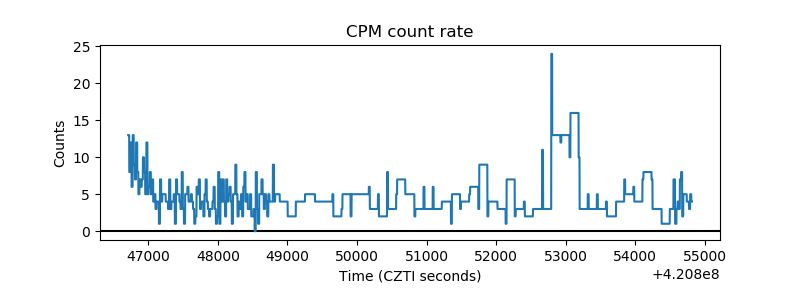 |
| CZT Counter | 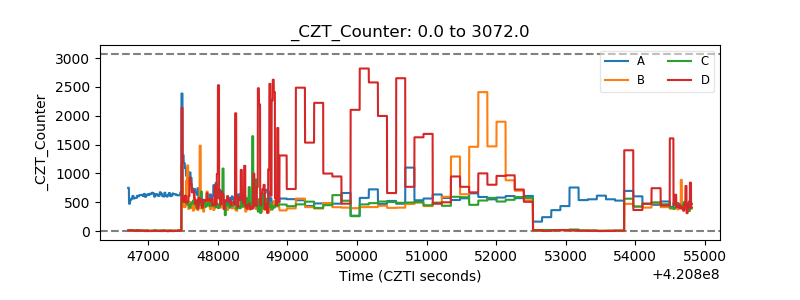 |
| +2.5 Volts monitor |  |
| +5 Volts monitor |  |
| _ROLL_ROT |  |
| _Roll_DEC | 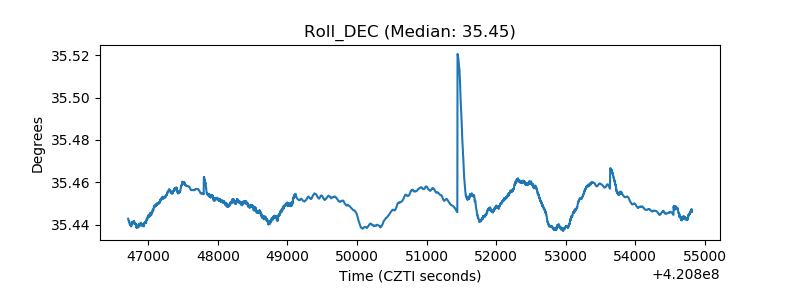 |
| _Roll_RA | 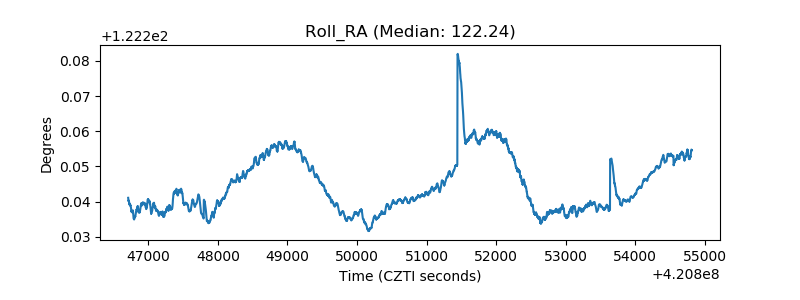 |
| Veto Counter |  |