| Param | Original file | Final file |
|---|---|---|
| Filename | modeM0/AS1A12_095T02_9000005596_41077cztM0_level2.fits | modeM0/AS1A12_095T02_9000005596_41077cztM0_level2_quad_clean.evt |
| Size (bytes) | 694,710,720 | 169,508,160 |
| Size | 662.5 MB | 161.7 MB |
| Events in quadrant A | 5,999,156 | 1,148,343 |
| Events in quadrant B | 7,549,733 | 1,086,052 |
| Events in quadrant C | 5,354,213 | 1,130,662 |
| Events in quadrant D | 5,978,653 | 1,021,943 |
| Mode M0 | |||
|---|---|---|---|
| Quadrant | BADHDUFLAG | Total packets | Discarded packets |
| A | 0 | 24302 | 4 |
| B | 0 | 29875 | 3 |
| C | 0 | 22548 | 3 |
| D | 0 | 25161 | 3 |
| Mode SS | |||
|---|---|---|---|
| Quadrant | BADHDUFLAG | Total packets | Discarded packets |
| A | 0 | 222 | 0 |
| B | 0 | 222 | 0 |
| C | 0 | 222 | 0 |
| D | 0 | 222 | 0 |
| Mode M9 | |||
|---|---|---|---|
| Quadrant | BADHDUFLAG | Total packets | Discarded packets |
| A | 0 | 41 | 0 |
| B | 0 | 41 | 0 |
| C | 0 | 41 | 0 |
| D | 0 | 41 | 0 |
| Quadrant | Total seconds | Saturated seconds | Saturation percentage |
|---|---|---|---|
| A | 10756 | 19 | 0.176646% |
| B | 10756 | 801 | 7.447006% |
| C | 10756 | 71 | 0.660097% |
| D | 10756 | 222 | 2.063964% |
Noise dominated data is calculated using 1-second bins in cleaned event files. If a bin has >2000 counts, and if more than 50% of those come from <1% of pixels, then it is considered to be noise-dominated and hence unusable.
| Quadrant | # 1 sec bins | Bins with >0 counts | Bins with >2000 counts | High rate bins dominated by noise | Noise dominated (total time) | Noise dominated (detector-on time) | Marked lightcurve |
|---|---|---|---|---|---|---|---|
| A | 14904 | 10759 | 8 | 8 | 0.05% | 0.07% | 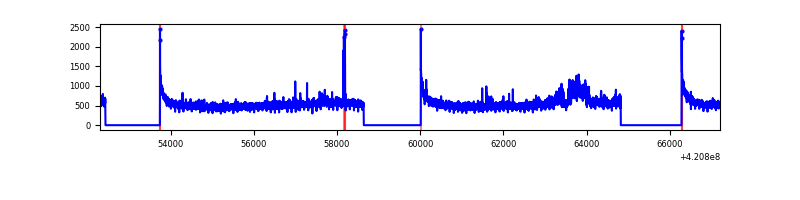 |
| B | 14904 | 10759 | 597 | 597 | 4.01% | 5.55% | 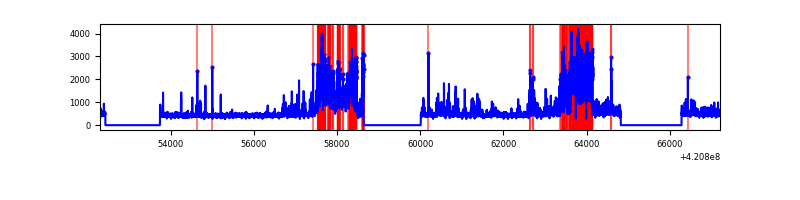 |
| C | 14904 | 10759 | 51 | 51 | 0.34% | 0.47% | 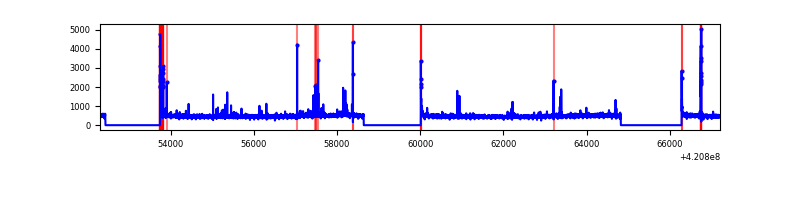 |
| D | 14904 | 10759 | 192 | 192 | 1.29% | 1.78% | 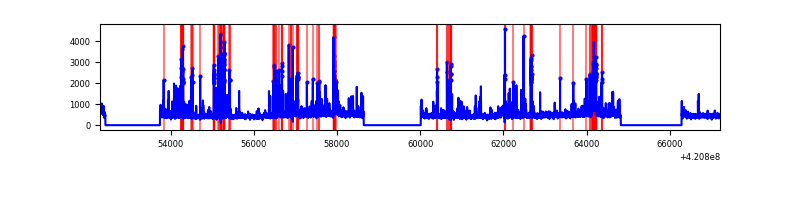 |
Top three noisy pixels from each quadrant. If the there are fewer than three noisy pixels in the level2.evt file, extra rows are filled as -1
| Pixel properties | Quadrant properties | ||||||
|---|---|---|---|---|---|---|---|
| Quadrant | DetID | PixID | Counts | Sigma | Mean | Median | Sigma |
| A | 10 | 83 | 993744 | 4061.55 | 1200 | 1174 | 244.4 |
| A | 12 | 189 | 301036 | 1227.02 | 1200 | 1174 | 244.4 |
| A | 13 | 248 | 40310 | 160.14 | 1200 | 1174 | 244.4 |
| B | 0 | 186 | 2231177 | 9835.97 | 1165 | 1132 | 226.7 |
| B | 5 | 255 | 355482 | 1562.92 | 1165 | 1132 | 226.7 |
| B | 0 | 190 | 317880 | 1397.07 | 1165 | 1132 | 226.7 |
| C | 15 | 214 | 460819 | 1687.89 | 1169 | 1176 | 272.3 |
| C | 14 | 254 | 161437 | 588.51 | 1169 | 1176 | 272.3 |
| C | 12 | 249 | 91965 | 333.39 | 1169 | 1176 | 272.3 |
| D | 13 | 249 | 524651 | 1857.85 | 1162 | 1130 | 281.8 |
| D | 13 | 171 | 323803 | 1145.09 | 1162 | 1130 | 281.8 |
| D | 2 | 249 | 199915 | 705.44 | 1162 | 1130 | 281.8 |
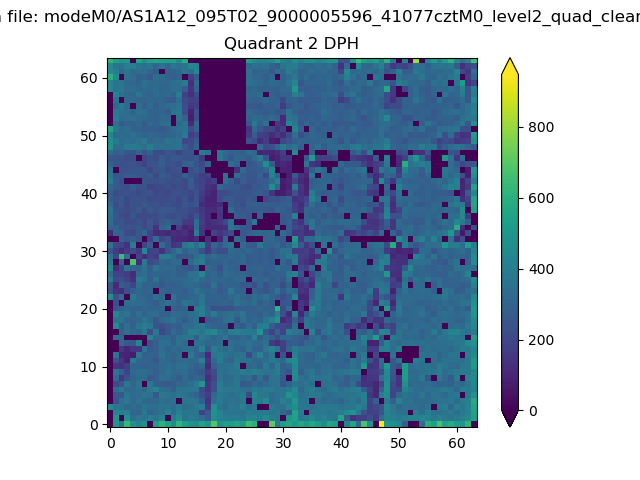
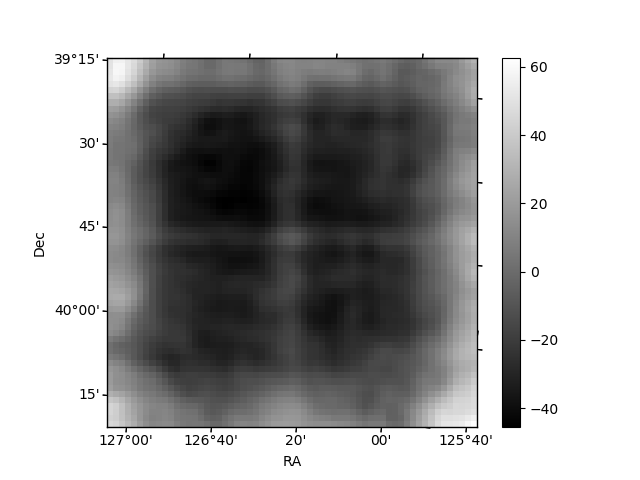
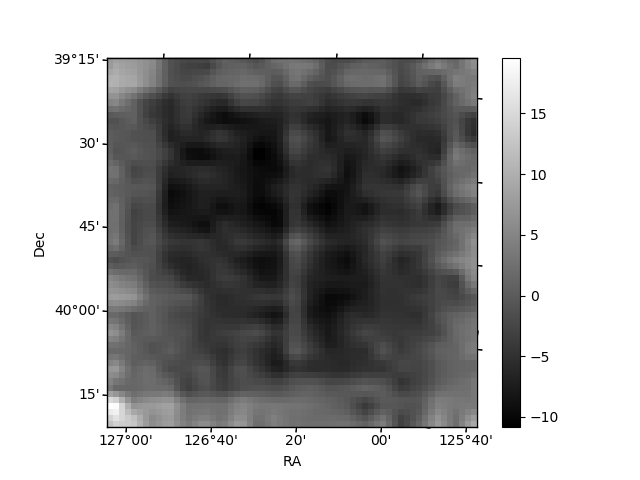
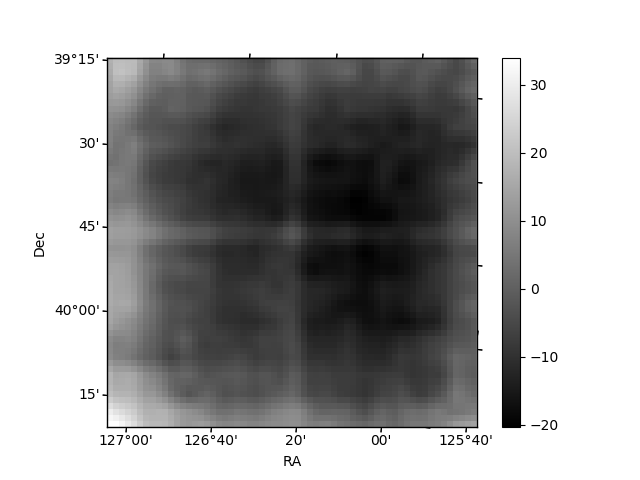
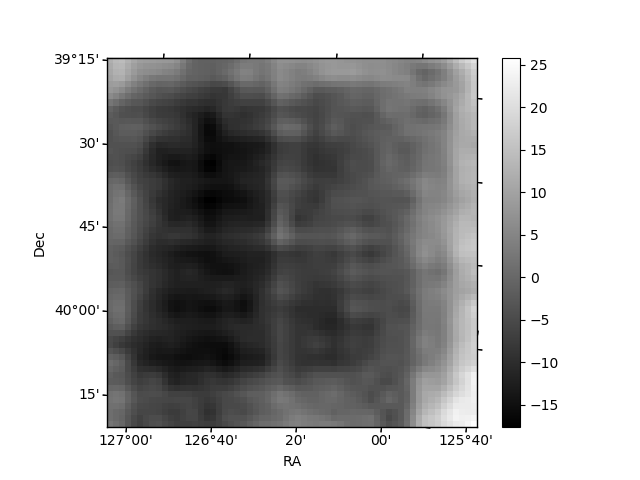
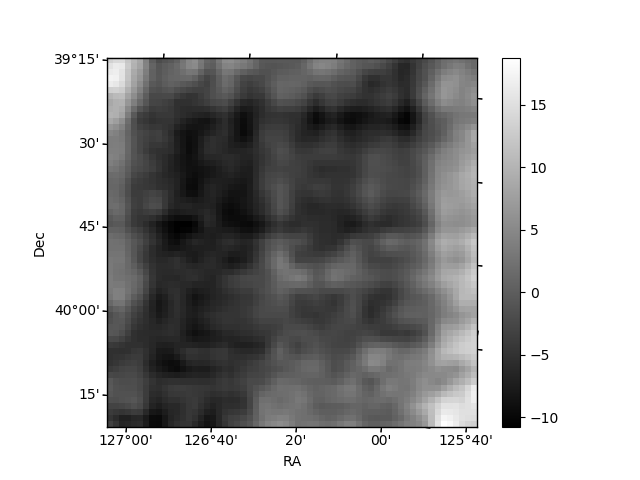
Histogram calculated using DETX and DETY for each event in the final _common_clean file
| Quadrant A | 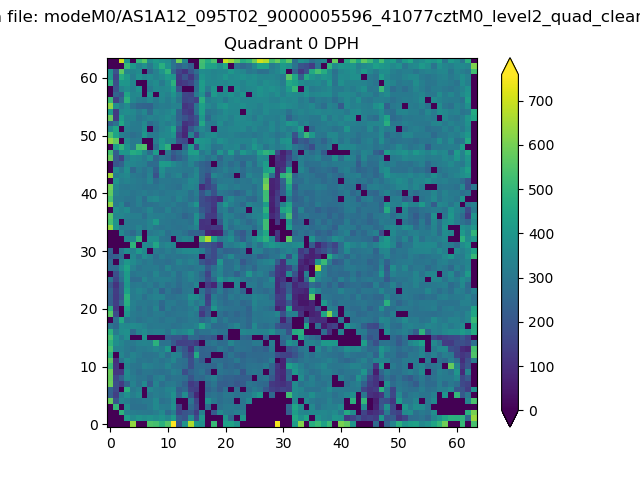 |
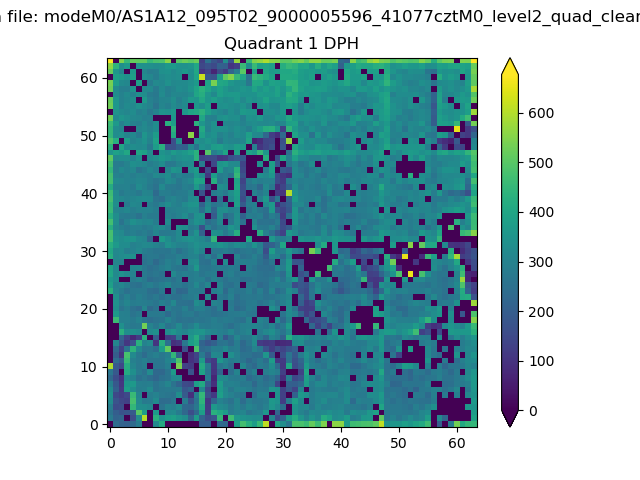 |
Quadrant B |
|---|---|---|---|
| Quadrant D | 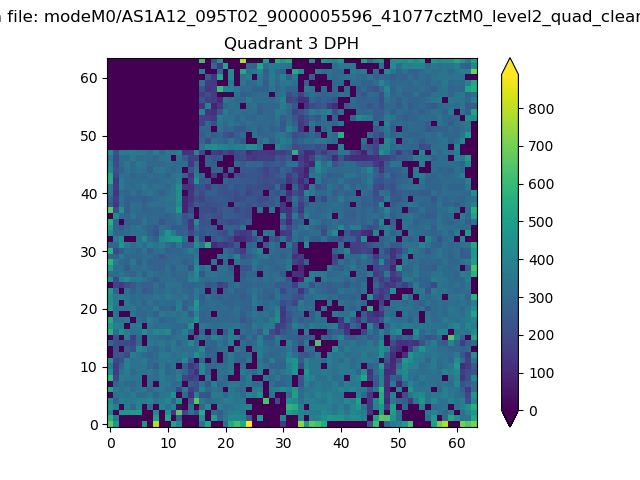 |
 |
Quadrant C |
| Plot type | Count rate plots | Images |
|---|---|---|
| Comparison with Poisson distribution Blue bars denote a histogram of data divided into 1 sec bins. Red curve is a Poisson curve with rate = median count rate of data. |
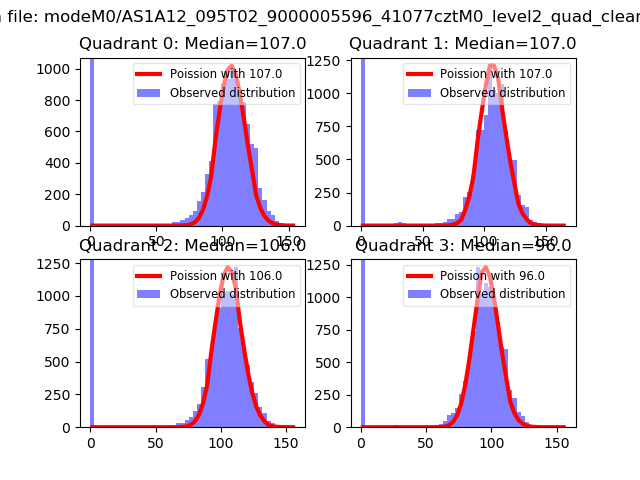 |
 |
| Quadrant-wise count rates Data is divided into 100 sec bins |
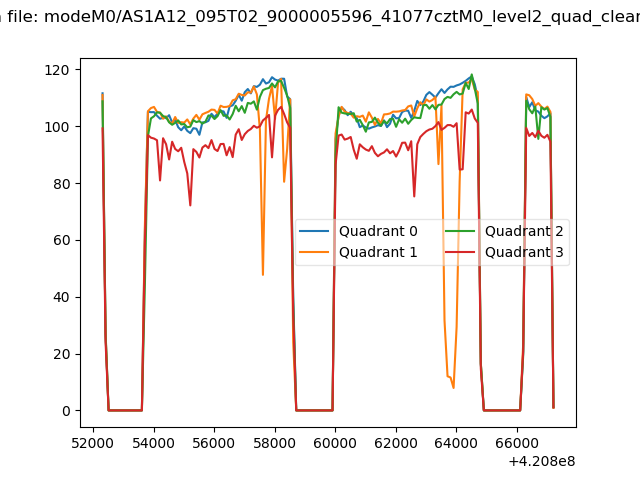 |
|
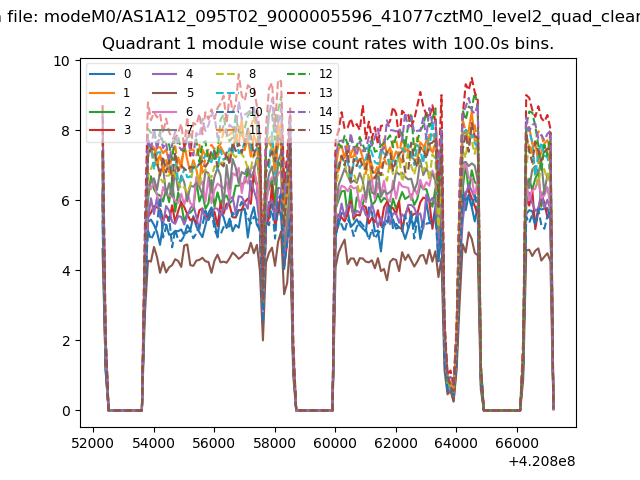
| Module-wise count rates for Quadrant A Data is divided into 100 sec bins |
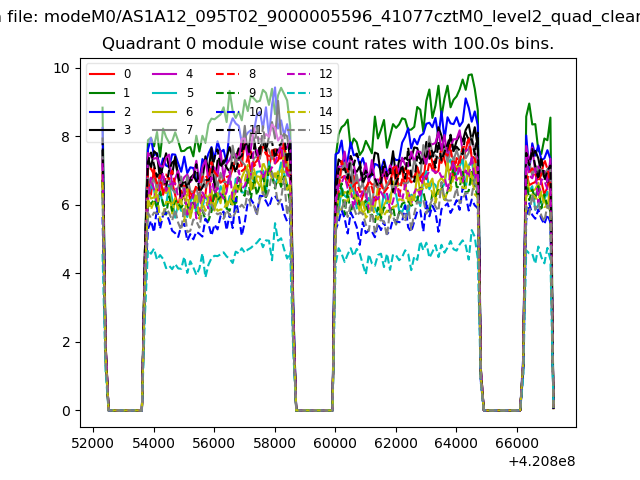 |
 |
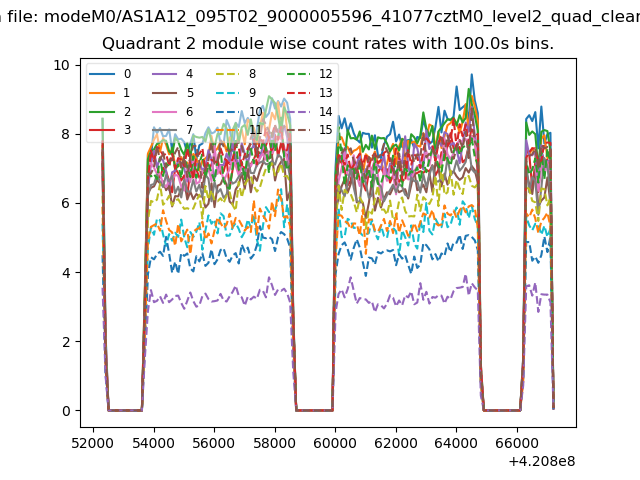
| Module-wise count rates for Quadrant B Data is divided into 100 sec bins |
 |
 |
| Module-wise count rates for Quadrant C Data is divided into 100 sec bins |
 |
 |
| Module-wise count rates for Quadrant D Data is divided into 100 sec bins |
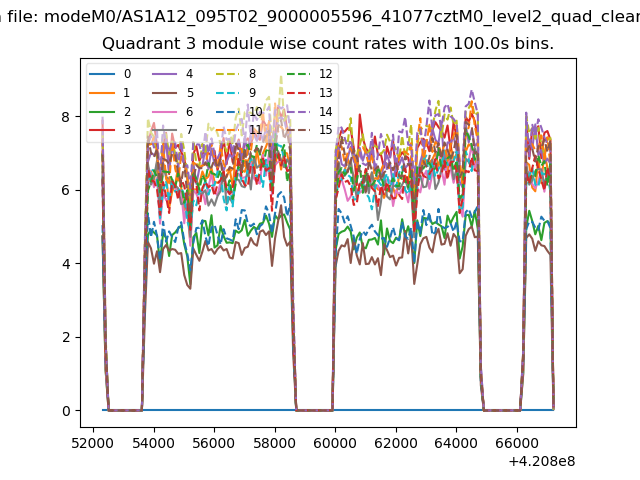 |
 |
| Parameter | Plot |
|---|---|
| CZT HV Monitor | 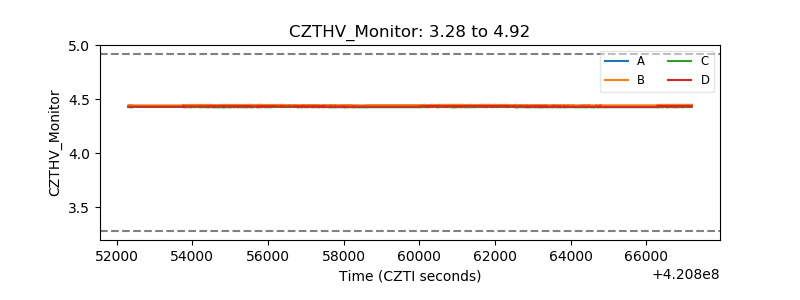 |
| D_VDD | 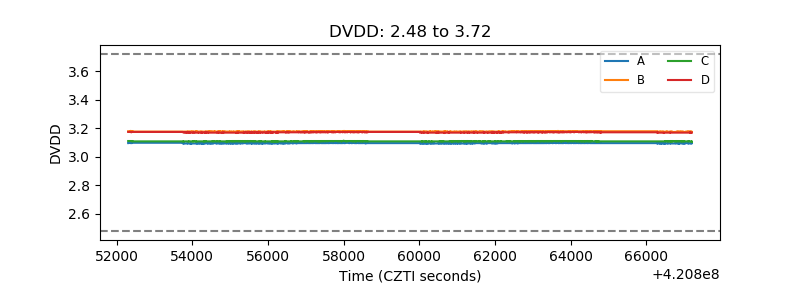 |
| Temperature 1 | 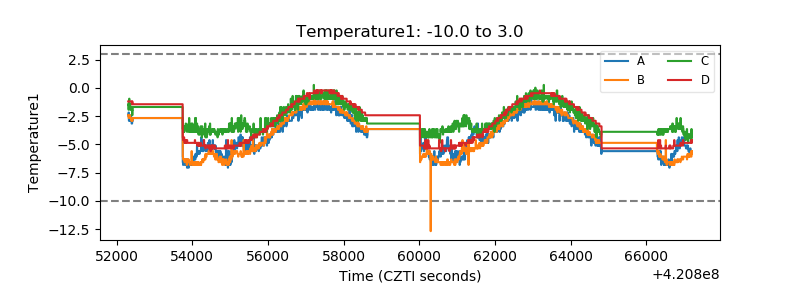 |
| Veto HV Monitor | 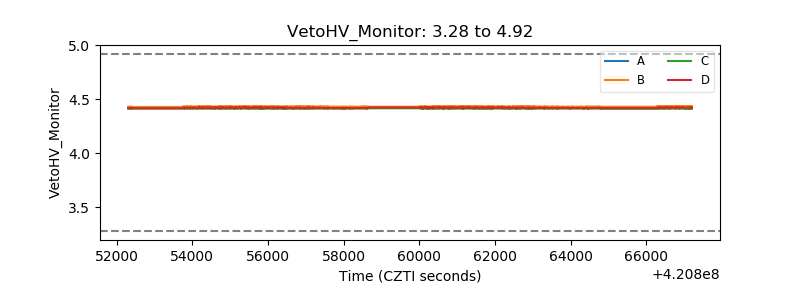 |
| Veto LLD | 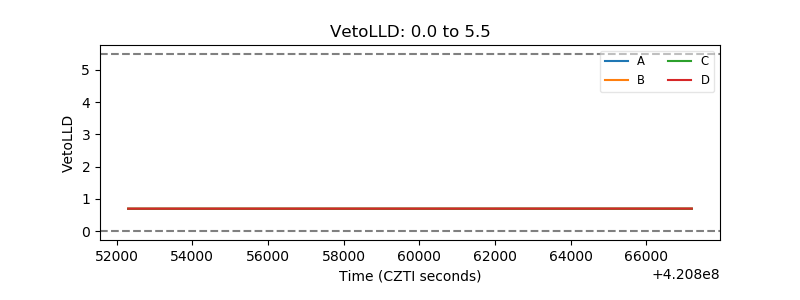 |
| Alpha Counter | 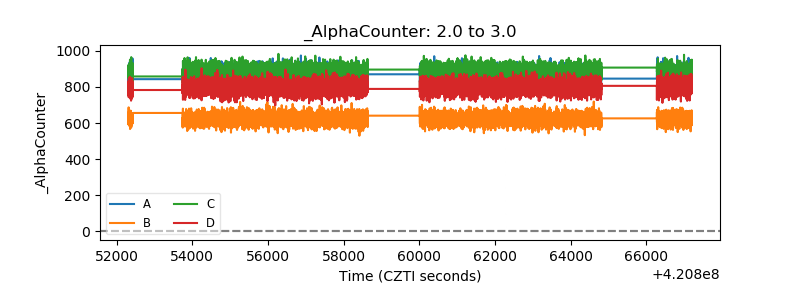 |
| _CPM_Rate | 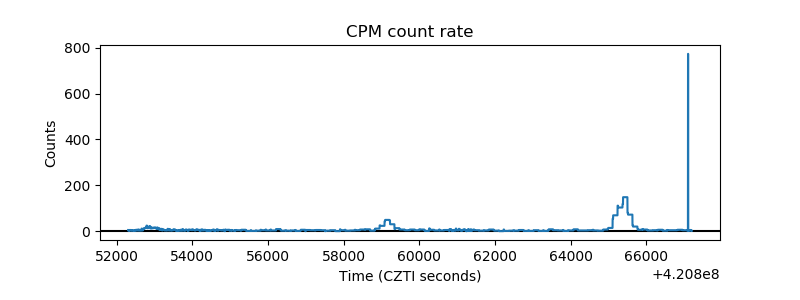 |
| CZT Counter | 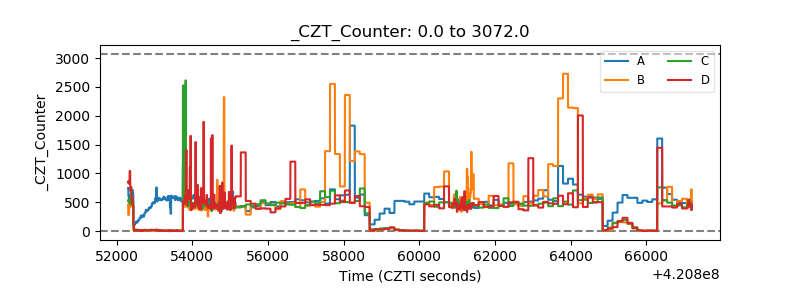 |
| +2.5 Volts monitor | 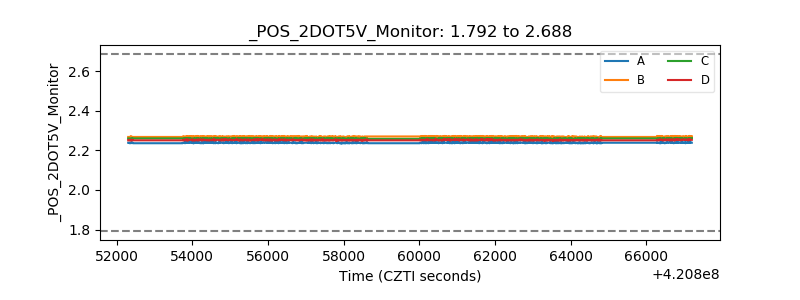 |
| +5 Volts monitor |  |
| _ROLL_ROT | 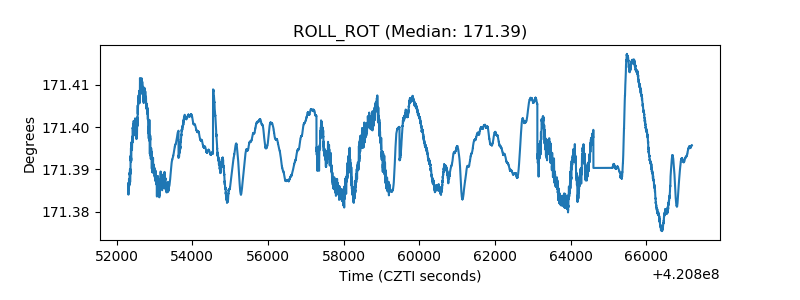 |
| _Roll_DEC | 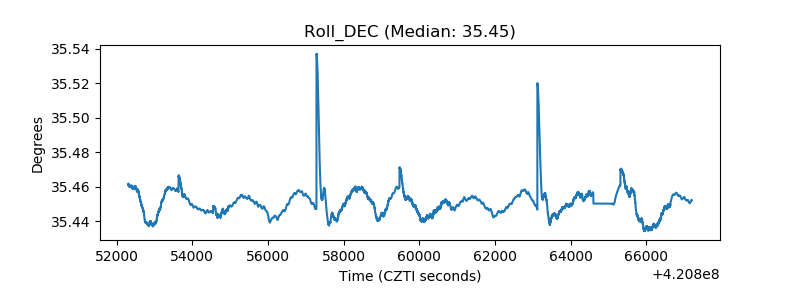 |
| _Roll_RA | 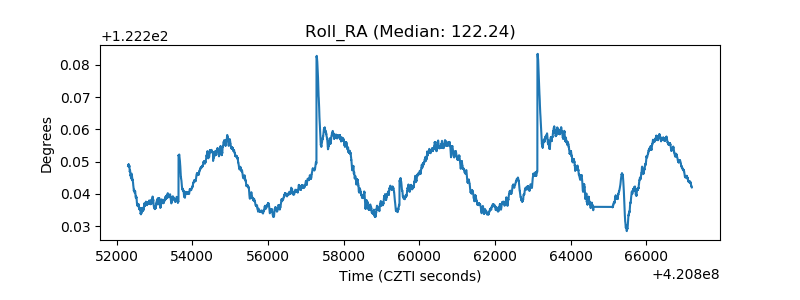 |
| Veto Counter | 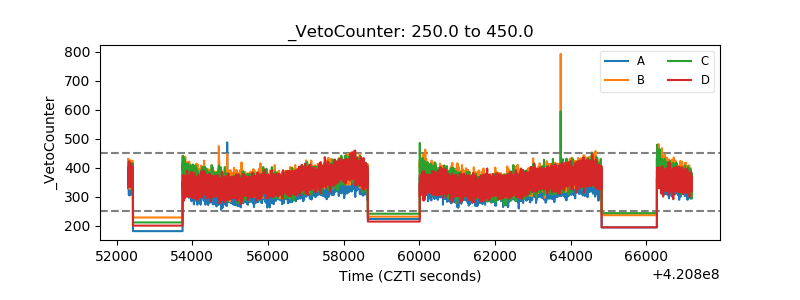 |