| Param | Original file | Final file |
|---|---|---|
| Filename | modeM0/AS1A12_095T02_9000005596_41078cztM0_level2.fits | modeM0/AS1A12_095T02_9000005596_41078cztM0_level2_quad_clean.evt |
| Size (bytes) | 327,093,120 | 90,184,320 |
| Size | 311.9 MB | 86.0 MB |
| Events in quadrant A | 3,034,891 | 602,372 |
| Events in quadrant B | 3,136,264 | 608,273 |
| Events in quadrant C | 2,759,642 | 589,428 |
| Events in quadrant D | 2,746,707 | 543,742 |
| Mode M0 | |||
|---|---|---|---|
| Quadrant | BADHDUFLAG | Total packets | Discarded packets |
| A | 0 | 12190 | 3 |
| B | 0 | 12921 | 2 |
| C | 0 | 11566 | 2 |
| D | 0 | 11963 | 2 |
| Mode SS | |||
|---|---|---|---|
| Quadrant | BADHDUFLAG | Total packets | Discarded packets |
| A | 0 | 114 | 0 |
| B | 0 | 114 | 0 |
| C | 0 | 114 | 0 |
| D | 0 | 114 | 0 |
| Mode M9 | |||
|---|---|---|---|
| Quadrant | BADHDUFLAG | Total packets | Discarded packets |
| A | 0 | 26 | 0 |
| B | 0 | 26 | 0 |
| C | 0 | 26 | 0 |
| D | 0 | 27 | 0 |
| Quadrant | Total seconds | Saturated seconds | Saturation percentage |
|---|---|---|---|
| A | 5522 | 13 | 0.235422% |
| B | 5522 | 144 | 2.607751% |
| C | 5522 | 38 | 0.688156% |
| D | 5522 | 25 | 0.452735% |
Noise dominated data is calculated using 1-second bins in cleaned event files. If a bin has >2000 counts, and if more than 50% of those come from <1% of pixels, then it is considered to be noise-dominated and hence unusable.
| Quadrant | # 1 sec bins | Bins with >0 counts | Bins with >2000 counts | High rate bins dominated by noise | Noise dominated (total time) | Noise dominated (detector-on time) | Marked lightcurve |
|---|---|---|---|---|---|---|---|
| A | 7134 | 5523 | 3 | 3 | 0.04% | 0.05% | 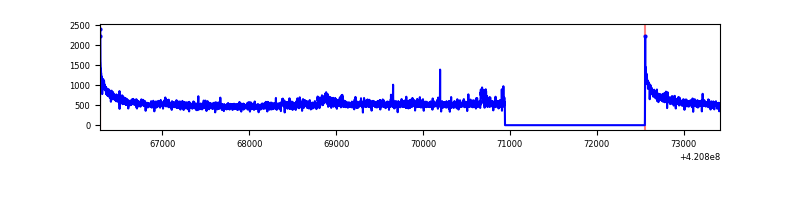 |
| B | 7134 | 5523 | 111 | 111 | 1.56% | 2.01% | 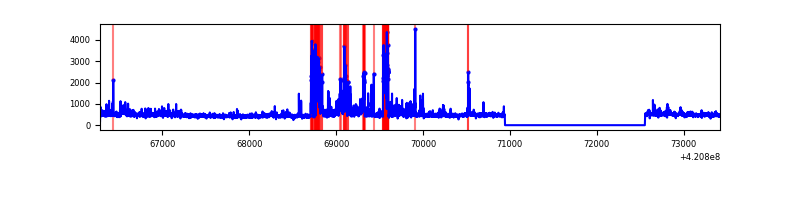 |
| C | 7134 | 5523 | 26 | 26 | 0.36% | 0.47% | 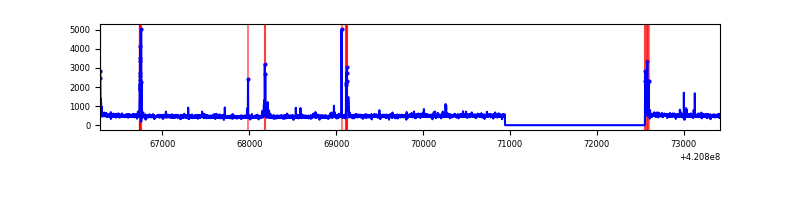 |
| D | 7134 | 5523 | 17 | 17 | 0.24% | 0.31% | 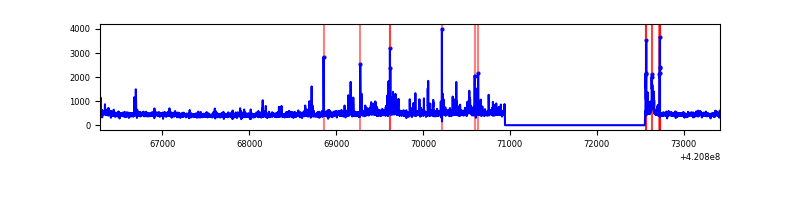 |
Top three noisy pixels from each quadrant. If the there are fewer than three noisy pixels in the level2.evt file, extra rows are filled as -1
| Pixel properties | Quadrant properties | ||||||
|---|---|---|---|---|---|---|---|
| Quadrant | DetID | PixID | Counts | Sigma | Mean | Median | Sigma |
| A | 10 | 83 | 540100 | 4189.63 | 622 | 607 | 128.8 |
| A | 12 | 189 | 70025 | 539.09 | 622 | 607 | 128.8 |
| A | 13 | 254 | 10703 | 78.4 | 622 | 607 | 128.8 |
| B | 0 | 186 | 356445 | 2943.52 | 610 | 593 | 120.9 |
| B | 15 | 85 | 164790 | 1358.2 | 610 | 593 | 120.9 |
| B | 0 | 190 | 117140 | 964.05 | 610 | 593 | 120.9 |
| C | 15 | 214 | 239629 | 1686.36 | 603 | 607 | 141.7 |
| C | 14 | 254 | 110119 | 772.64 | 603 | 607 | 141.7 |
| C | 0 | 10 | 31625 | 218.84 | 603 | 607 | 141.7 |
| D | 13 | 249 | 108350 | 728.69 | 603 | 584 | 147.9 |
| D | 2 | 16 | 106567 | 716.64 | 603 | 584 | 147.9 |
| D | 13 | 171 | 79202 | 531.6 | 603 | 584 | 147.9 |
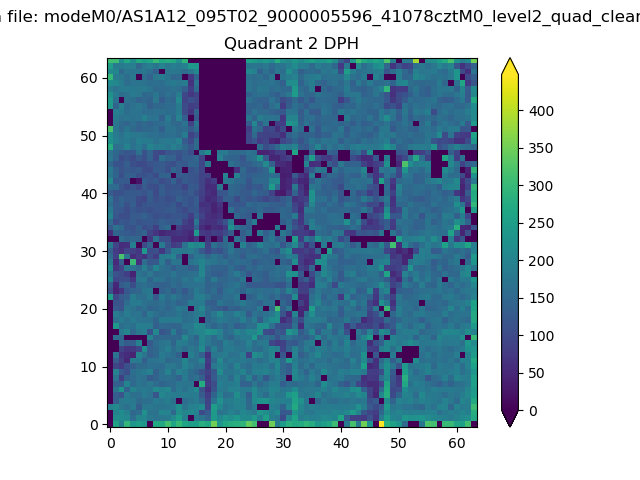
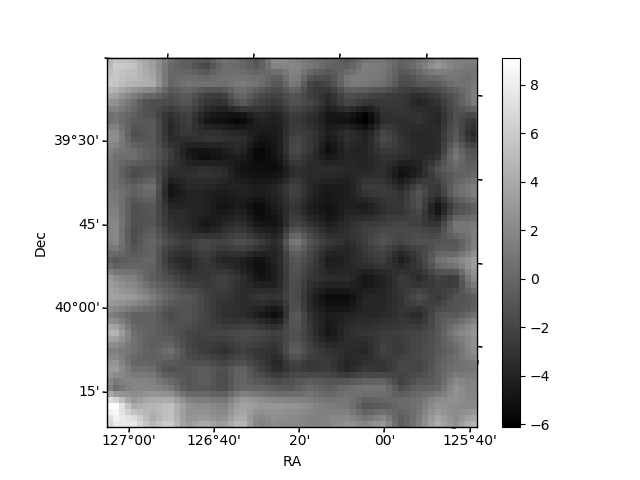
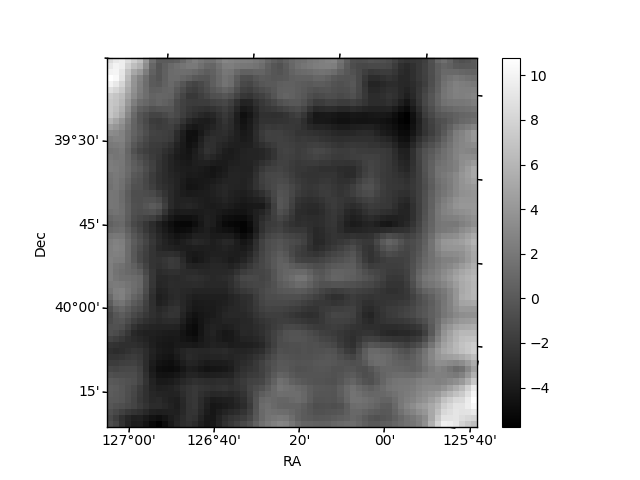
Histogram calculated using DETX and DETY for each event in the final _common_clean file
| Quadrant A |  |
 |
Quadrant B |
|---|---|---|---|
| Quadrant D | 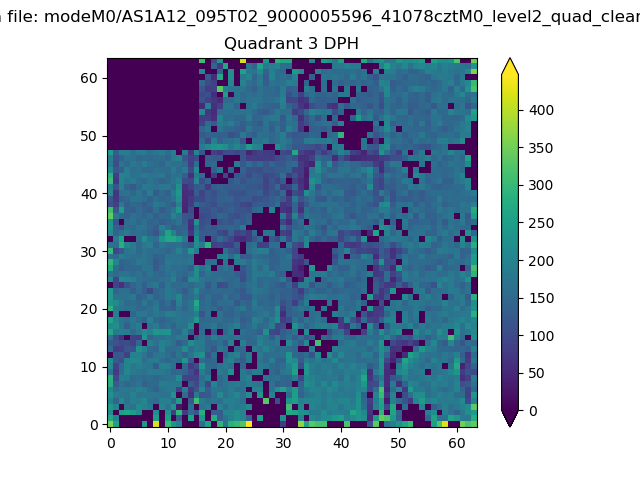 |
 |
Quadrant C |
| Plot type | Count rate plots | Images |
|---|---|---|
| Comparison with Poisson distribution Blue bars denote a histogram of data divided into 1 sec bins. Red curve is a Poisson curve with rate = median count rate of data. |
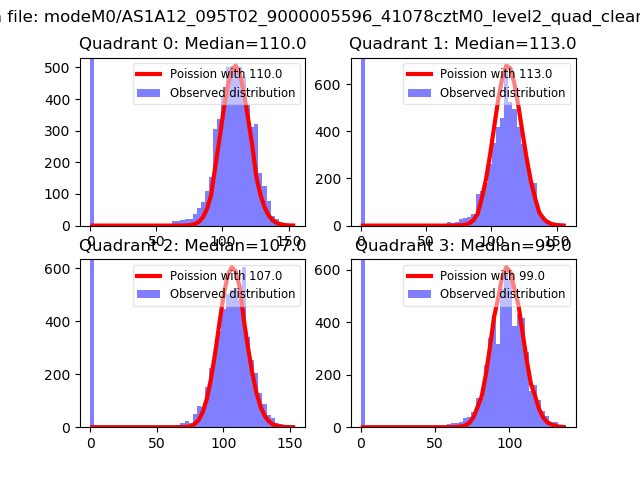 |
 |
| Quadrant-wise count rates Data is divided into 100 sec bins |
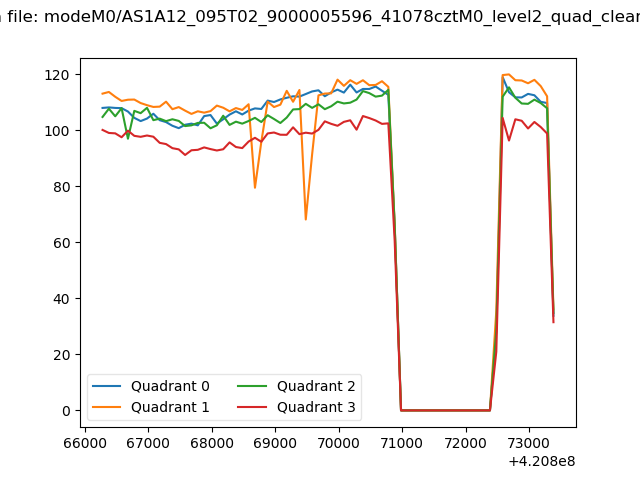 |
|
| Module-wise count rates for Quadrant A Data is divided into 100 sec bins |
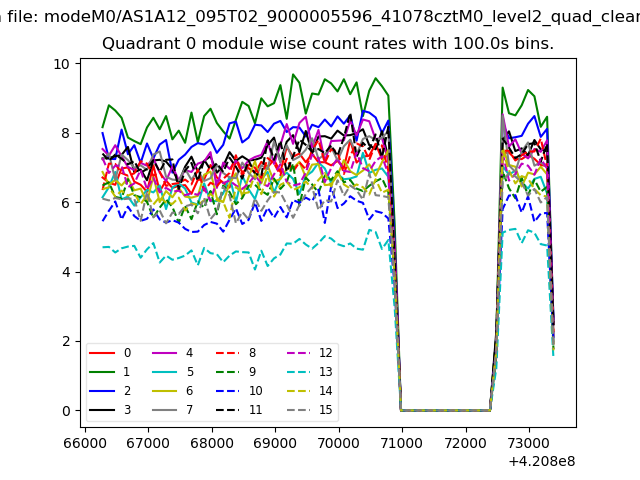 |
 |
| Module-wise count rates for Quadrant B Data is divided into 100 sec bins |
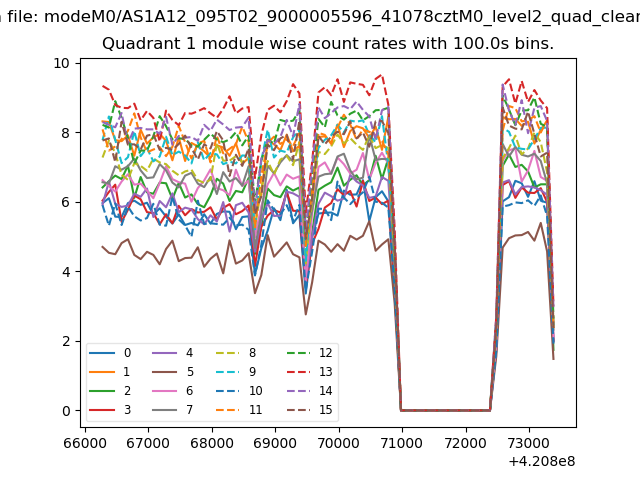 |
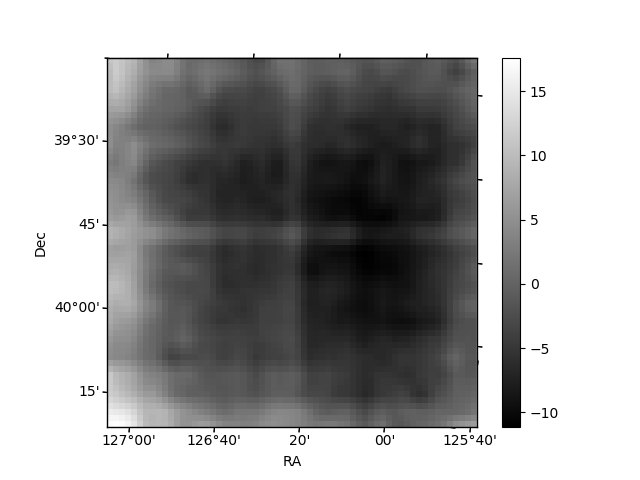 |
| Module-wise count rates for Quadrant C Data is divided into 100 sec bins |
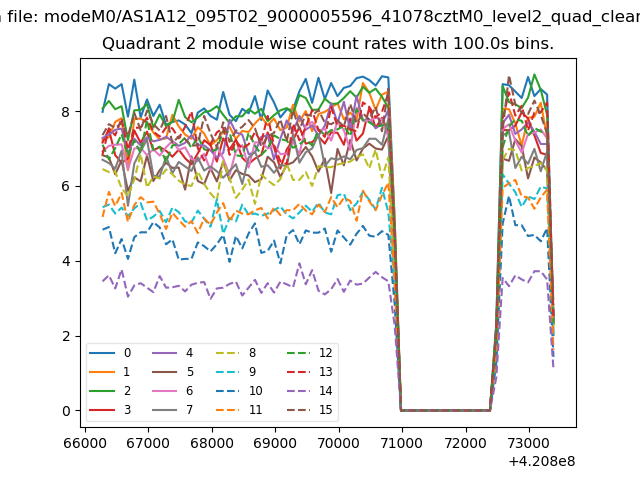 |
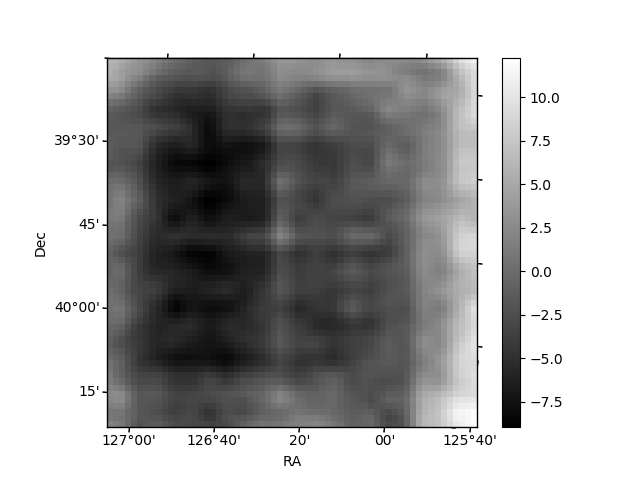 |
| Module-wise count rates for Quadrant D Data is divided into 100 sec bins |
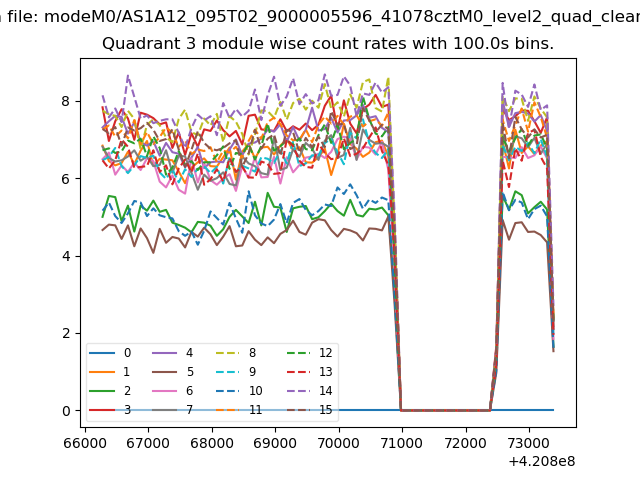 |
 |
| Parameter | Plot |
|---|---|
| CZT HV Monitor | 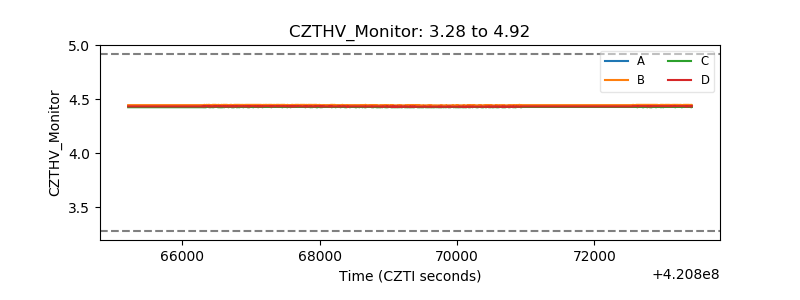 |
| D_VDD | 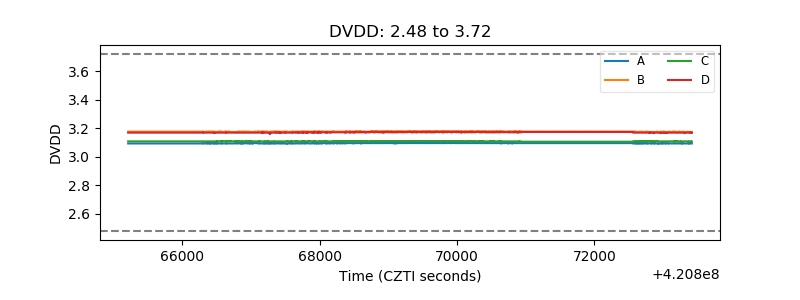 |
| Temperature 1 | 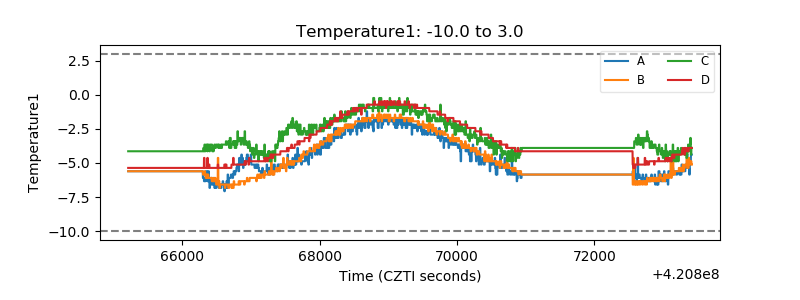 |
| Veto HV Monitor | 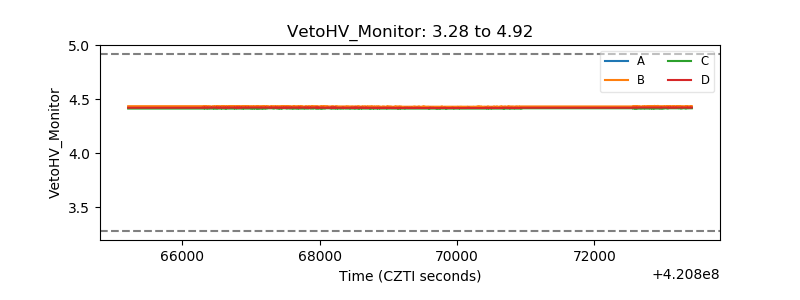 |
| Veto LLD | 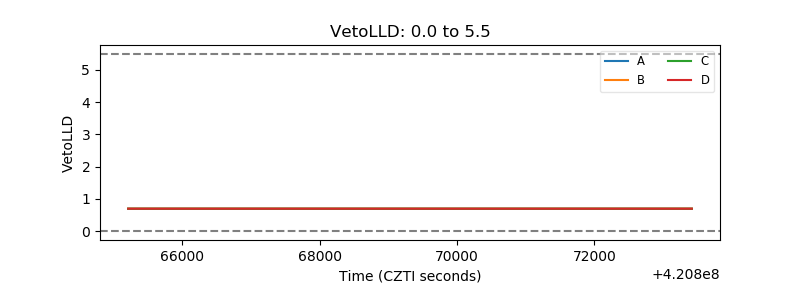 |
| Alpha Counter | 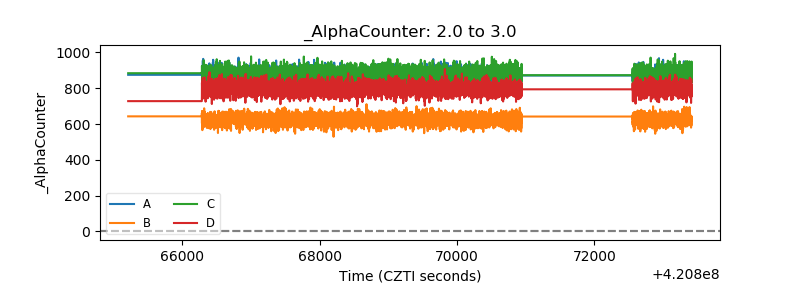 |
| _CPM_Rate | 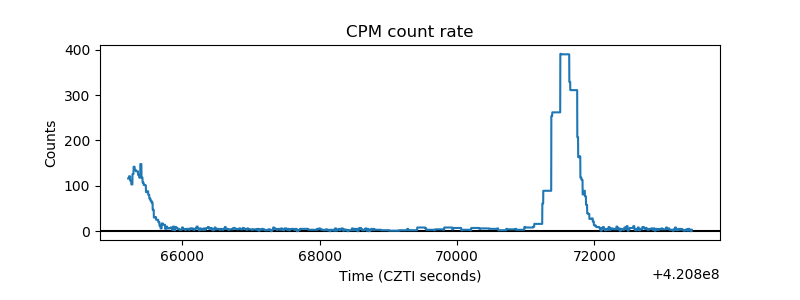 |
| CZT Counter | 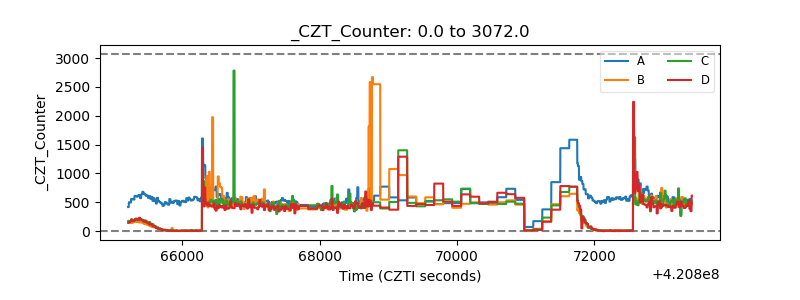 |
| +2.5 Volts monitor |  |
| +5 Volts monitor | 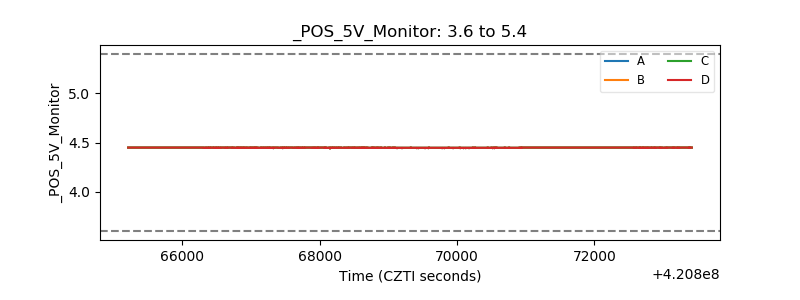 |
| _ROLL_ROT | 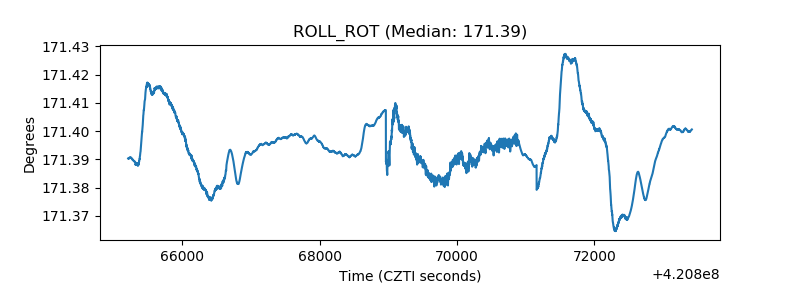 |
| _Roll_DEC | 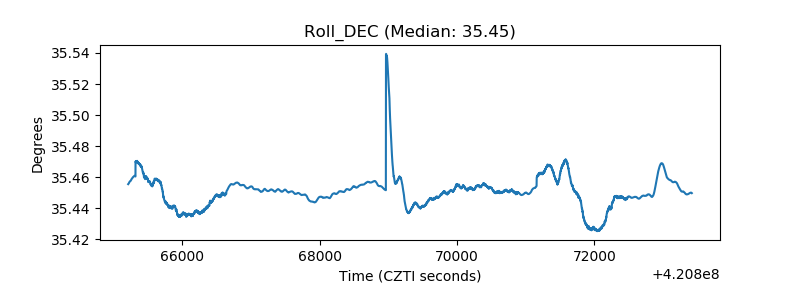 |
| _Roll_RA | 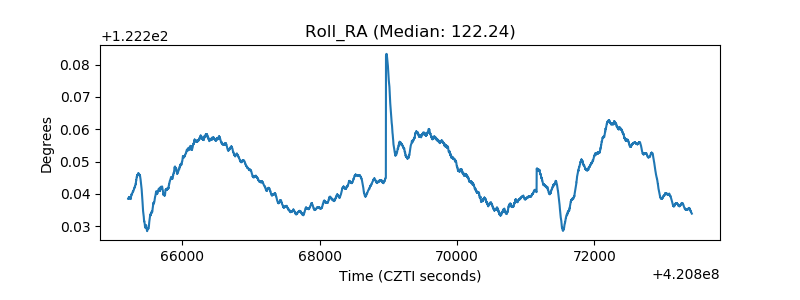 |
| Veto Counter | 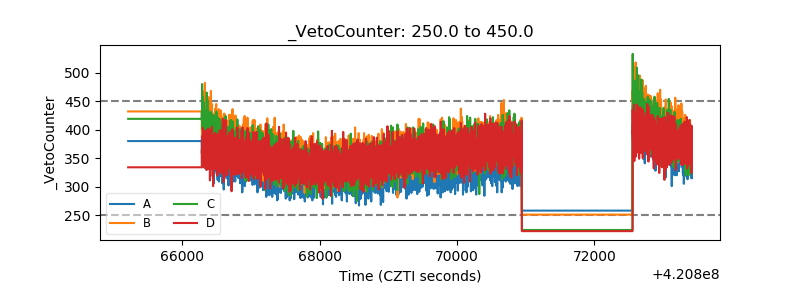 |