| Param | Original file | Final file |
|---|---|---|
| Filename | modeM0/AS1A12_095T02_9000005596_41079cztM0_level2.fits | modeM0/AS1A12_095T02_9000005596_41079cztM0_level2_quad_clean.evt |
| Size (bytes) | 323,766,720 | 92,142,720 |
| Size | 308.8 MB | 87.9 MB |
| Events in quadrant A | 2,970,335 | 618,745 |
| Events in quadrant B | 2,997,755 | 633,021 |
| Events in quadrant C | 2,748,325 | 602,922 |
| Events in quadrant D | 2,841,891 | 552,126 |
| Mode M0 | |||
|---|---|---|---|
| Quadrant | BADHDUFLAG | Total packets | Discarded packets |
| A | 0 | 12041 | 3 |
| B | 0 | 12460 | 2 |
| C | 0 | 11494 | 2 |
| D | 0 | 12194 | 2 |
| Mode SS | |||
|---|---|---|---|
| Quadrant | BADHDUFLAG | Total packets | Discarded packets |
| A | 0 | 112 | 0 |
| B | 0 | 112 | 0 |
| C | 0 | 112 | 0 |
| D | 0 | 112 | 0 |
| Mode M9 | |||
|---|---|---|---|
| Quadrant | BADHDUFLAG | Total packets | Discarded packets |
| A | 0 | 24 | 0 |
| B | 0 | 24 | 0 |
| C | 0 | 24 | 0 |
| D | 0 | 25 | 0 |
| Quadrant | Total seconds | Saturated seconds | Saturation percentage |
|---|---|---|---|
| A | 5475 | 22 | 0.401826% |
| B | 5475 | 81 | 1.479452% |
| C | 5475 | 19 | 0.347032% |
| D | 5475 | 60 | 1.095890% |
Noise dominated data is calculated using 1-second bins in cleaned event files. If a bin has >2000 counts, and if more than 50% of those come from <1% of pixels, then it is considered to be noise-dominated and hence unusable.
| Quadrant | # 1 sec bins | Bins with >0 counts | Bins with >2000 counts | High rate bins dominated by noise | Noise dominated (total time) | Noise dominated (detector-on time) | Marked lightcurve |
|---|---|---|---|---|---|---|---|
| A | 7178 | 5476 | 2 | 2 | 0.03% | 0.04% | 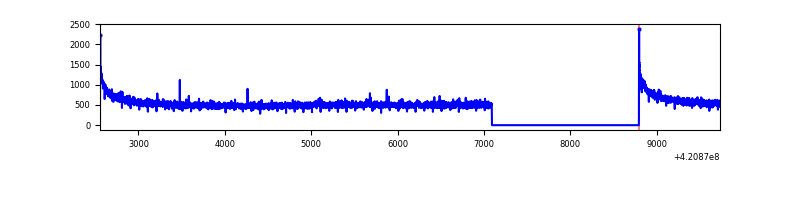 |
| B | 7178 | 5476 | 64 | 64 | 0.89% | 1.17% | 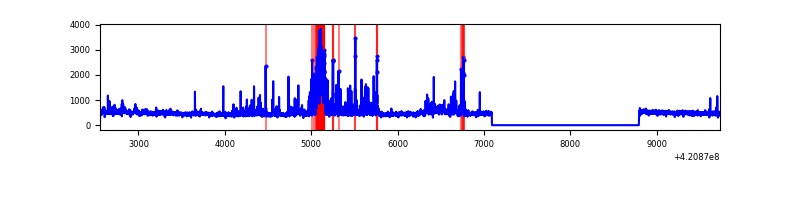 |
| C | 7178 | 5476 | 13 | 13 | 0.18% | 0.24% | 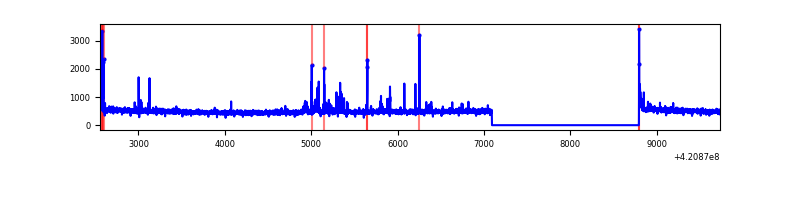 |
| D | 7178 | 5476 | 38 | 38 | 0.53% | 0.69% | 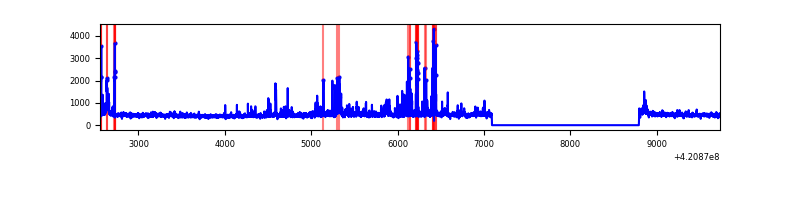 |
Top three noisy pixels from each quadrant. If the there are fewer than three noisy pixels in the level2.evt file, extra rows are filled as -1
| Pixel properties | Quadrant properties | ||||||
|---|---|---|---|---|---|---|---|
| Quadrant | DetID | PixID | Counts | Sigma | Mean | Median | Sigma |
| A | 10 | 83 | 531446 | 4104.08 | 627 | 613 | 129.3 |
| A | 13 | 254 | 10385 | 75.55 | 627 | 613 | 129.3 |
| A | 12 | 189 | 9292 | 67.1 | 627 | 613 | 129.3 |
| B | 0 | 186 | 311726 | 2574.0 | 618 | 602 | 120.9 |
| B | 0 | 190 | 100126 | 823.38 | 618 | 602 | 120.9 |
| B | 5 | 255 | 80809 | 663.57 | 618 | 602 | 120.9 |
| C | 15 | 214 | 236777 | 1663.35 | 604 | 608 | 142.0 |
| C | 14 | 254 | 77937 | 544.63 | 604 | 608 | 142.0 |
| C | 12 | 249 | 34420 | 238.14 | 604 | 608 | 142.0 |
| D | 13 | 171 | 112081 | 751.38 | 604 | 588 | 148.4 |
| D | 13 | 249 | 103927 | 696.43 | 604 | 588 | 148.4 |
| D | 2 | 249 | 88576 | 592.97 | 604 | 588 | 148.4 |
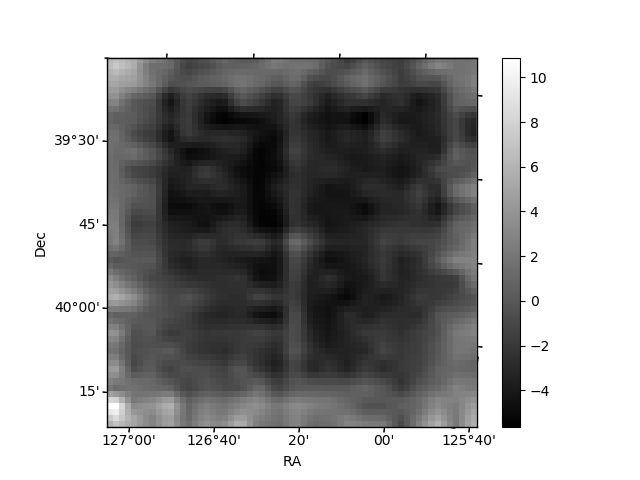
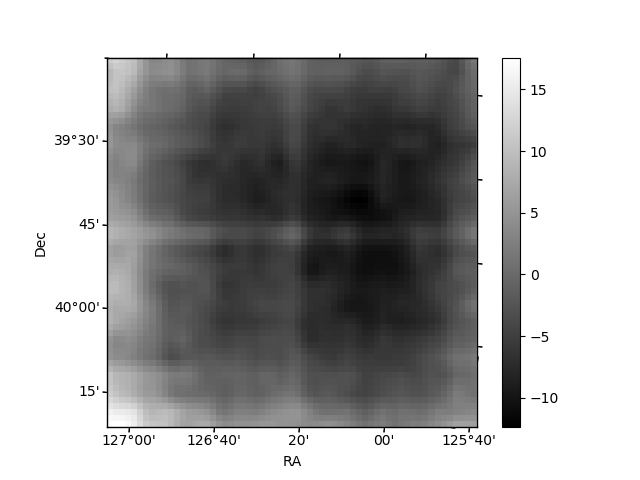
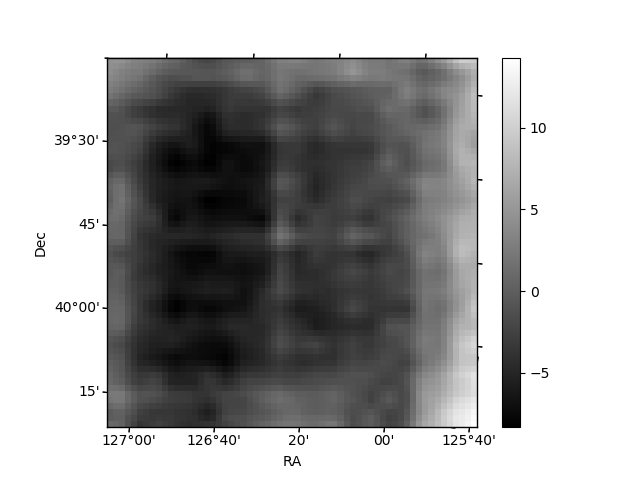
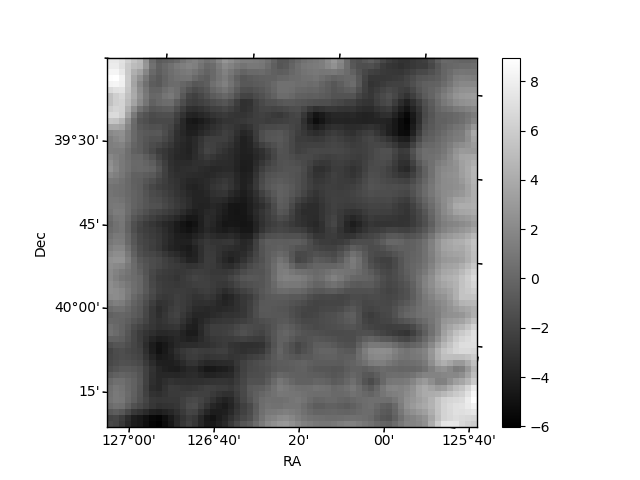
Histogram calculated using DETX and DETY for each event in the final _common_clean file
| Quadrant A | 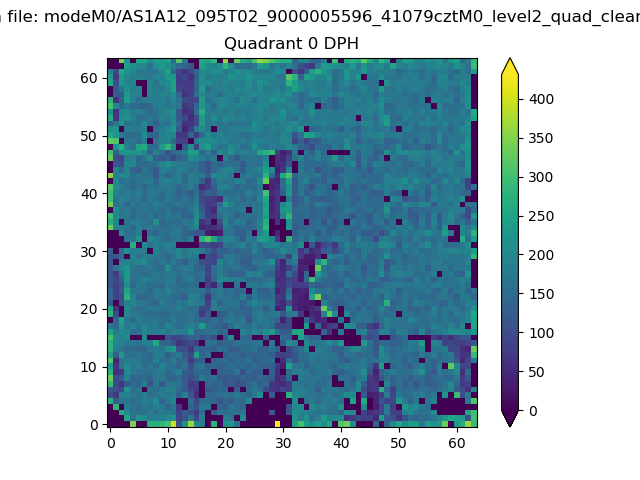 |
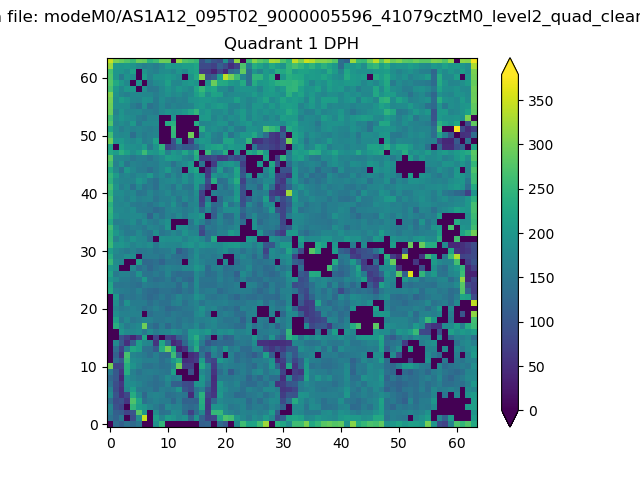 |
Quadrant B |
|---|---|---|---|
| Quadrant D | 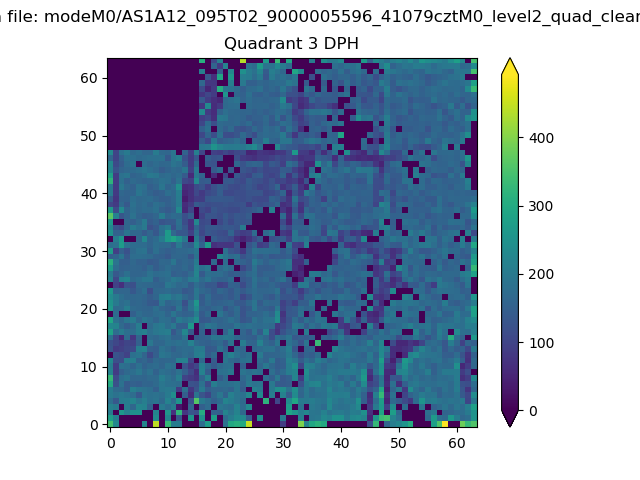 |
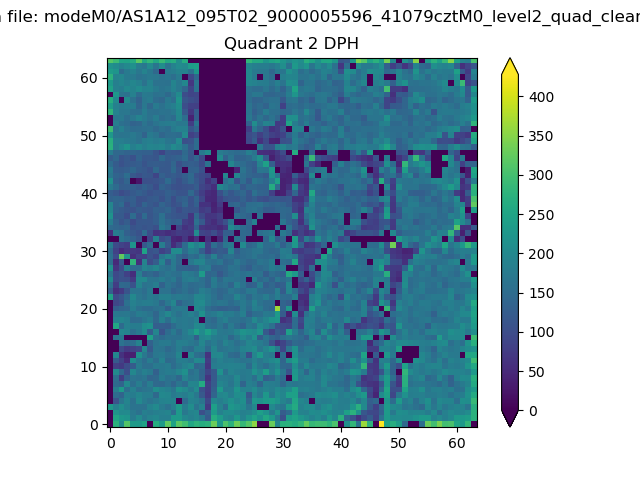 |
Quadrant C |
| Plot type | Count rate plots | Images |
|---|---|---|
| Comparison with Poisson distribution Blue bars denote a histogram of data divided into 1 sec bins. Red curve is a Poisson curve with rate = median count rate of data. |
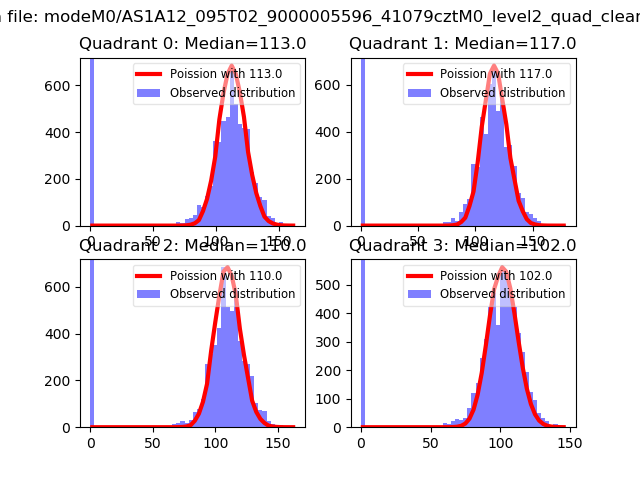 |
 |
| Quadrant-wise count rates Data is divided into 100 sec bins |
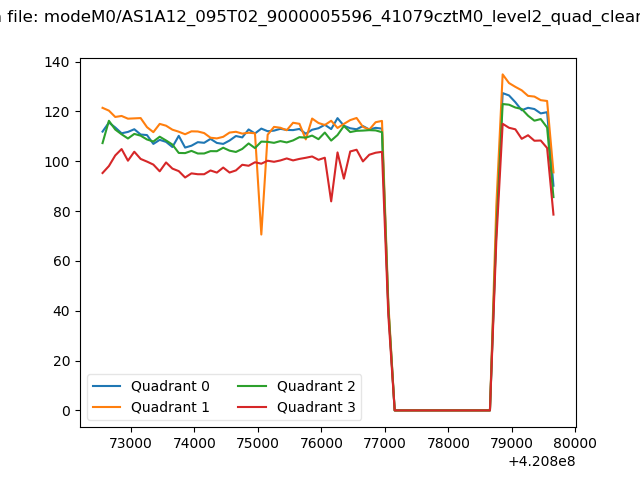 |
|
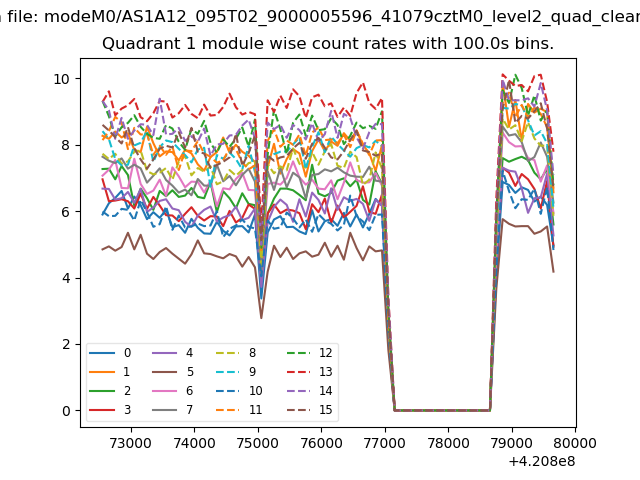
| Module-wise count rates for Quadrant A Data is divided into 100 sec bins |
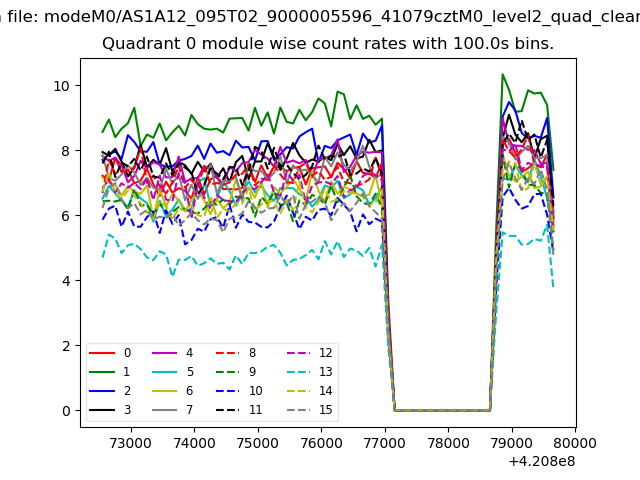 |
 |
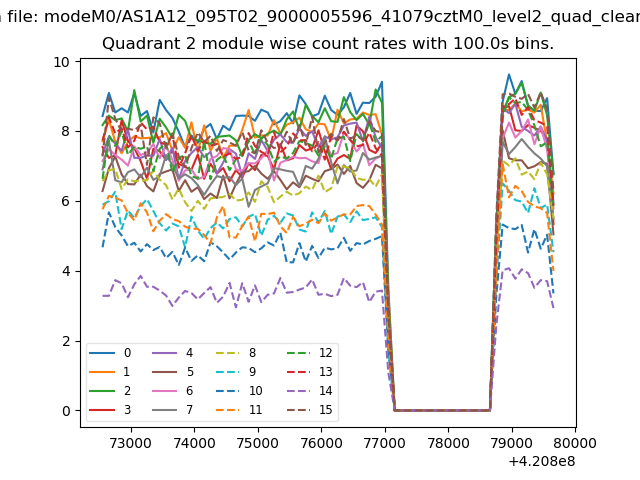
| Module-wise count rates for Quadrant B Data is divided into 100 sec bins |
 |
 |
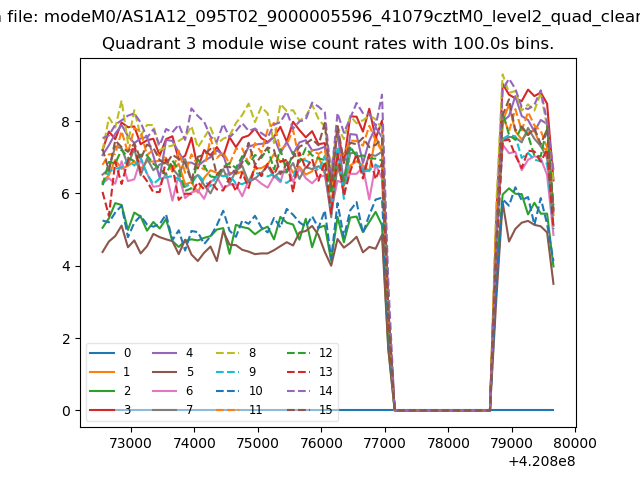
| Module-wise count rates for Quadrant C Data is divided into 100 sec bins |
 |
 |
| Module-wise count rates for Quadrant D Data is divided into 100 sec bins |
 |
 |
| Parameter | Plot |
|---|---|
| CZT HV Monitor | 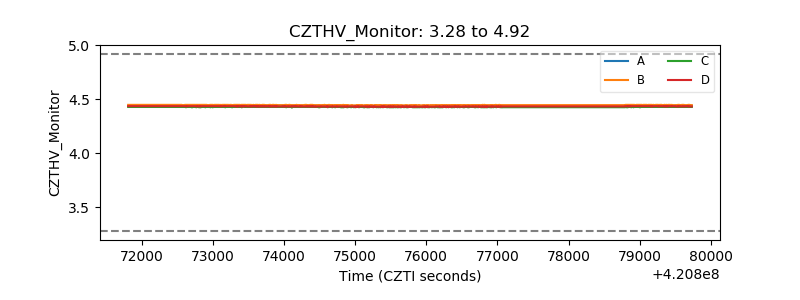 |
| D_VDD | 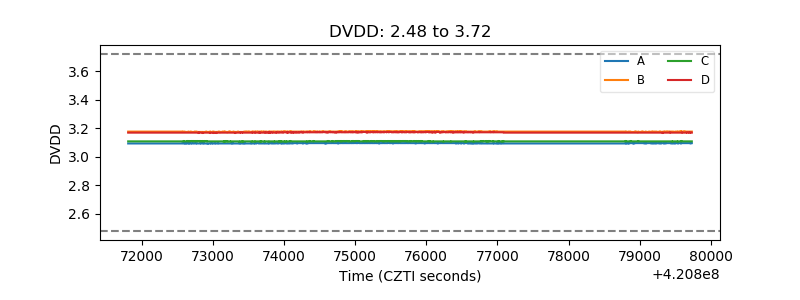 |
| Temperature 1 | 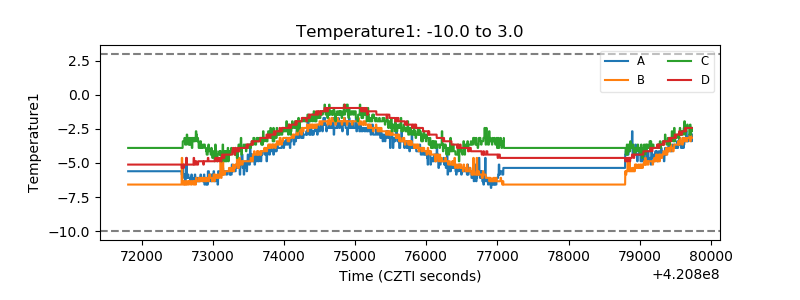 |
| Veto HV Monitor | 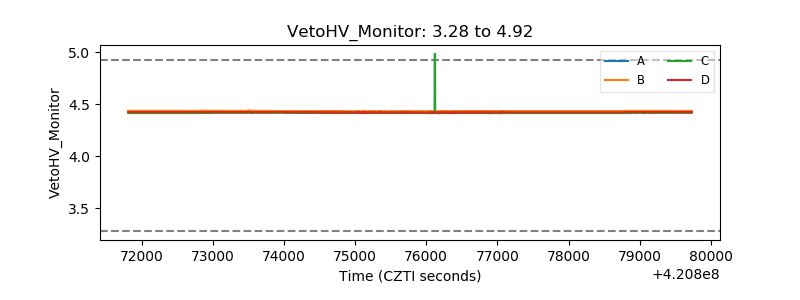 |
| Veto LLD | 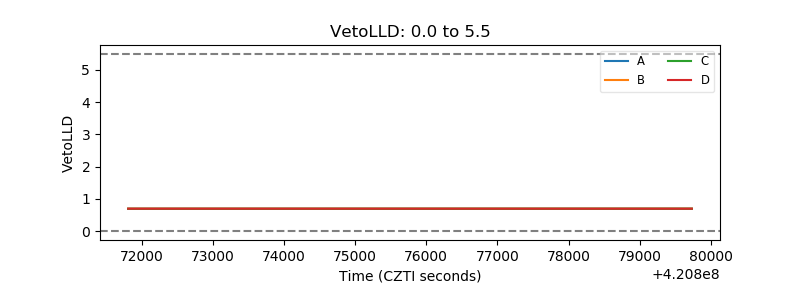 |
| Alpha Counter | 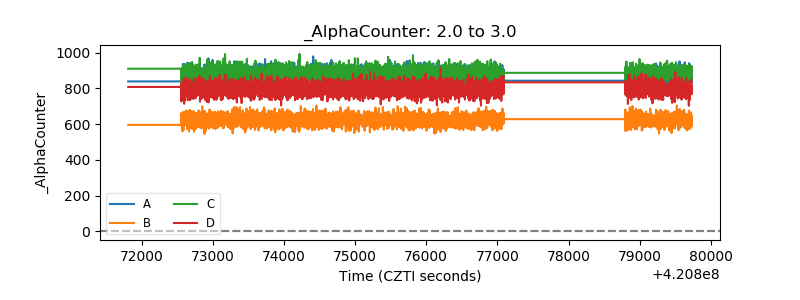 |
| _CPM_Rate | 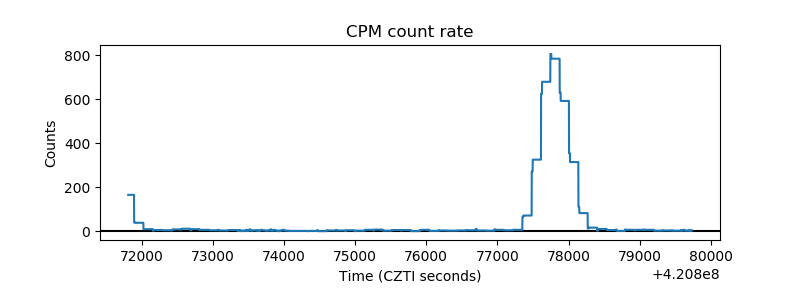 |
| CZT Counter |  |
| +2.5 Volts monitor |  |
| +5 Volts monitor | 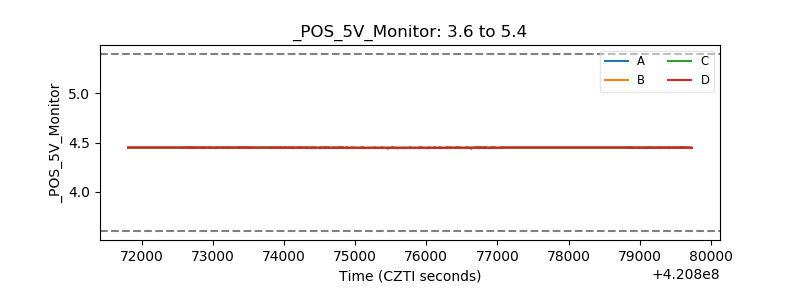 |
| _ROLL_ROT | 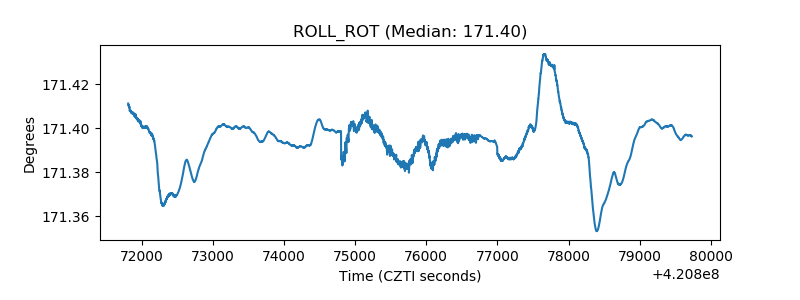 |
| _Roll_DEC |  |
| _Roll_RA | 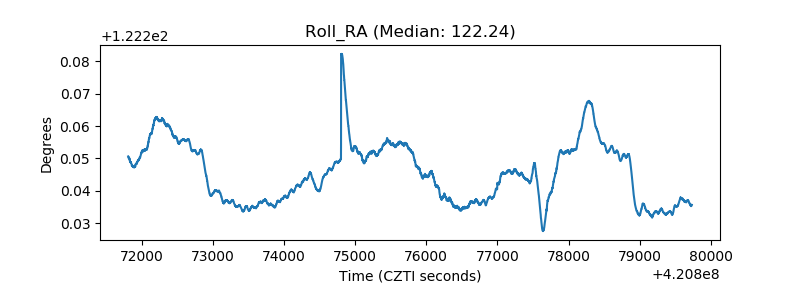 |
| Veto Counter | 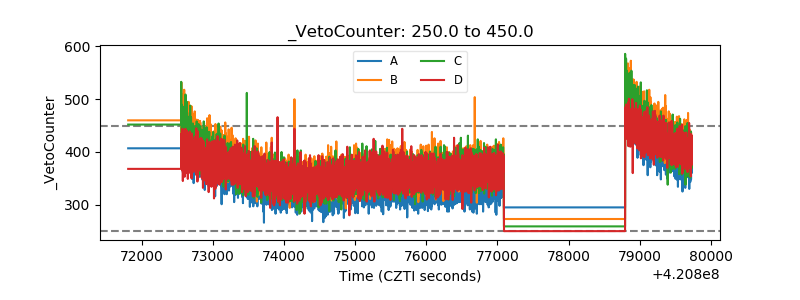 |