| Param | Original file | Final file |
|---|---|---|
| Filename | modeM0/AS1A12_095T02_9000005596_41081cztM0_level2.fits | modeM0/AS1A12_095T02_9000005596_41081cztM0_level2_quad_clean.evt |
| Size (bytes) | 360,167,040 | 93,084,480 |
| Size | 343.5 MB | 88.8 MB |
| Events in quadrant A | 3,044,722 | 635,496 |
| Events in quadrant B | 3,761,812 | 636,724 |
| Events in quadrant C | 2,923,991 | 609,318 |
| Events in quadrant D | 3,187,455 | 564,039 |
| Mode M0 | |||
|---|---|---|---|
| Quadrant | BADHDUFLAG | Total packets | Discarded packets |
| A | 0 | 12215 | 3 |
| B | 0 | 14573 | 2 |
| C | 0 | 11801 | 2 |
| D | 0 | 12918 | 2 |
| Mode SS | |||
|---|---|---|---|
| Quadrant | BADHDUFLAG | Total packets | Discarded packets |
| A | 0 | 110 | 0 |
| B | 0 | 110 | 0 |
| C | 0 | 110 | 0 |
| D | 0 | 110 | 0 |
| Mode M9 | |||
|---|---|---|---|
| Quadrant | BADHDUFLAG | Total packets | Discarded packets |
| A | 0 | 23 | 0 |
| B | 0 | 23 | 0 |
| C | 0 | 23 | 0 |
| D | 0 | 24 | 0 |
| Quadrant | Total seconds | Saturated seconds | Saturation percentage |
|---|---|---|---|
| A | 5325 | 19 | 0.356808% |
| B | 5325 | 209 | 3.924883% |
| C | 5325 | 26 | 0.488263% |
| D | 5325 | 65 | 1.220657% |
Noise dominated data is calculated using 1-second bins in cleaned event files. If a bin has >2000 counts, and if more than 50% of those come from <1% of pixels, then it is considered to be noise-dominated and hence unusable.
| Quadrant | # 1 sec bins | Bins with >0 counts | Bins with >2000 counts | High rate bins dominated by noise | Noise dominated (total time) | Noise dominated (detector-on time) | Marked lightcurve |
|---|---|---|---|---|---|---|---|
| A | 7178 | 5326 | 4 | 4 | 0.06% | 0.08% | 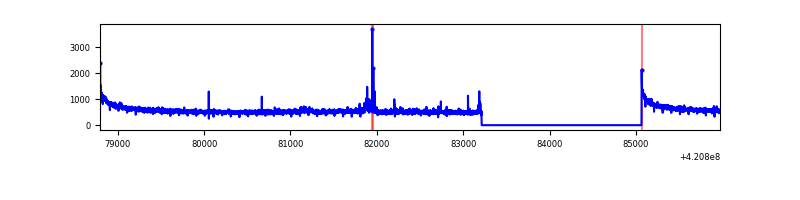 |
| B | 7178 | 5326 | 196 | 196 | 2.73% | 3.68% | 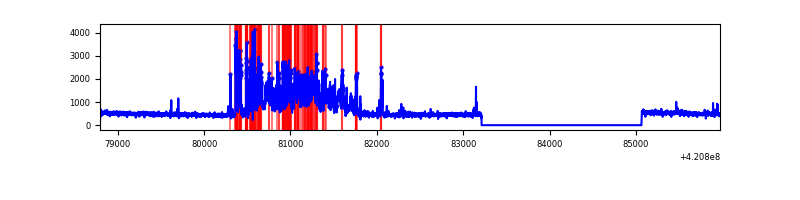 |
| C | 7178 | 5326 | 19 | 19 | 0.26% | 0.36% | 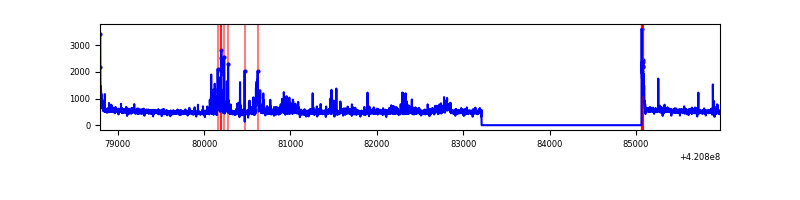 |
| D | 7178 | 5326 | 55 | 55 | 0.77% | 1.03% | 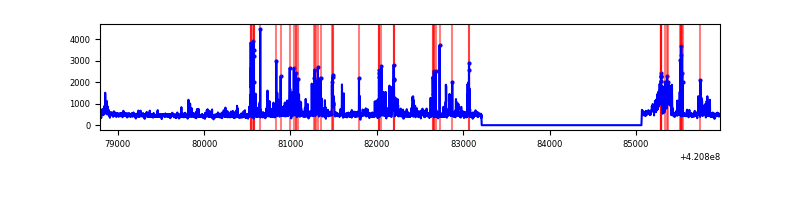 |
Top three noisy pixels from each quadrant. If the there are fewer than three noisy pixels in the level2.evt file, extra rows are filled as -1
| Pixel properties | Quadrant properties | ||||||
|---|---|---|---|---|---|---|---|
| Quadrant | DetID | PixID | Counts | Sigma | Mean | Median | Sigma |
| A | 10 | 83 | 543259 | 4258.98 | 626 | 615 | 127.4 |
| A | 12 | 189 | 38166 | 294.72 | 626 | 615 | 127.4 |
| A | 13 | 248 | 33530 | 258.34 | 626 | 615 | 127.4 |
| B | 0 | 186 | 1261060 | 10695.5 | 611 | 596 | 117.8 |
| B | 5 | 255 | 77092 | 649.1 | 611 | 596 | 117.8 |
| B | 12 | 111 | 14737 | 119.99 | 611 | 596 | 117.8 |
| C | 14 | 254 | 256822 | 1846.08 | 599 | 603 | 138.8 |
| C | 15 | 214 | 228216 | 1639.97 | 599 | 603 | 138.8 |
| C | 0 | 10 | 64519 | 460.52 | 599 | 603 | 138.8 |
| D | 2 | 249 | 260002 | 1763.24 | 603 | 589 | 147.1 |
| D | 12 | 79 | 155186 | 1050.8 | 603 | 589 | 147.1 |
| D | 13 | 249 | 105695 | 714.41 | 603 | 589 | 147.1 |
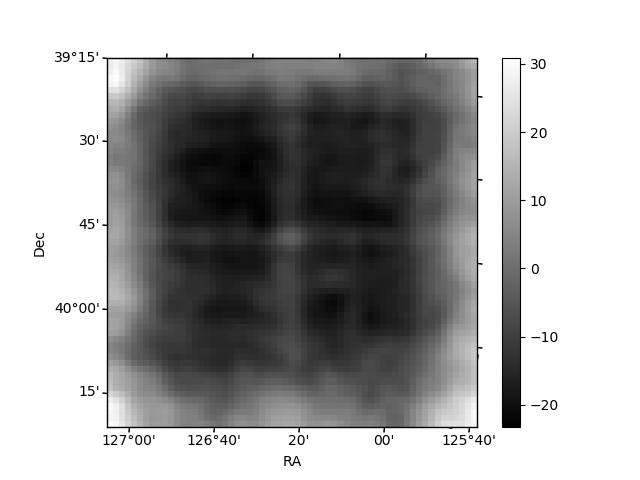
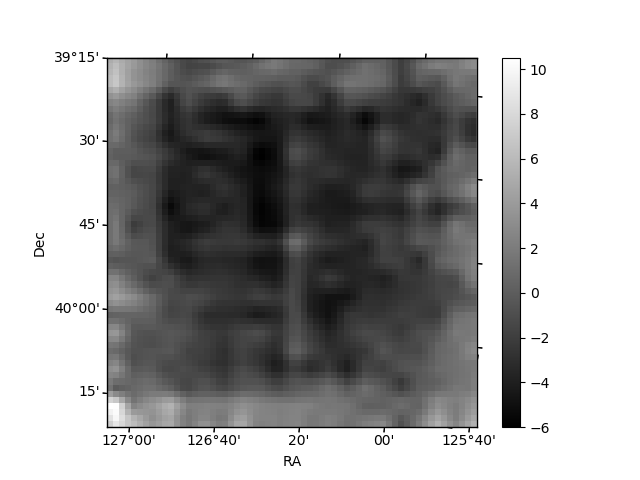
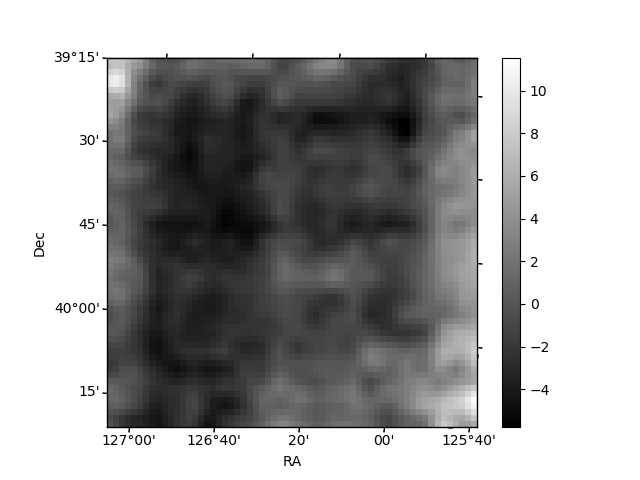
Histogram calculated using DETX and DETY for each event in the final _common_clean file
| Quadrant A | 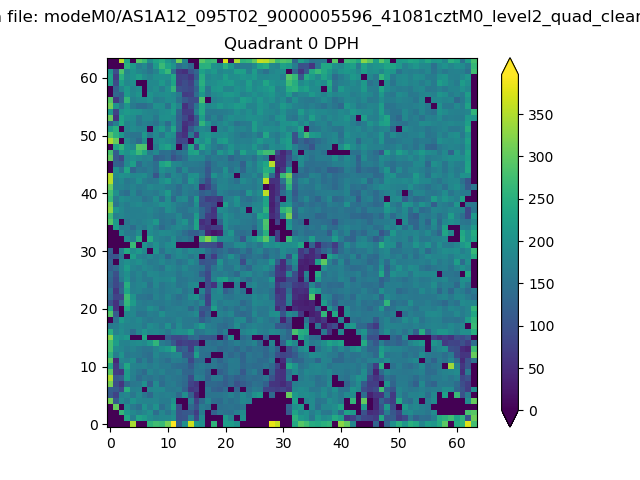 |
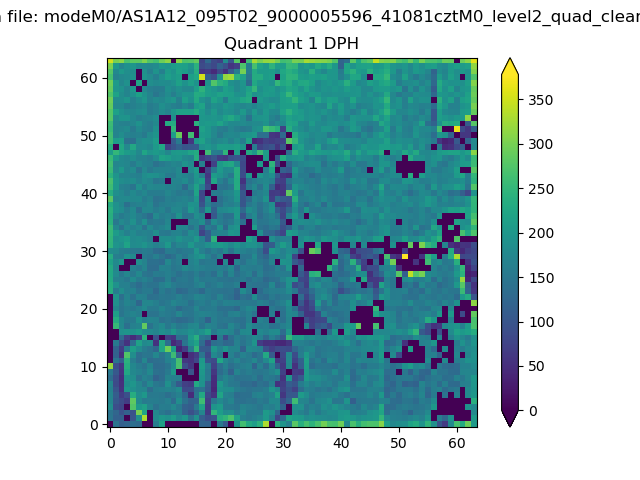 |
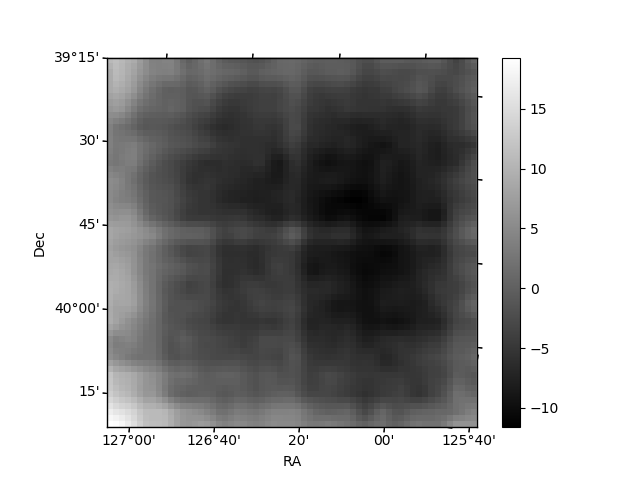
Quadrant B |
|---|---|---|---|
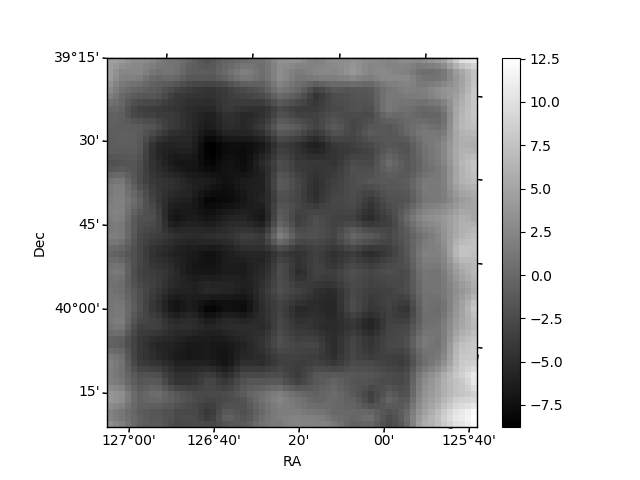
| Quadrant D | 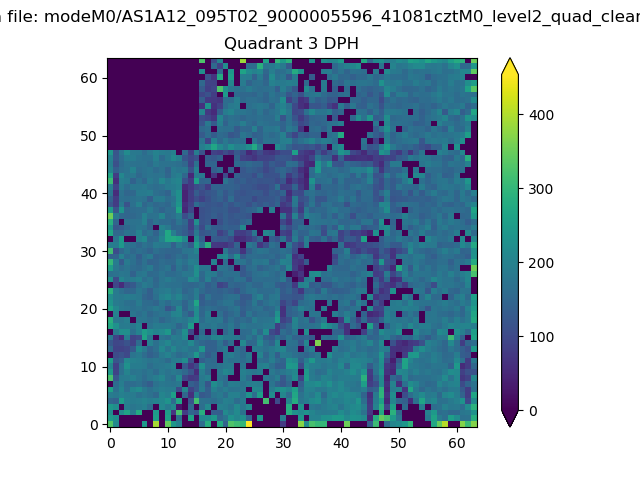 |
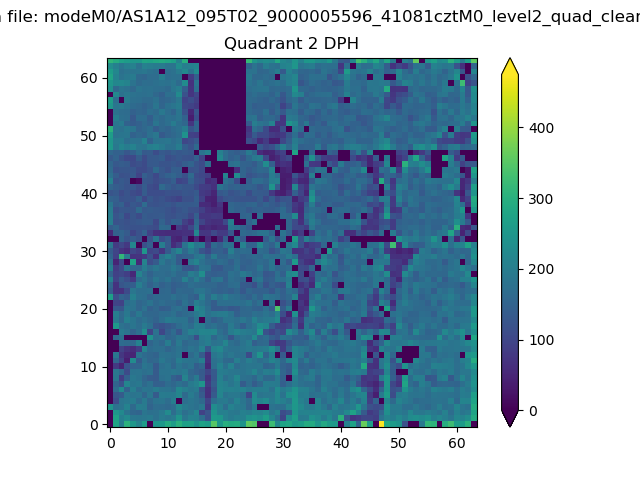 |
Quadrant C |
| Plot type | Count rate plots | Images |
|---|---|---|
| Comparison with Poisson distribution Blue bars denote a histogram of data divided into 1 sec bins. Red curve is a Poisson curve with rate = median count rate of data. |
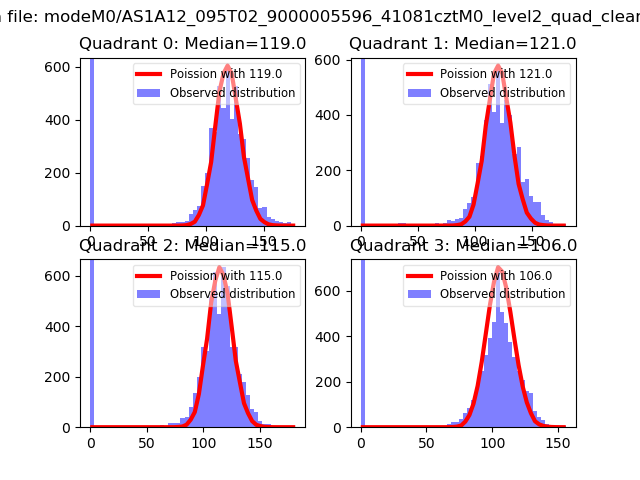 |
 |
| Quadrant-wise count rates Data is divided into 100 sec bins |
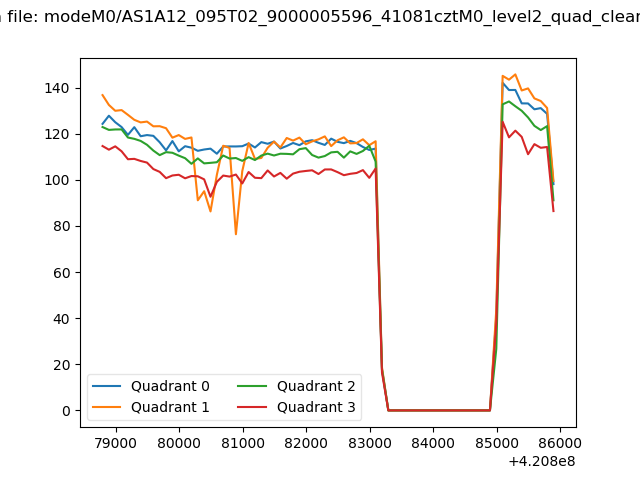 |
|
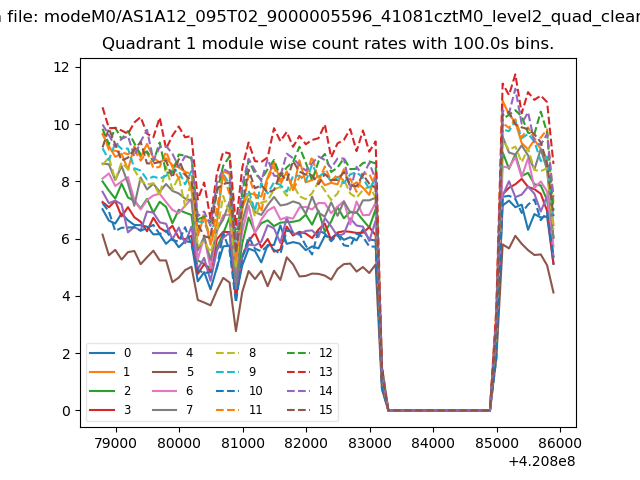
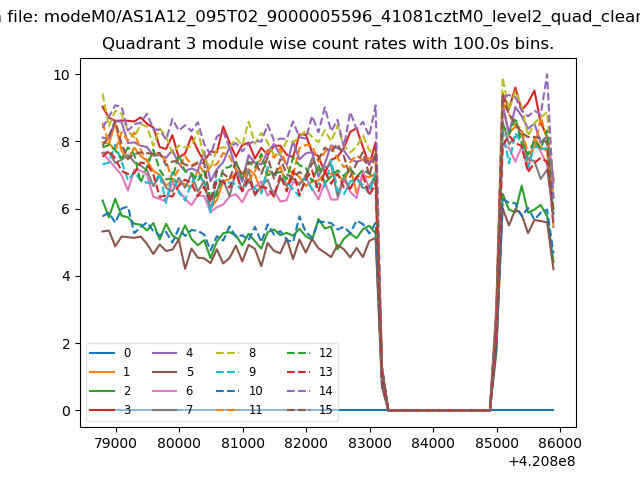
| Module-wise count rates for Quadrant A Data is divided into 100 sec bins |
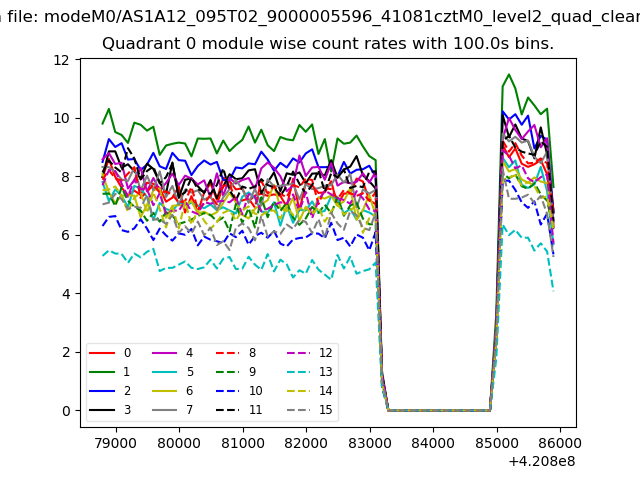 |
 |
| Module-wise count rates for Quadrant B Data is divided into 100 sec bins |
 |
 |
| Module-wise count rates for Quadrant C Data is divided into 100 sec bins |
 |
 |
| Module-wise count rates for Quadrant D Data is divided into 100 sec bins |
 |
 |
| Parameter | Plot |
|---|---|
| CZT HV Monitor | 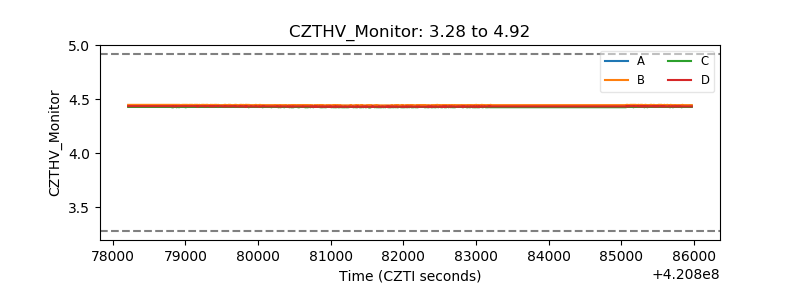 |
| D_VDD | 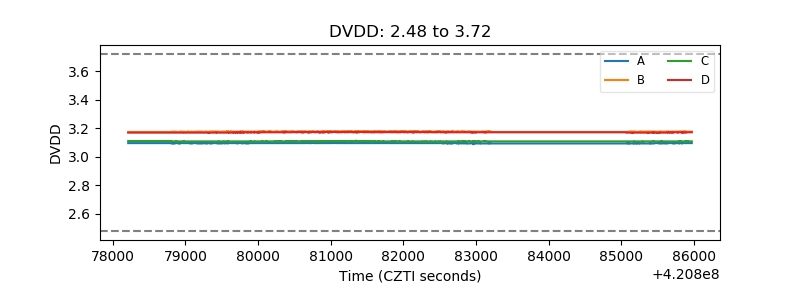 |
| Temperature 1 | 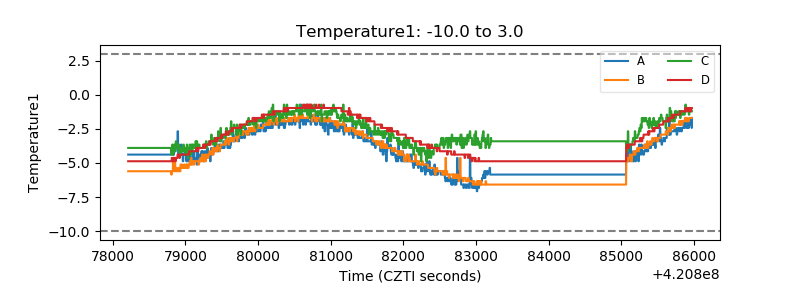 |
| Veto HV Monitor | 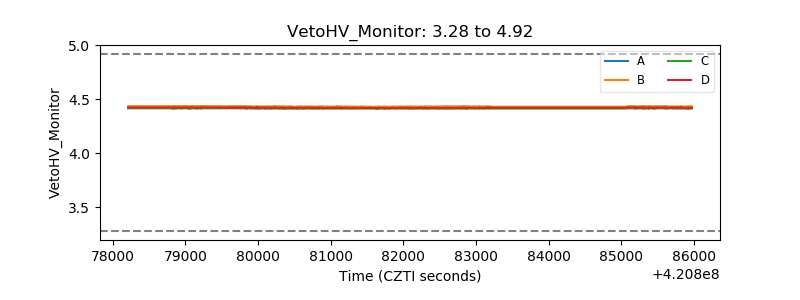 |
| Veto LLD | 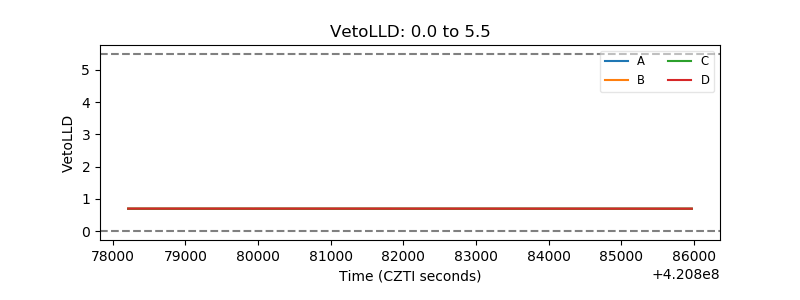 |
| Alpha Counter | 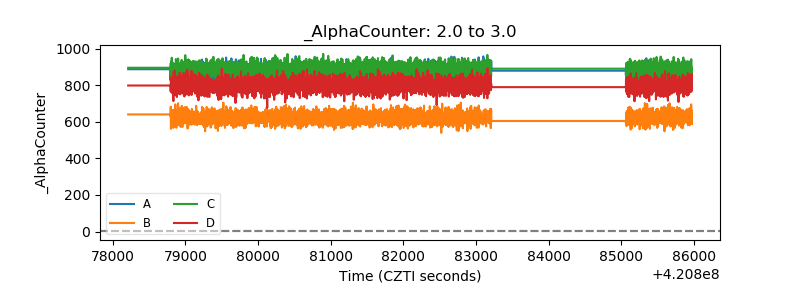 |
| _CPM_Rate | 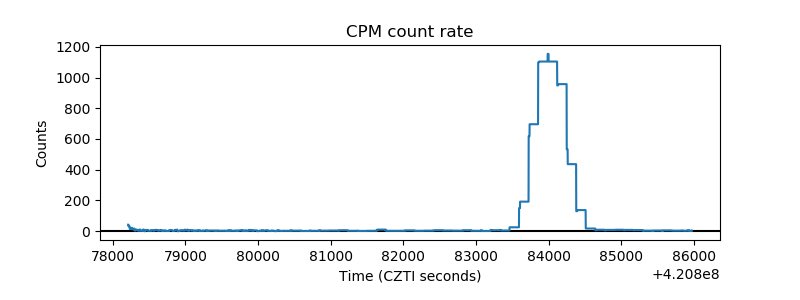 |
| CZT Counter | 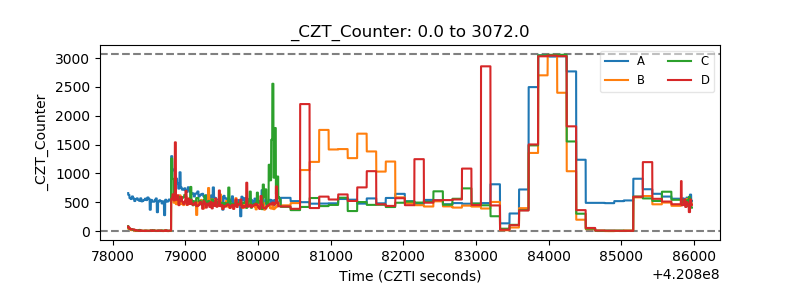 |
| +2.5 Volts monitor | 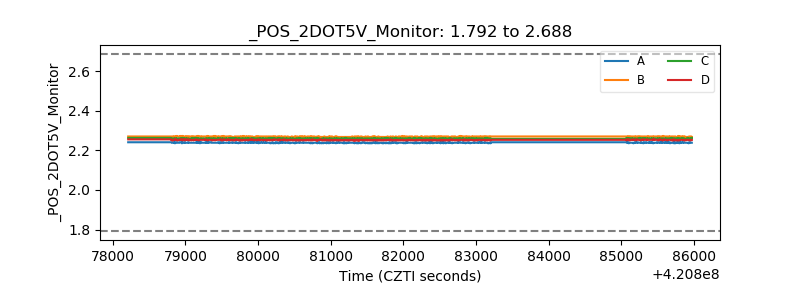 |
| +5 Volts monitor | 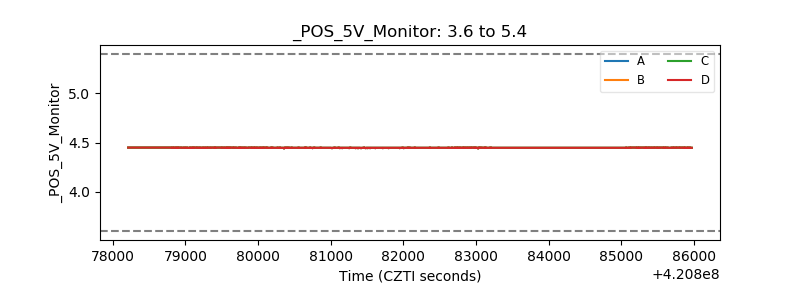 |
| _ROLL_ROT | 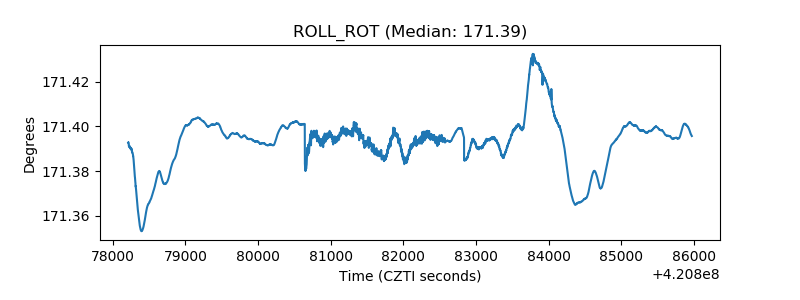 |
| _Roll_DEC |  |
| _Roll_RA | 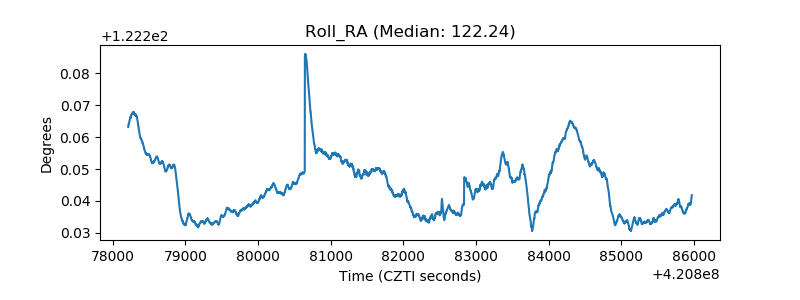 |
| Veto Counter | 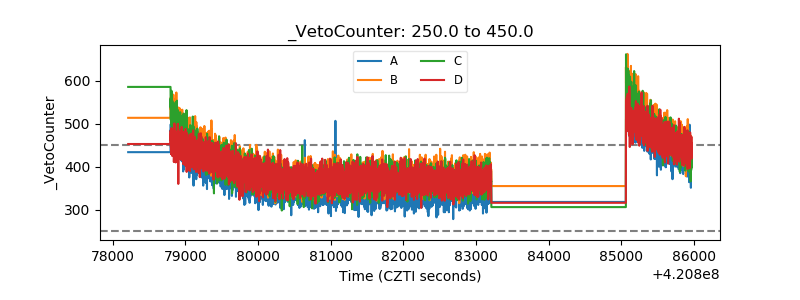 |