| Param | Original file | Final file |
|---|---|---|
| Filename | modeM0/AS1A12_095T02_9000005596_41082cztM0_level2.fits | modeM0/AS1A12_095T02_9000005596_41082cztM0_level2_quad_clean.evt |
| Size (bytes) | 378,034,560 | 92,206,080 |
| Size | 360.5 MB | 87.9 MB |
| Events in quadrant A | 3,323,125 | 639,182 |
| Events in quadrant B | 4,095,080 | 625,911 |
| Events in quadrant C | 3,108,245 | 603,600 |
| Events in quadrant D | 3,070,174 | 565,563 |
| Mode M0 | |||
|---|---|---|---|
| Quadrant | BADHDUFLAG | Total packets | Discarded packets |
| A | 0 | 13215 | 3 |
| B | 0 | 15407 | 2 |
| C | 0 | 12286 | 2 |
| D | 0 | 12444 | 2 |
| Mode SS | |||
|---|---|---|---|
| Quadrant | BADHDUFLAG | Total packets | Discarded packets |
| A | 0 | 104 | 0 |
| B | 0 | 104 | 0 |
| C | 0 | 104 | 0 |
| D | 0 | 104 | 0 |
| Mode M9 | |||
|---|---|---|---|
| Quadrant | BADHDUFLAG | Total packets | Discarded packets |
| A | 0 | 27 | 0 |
| B | 0 | 27 | 0 |
| C | 0 | 27 | 0 |
| D | 0 | 28 | 0 |
| Quadrant | Total seconds | Saturated seconds | Saturation percentage |
|---|---|---|---|
| A | 5107 | 34 | 0.665753% |
| B | 5107 | 320 | 6.265910% |
| C | 5107 | 65 | 1.272763% |
| D | 5107 | 82 | 1.605639% |
Noise dominated data is calculated using 1-second bins in cleaned event files. If a bin has >2000 counts, and if more than 50% of those come from <1% of pixels, then it is considered to be noise-dominated and hence unusable.
| Quadrant | # 1 sec bins | Bins with >0 counts | Bins with >2000 counts | High rate bins dominated by noise | Noise dominated (total time) | Noise dominated (detector-on time) | Marked lightcurve |
|---|---|---|---|---|---|---|---|
| A | 7080 | 5108 | 26 | 26 | 0.37% | 0.51% | 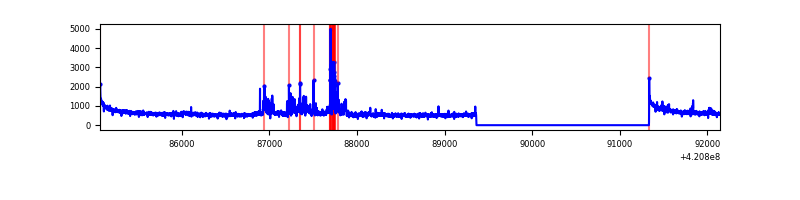 |
| B | 7080 | 5108 | 290 | 290 | 4.10% | 5.68% | 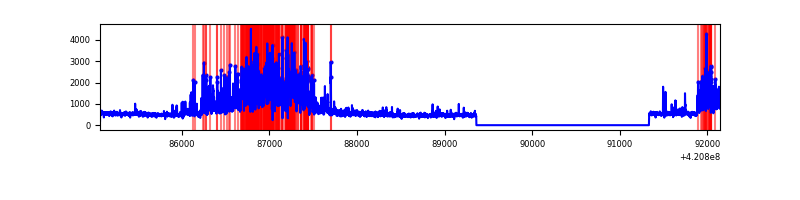 |
| C | 7080 | 5108 | 71 | 71 | 1.00% | 1.39% | 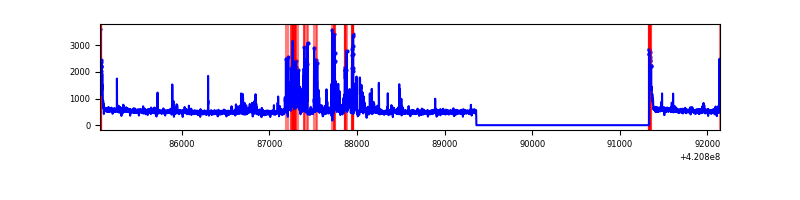 |
| D | 7080 | 5108 | 66 | 66 | 0.93% | 1.29% | 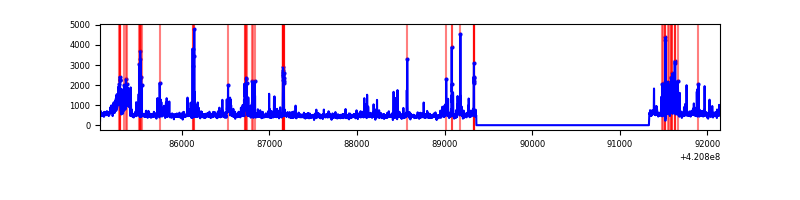 |
Top three noisy pixels from each quadrant. If the there are fewer than three noisy pixels in the level2.evt file, extra rows are filled as -1
| Pixel properties | Quadrant properties | ||||||
|---|---|---|---|---|---|---|---|
| Quadrant | DetID | PixID | Counts | Sigma | Mean | Median | Sigma |
| A | 10 | 83 | 531360 | 4211.1 | 612 | 602 | 126.0 |
| A | 0 | 247 | 237532 | 1879.83 | 612 | 602 | 126.0 |
| A | 12 | 189 | 136735 | 1080.09 | 612 | 602 | 126.0 |
| B | 0 | 186 | 943131 | 8202.16 | 595 | 579 | 114.9 |
| B | 5 | 255 | 628989 | 5468.47 | 595 | 579 | 114.9 |
| B | 0 | 190 | 144944 | 1256.28 | 595 | 579 | 114.9 |
| C | 14 | 254 | 483279 | 3581.22 | 583 | 589 | 134.8 |
| C | 15 | 214 | 219683 | 1625.52 | 583 | 589 | 134.8 |
| C | 0 | 10 | 99930 | 737.04 | 583 | 589 | 134.8 |
| D | 2 | 249 | 283749 | 1988.25 | 592 | 577 | 142.4 |
| D | 13 | 249 | 178533 | 1249.49 | 592 | 577 | 142.4 |
| D | 13 | 171 | 61047 | 424.58 | 592 | 577 | 142.4 |
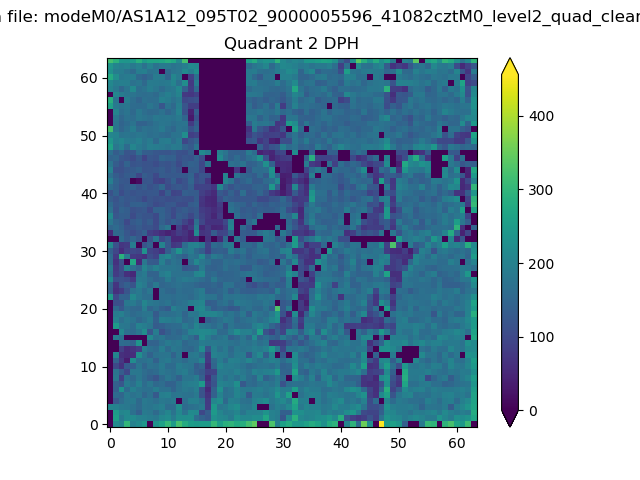
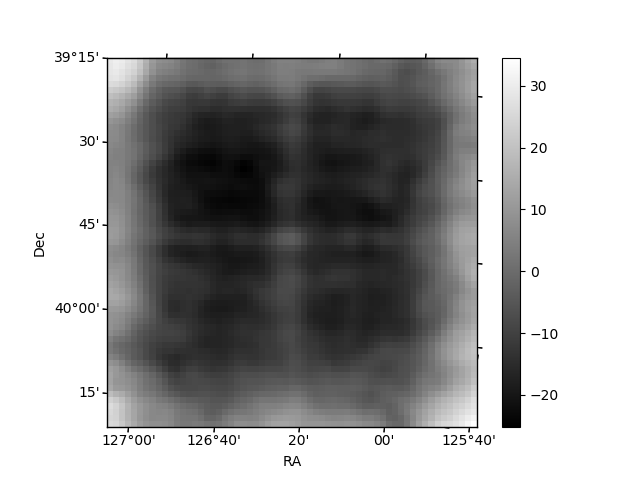
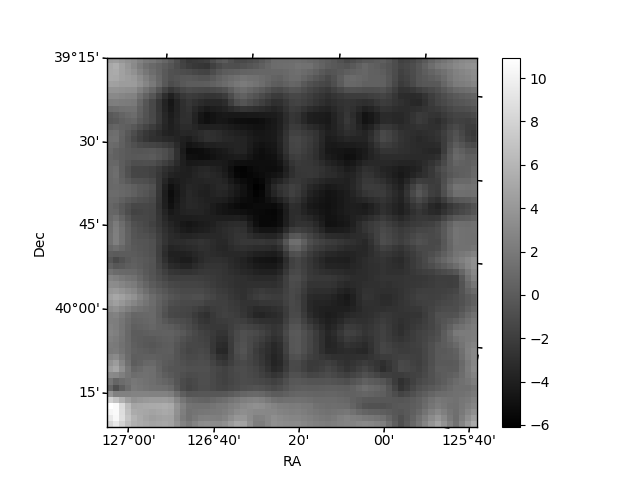
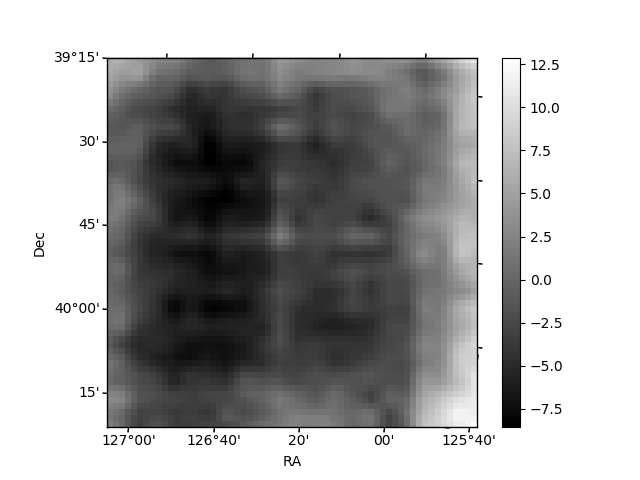
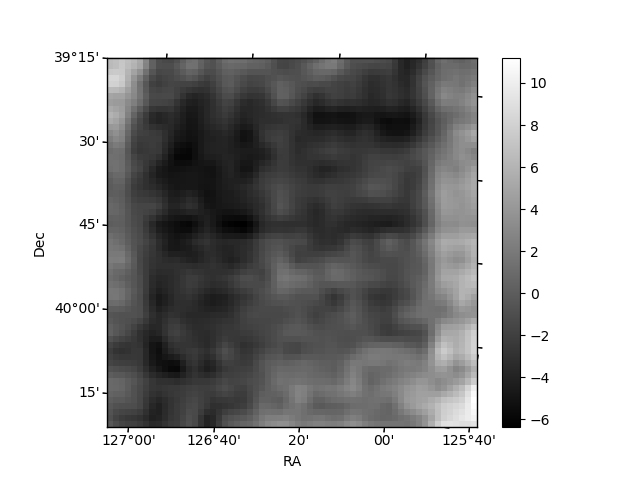
Histogram calculated using DETX and DETY for each event in the final _common_clean file
| Quadrant A | 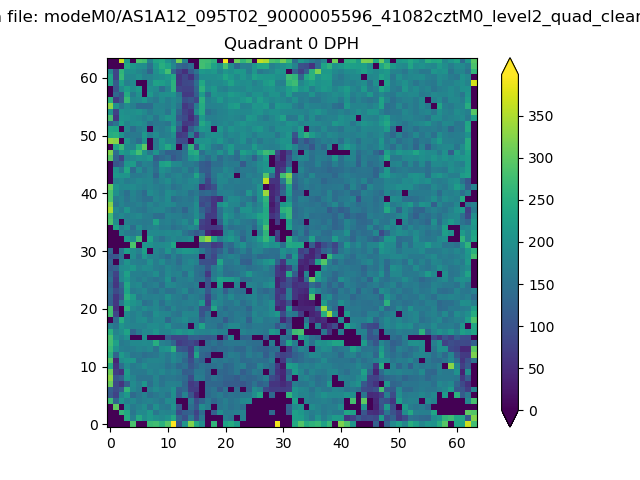 |
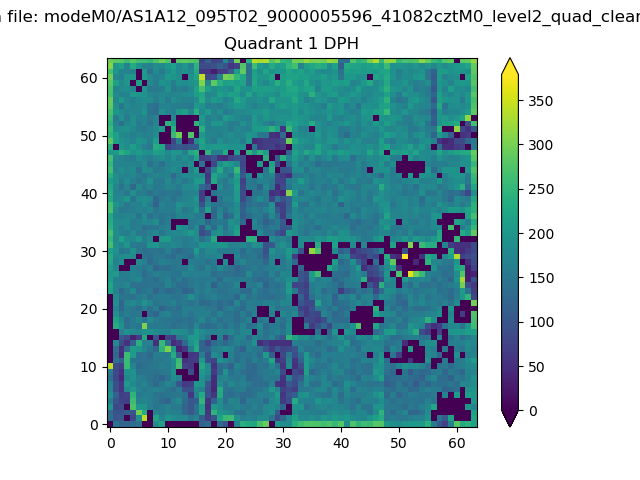 |
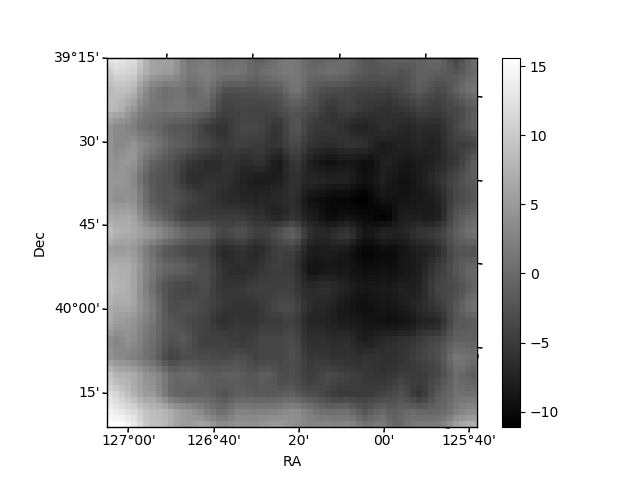
Quadrant B |
|---|---|---|---|
| Quadrant D | 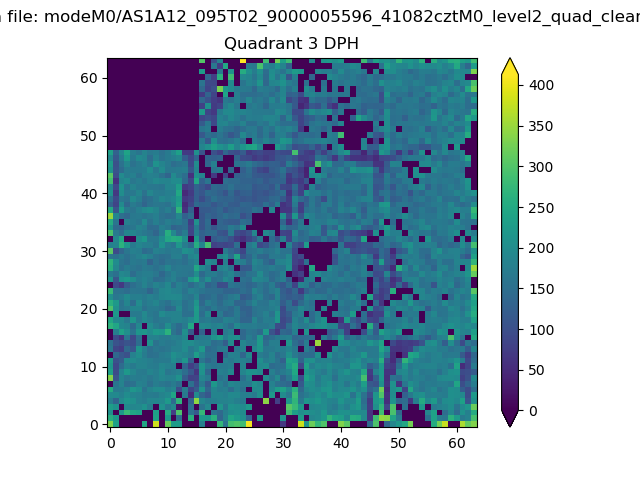 |
 |
Quadrant C |
| Plot type | Count rate plots | Images |
|---|---|---|
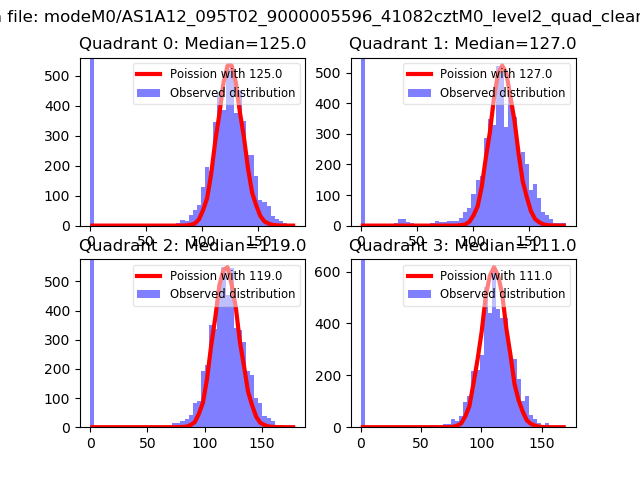
| Comparison with Poisson distribution Blue bars denote a histogram of data divided into 1 sec bins. Red curve is a Poisson curve with rate = median count rate of data. |
 |
 |
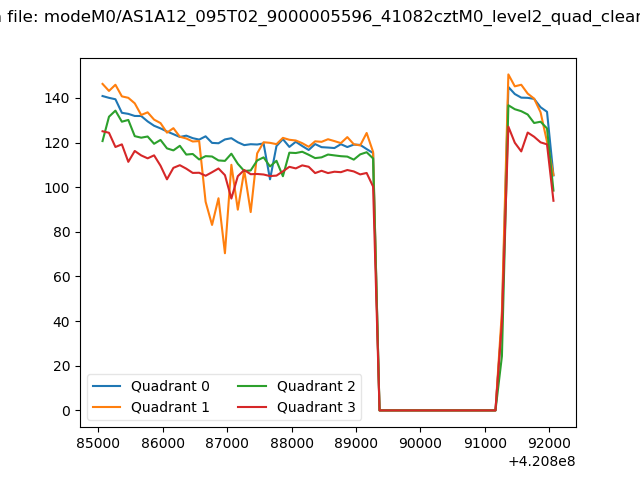
| Quadrant-wise count rates Data is divided into 100 sec bins |
 |
|
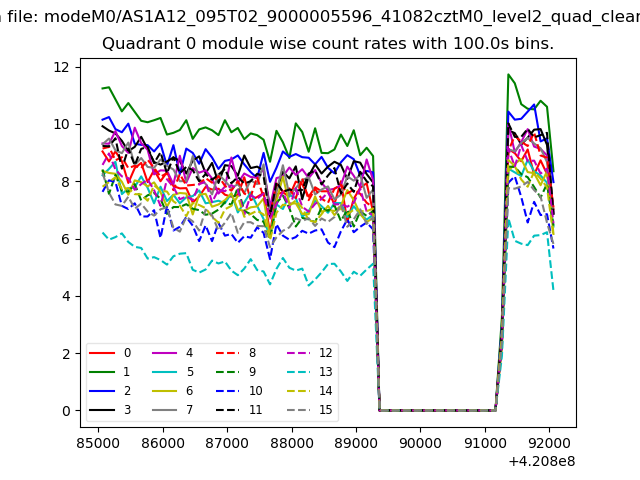
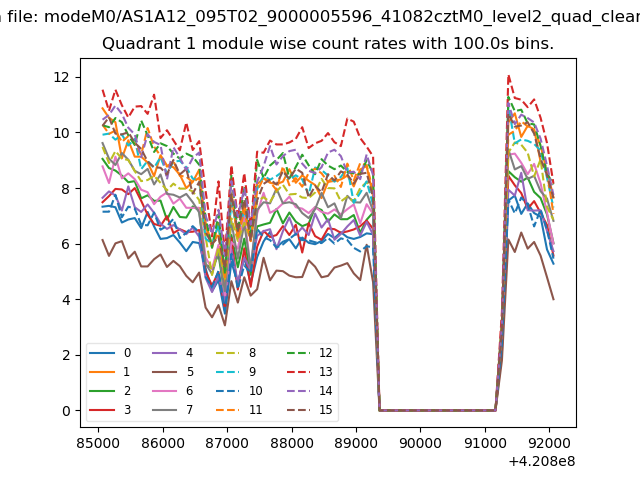
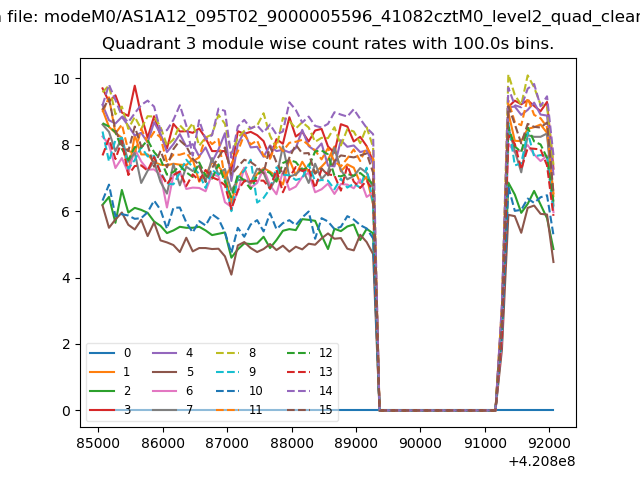
| Module-wise count rates for Quadrant A Data is divided into 100 sec bins |
 |
 |
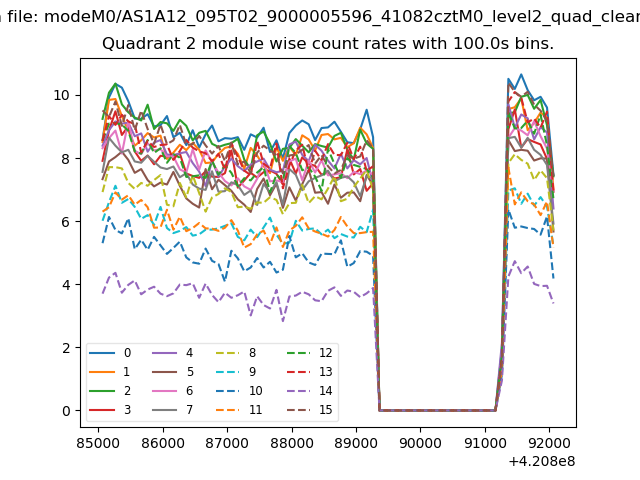
| Module-wise count rates for Quadrant B Data is divided into 100 sec bins |
 |
 |
| Module-wise count rates for Quadrant C Data is divided into 100 sec bins |
 |
 |
| Module-wise count rates for Quadrant D Data is divided into 100 sec bins |
 |
 |
| Parameter | Plot |
|---|---|
| CZT HV Monitor | 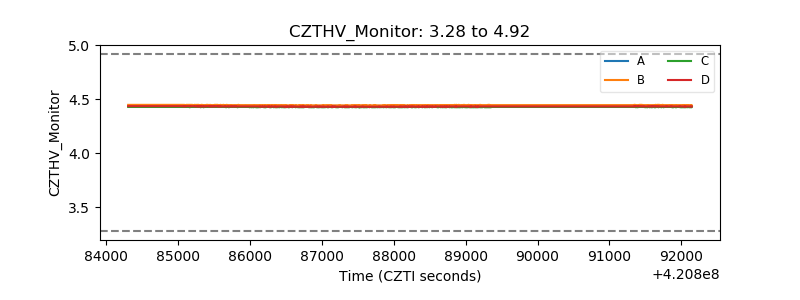 |
| D_VDD | 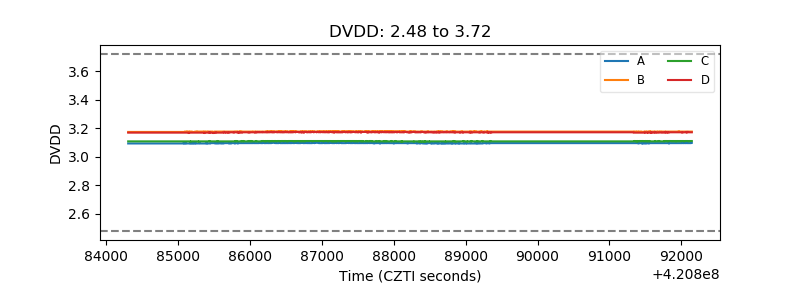 |
| Temperature 1 | 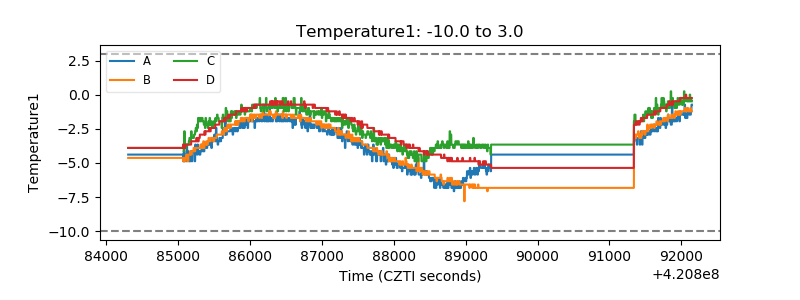 |
| Veto HV Monitor | 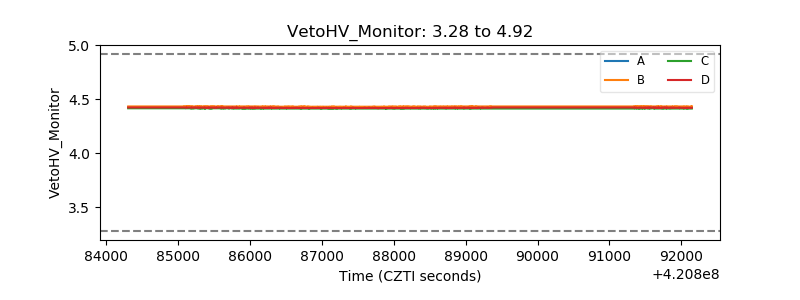 |
| Veto LLD | 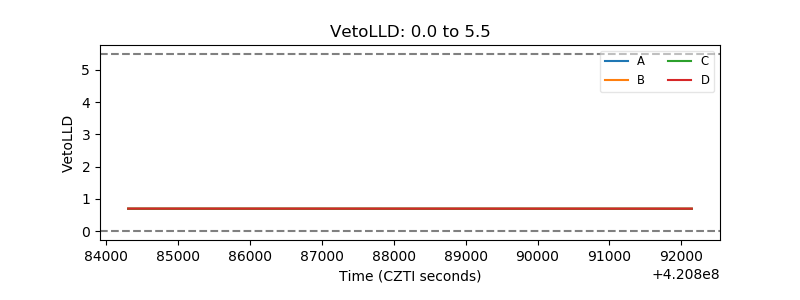 |
| Alpha Counter | 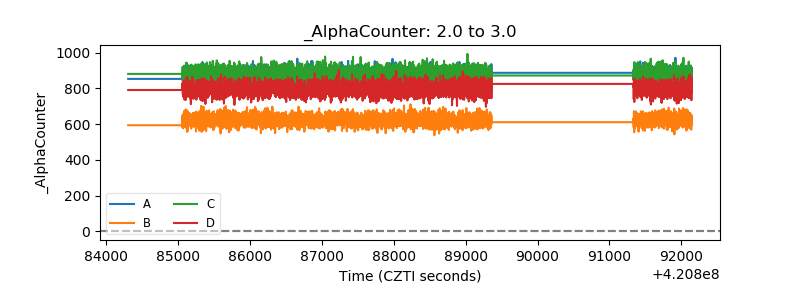 |
| _CPM_Rate | 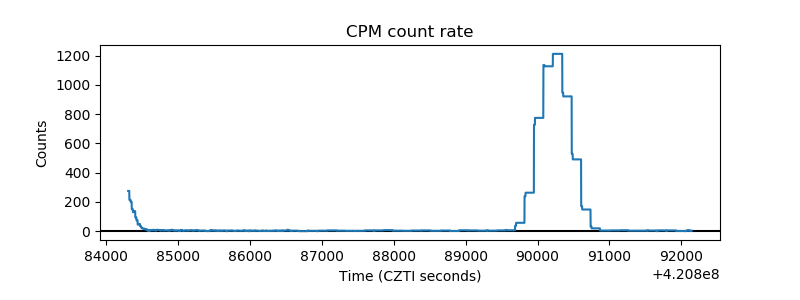 |
| CZT Counter | 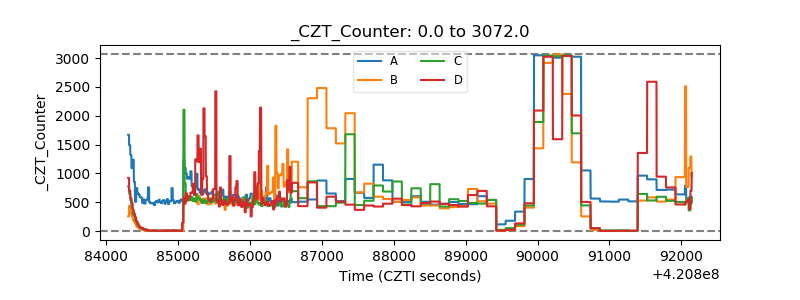 |
| +2.5 Volts monitor |  |
| +5 Volts monitor |  |
| _ROLL_ROT | 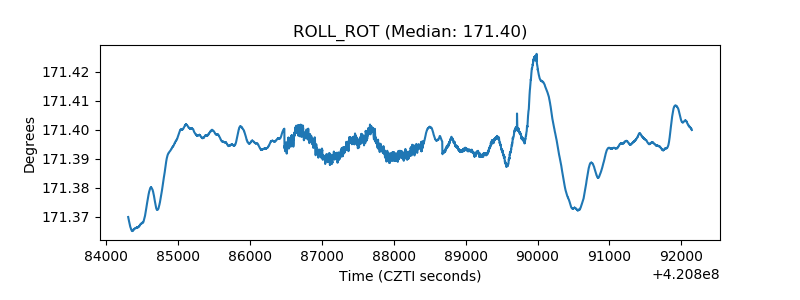 |
| _Roll_DEC |  |
| _Roll_RA | 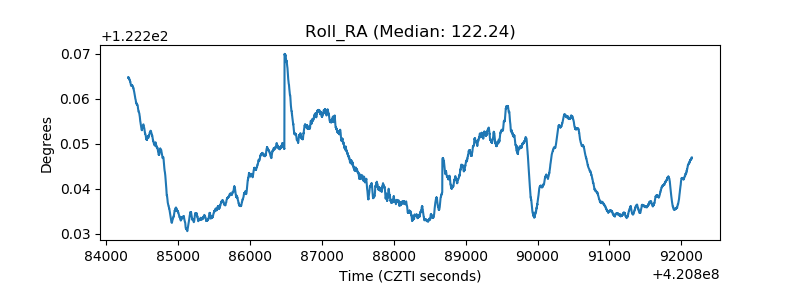 |
| Veto Counter | 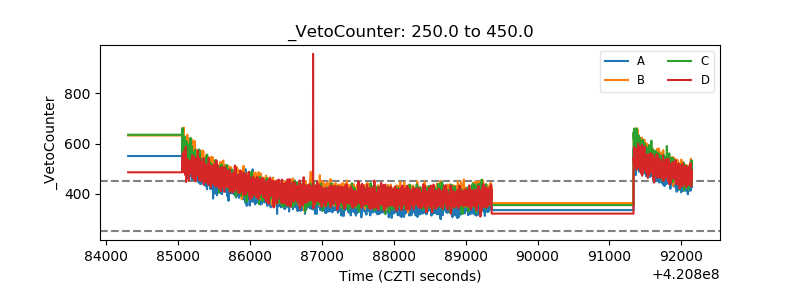 |