| Param | Original file | Final file |
|---|---|---|
| Filename | modeM0/AS1A12_095T02_9000005596_41083cztM0_level2.fits | modeM0/AS1A12_095T02_9000005596_41083cztM0_level2_quad_clean.evt |
| Size (bytes) | 414,555,840 | 93,389,760 |
| Size | 395.4 MB | 89.1 MB |
| Events in quadrant A | 3,158,441 | 671,952 |
| Events in quadrant B | 5,658,056 | 567,681 |
| Events in quadrant C | 2,743,071 | 637,864 |
| Events in quadrant D | 3,374,376 | 580,222 |
| Mode M0 | |||
|---|---|---|---|
| Quadrant | BADHDUFLAG | Total packets | Discarded packets |
| A | 0 | 12692 | 3 |
| B | 0 | 20317 | 2 |
| C | 0 | 11207 | 2 |
| D | 0 | 13391 | 2 |
| Mode SS | |||
|---|---|---|---|
| Quadrant | BADHDUFLAG | Total packets | Discarded packets |
| A | 0 | 108 | 0 |
| B | 0 | 108 | 0 |
| C | 0 | 108 | 0 |
| D | 0 | 108 | 0 |
| Mode M9 | |||
|---|---|---|---|
| Quadrant | BADHDUFLAG | Total packets | Discarded packets |
| A | 0 | 22 | 0 |
| B | 0 | 22 | 0 |
| C | 0 | 22 | 0 |
| D | 0 | 23 | 0 |
| Quadrant | Total seconds | Saturated seconds | Saturation percentage |
|---|---|---|---|
| A | 5289 | 13 | 0.245793% |
| B | 5289 | 1043 | 19.720174% |
| C | 5289 | 30 | 0.567215% |
| D | 5289 | 207 | 3.913783% |
Noise dominated data is calculated using 1-second bins in cleaned event files. If a bin has >2000 counts, and if more than 50% of those come from <1% of pixels, then it is considered to be noise-dominated and hence unusable.
| Quadrant | # 1 sec bins | Bins with >0 counts | Bins with >2000 counts | High rate bins dominated by noise | Noise dominated (total time) | Noise dominated (detector-on time) | Marked lightcurve |
|---|---|---|---|---|---|---|---|
| A | 7352 | 5290 | 2 | 2 | 0.03% | 0.04% | 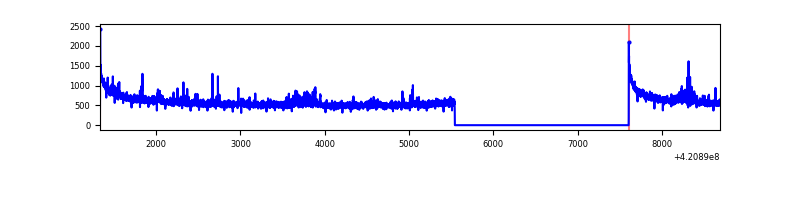 |
| B | 7352 | 5290 | 876 | 876 | 11.92% | 16.56% | 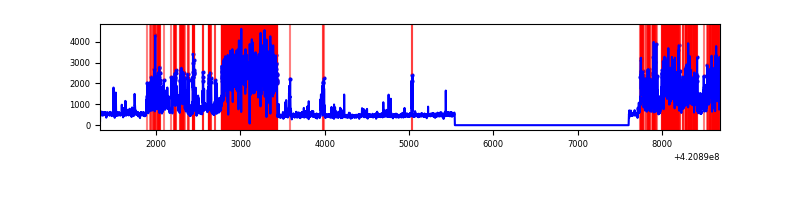 |
| C | 7352 | 5290 | 25 | 25 | 0.34% | 0.47% | 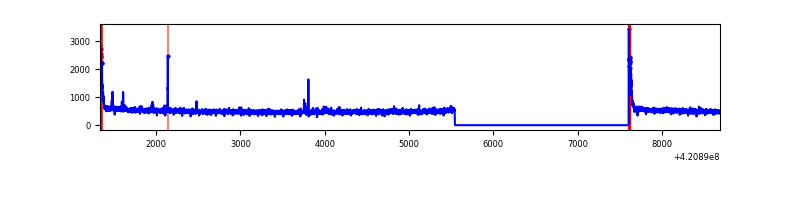 |
| D | 7352 | 5290 | 182 | 182 | 2.48% | 3.44% | 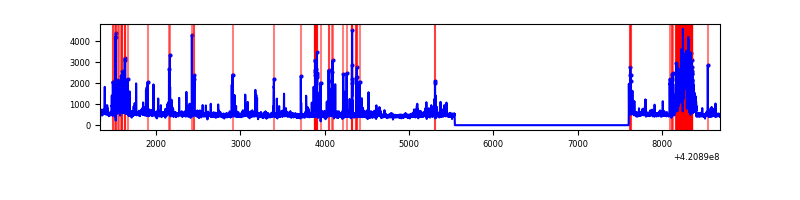 |
Top three noisy pixels from each quadrant. If the there are fewer than three noisy pixels in the level2.evt file, extra rows are filled as -1
| Pixel properties | Quadrant properties | ||||||
|---|---|---|---|---|---|---|---|
| Quadrant | DetID | PixID | Counts | Sigma | Mean | Median | Sigma |
| A | 10 | 83 | 566379 | 4354.35 | 634 | 622 | 129.9 |
| A | 12 | 189 | 68305 | 520.92 | 634 | 622 | 129.9 |
| A | 2 | 79 | 42366 | 321.28 | 634 | 622 | 129.9 |
| B | 0 | 186 | 3222481 | 29315.27 | 576 | 562 | 109.9 |
| B | 0 | 245 | 70677 | 637.96 | 576 | 562 | 109.9 |
| B | 5 | 255 | 57576 | 518.75 | 576 | 562 | 109.9 |
| C | 15 | 214 | 228632 | 1627.87 | 608 | 613 | 140.1 |
| C | 0 | 10 | 113275 | 804.31 | 608 | 613 | 140.1 |
| C | 12 | 249 | 13407 | 91.34 | 608 | 613 | 140.1 |
| D | 2 | 249 | 564623 | 3809.69 | 608 | 592 | 148.1 |
| D | 13 | 171 | 131798 | 886.22 | 608 | 592 | 148.1 |
| D | 13 | 249 | 120466 | 809.68 | 608 | 592 | 148.1 |
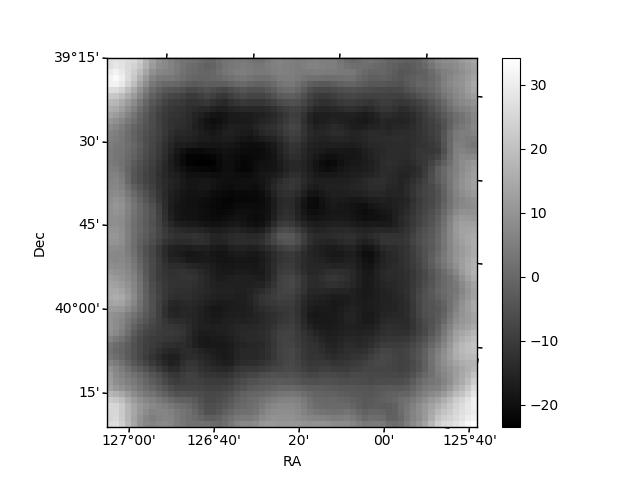
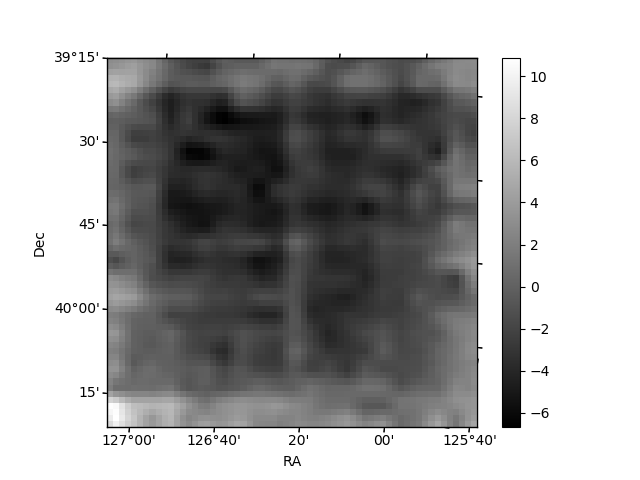
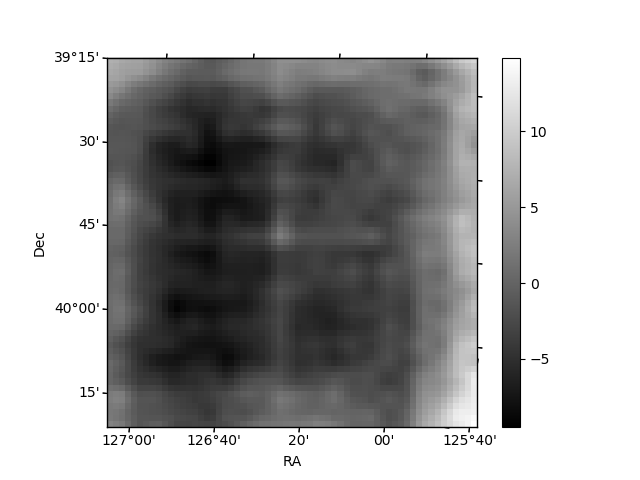
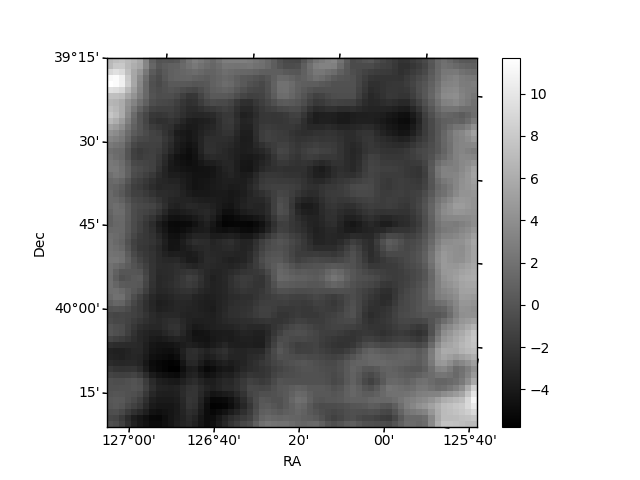
Histogram calculated using DETX and DETY for each event in the final _common_clean file
| Quadrant A | 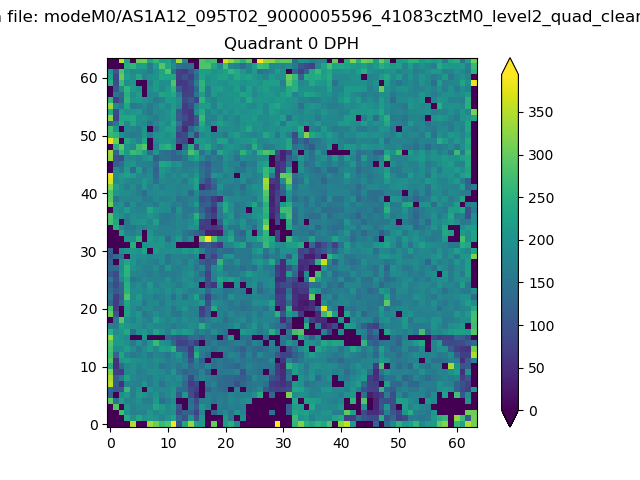 |
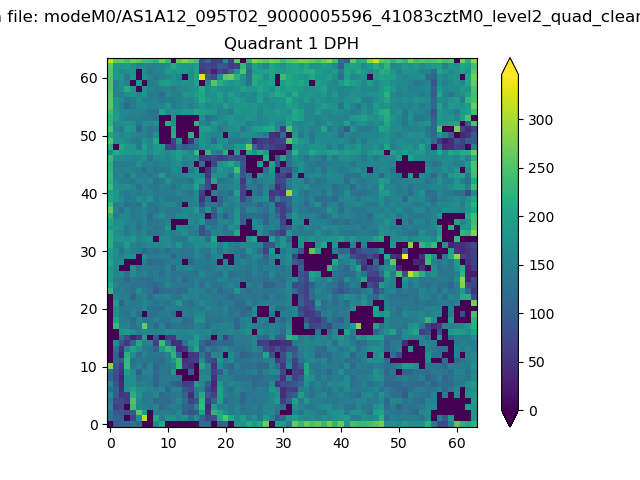 |
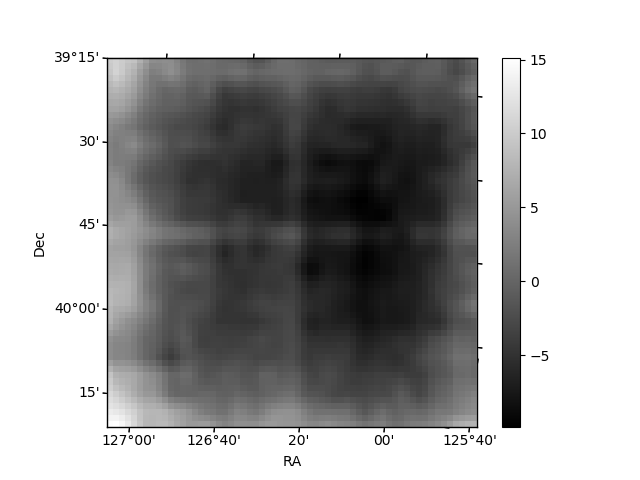
Quadrant B |
|---|---|---|---|
| Quadrant D | 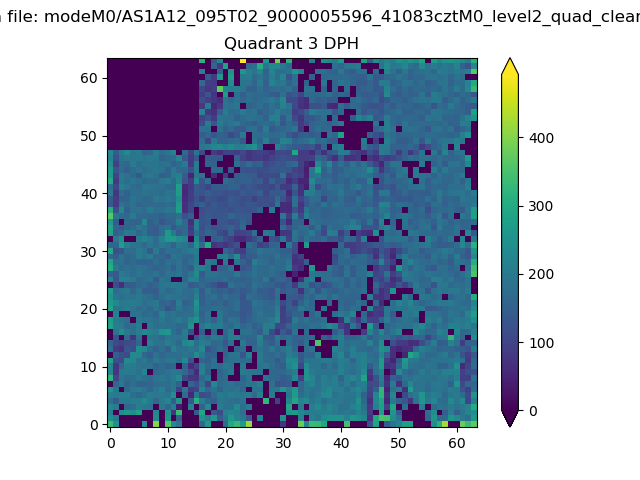 |
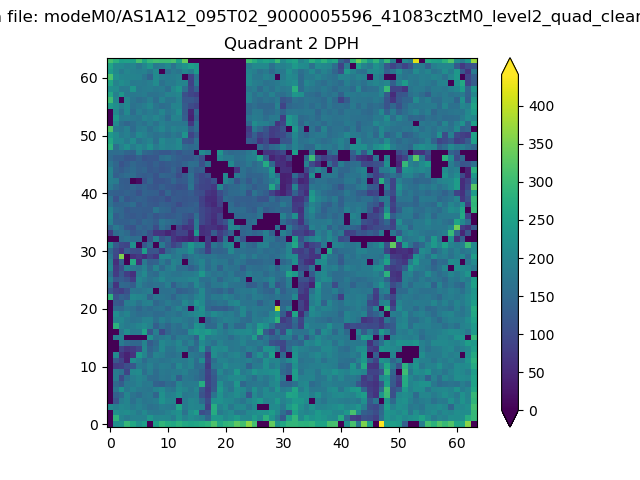 |
Quadrant C |
| Plot type | Count rate plots | Images |
|---|---|---|
| Comparison with Poisson distribution Blue bars denote a histogram of data divided into 1 sec bins. Red curve is a Poisson curve with rate = median count rate of data. |
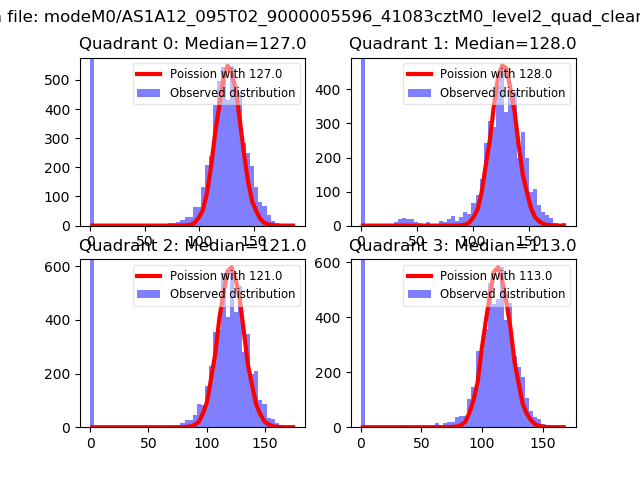 |
 |
| Quadrant-wise count rates Data is divided into 100 sec bins |
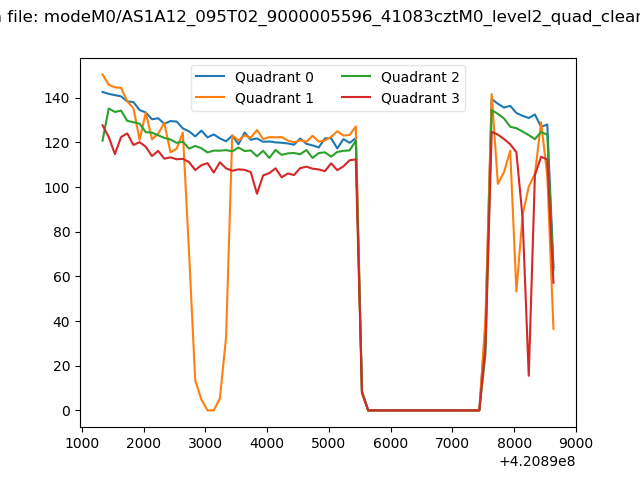 |
|
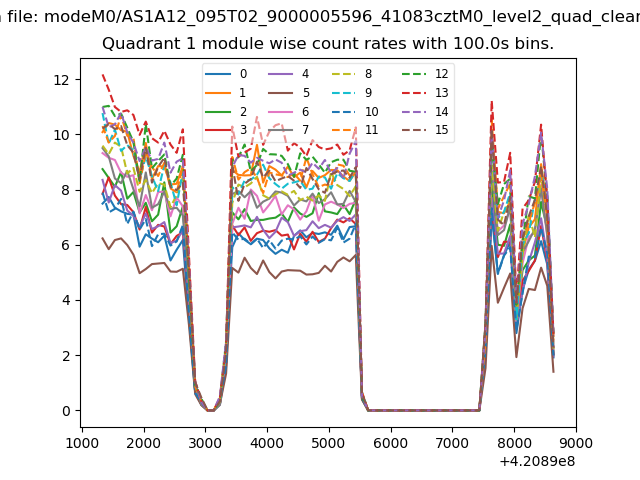
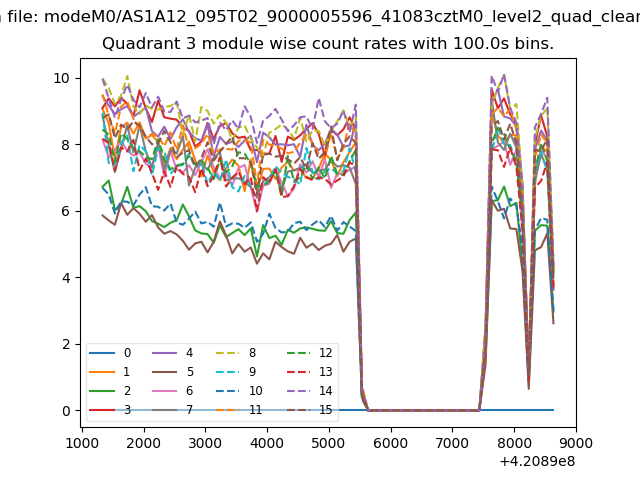
| Module-wise count rates for Quadrant A Data is divided into 100 sec bins |
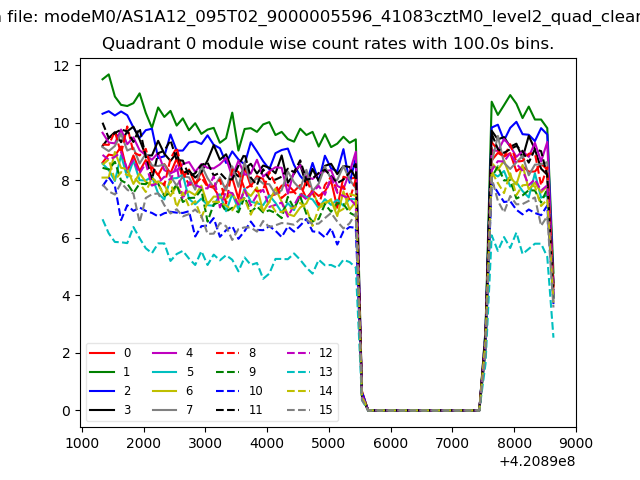 |
 |
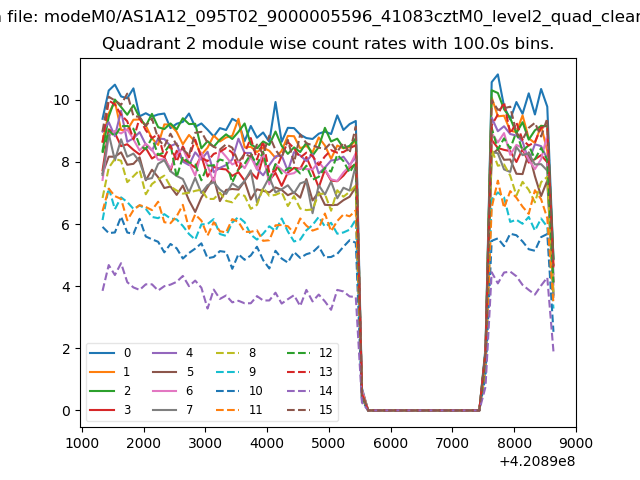
| Module-wise count rates for Quadrant B Data is divided into 100 sec bins |
 |
 |
| Module-wise count rates for Quadrant C Data is divided into 100 sec bins |
 |
 |
| Module-wise count rates for Quadrant D Data is divided into 100 sec bins |
 |
 |
| Parameter | Plot |
|---|---|
| CZT HV Monitor | 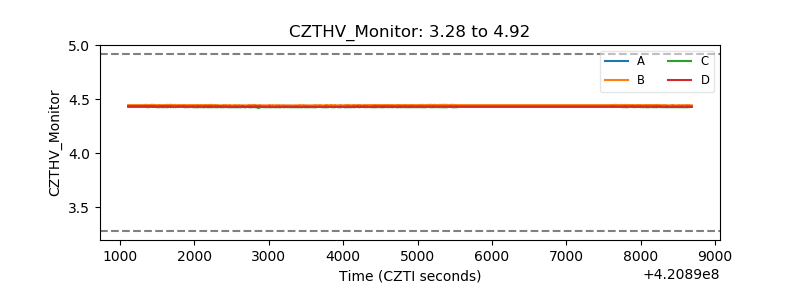 |
| D_VDD | 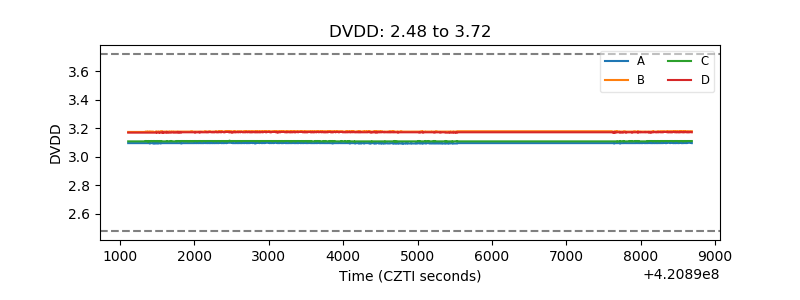 |
| Temperature 1 | 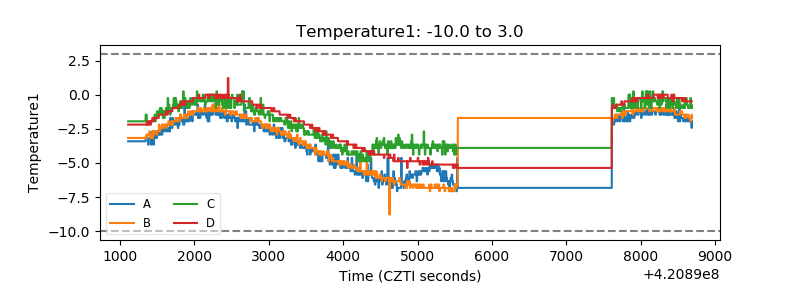 |
| Veto HV Monitor |  |
| Veto LLD | 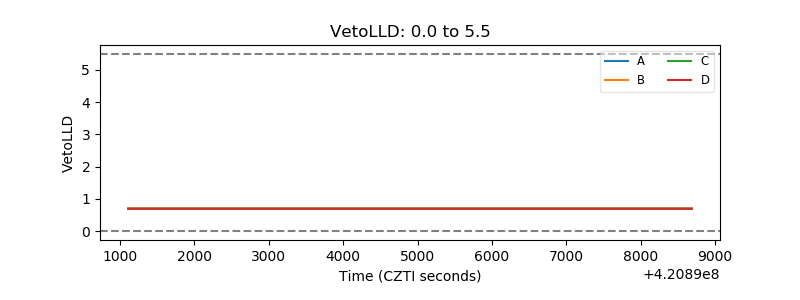 |
| Alpha Counter | 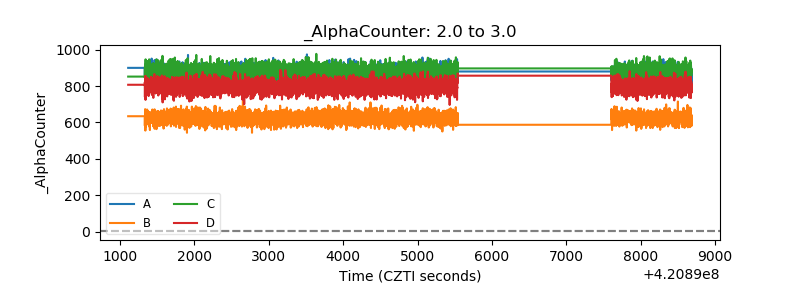 |
| _CPM_Rate | 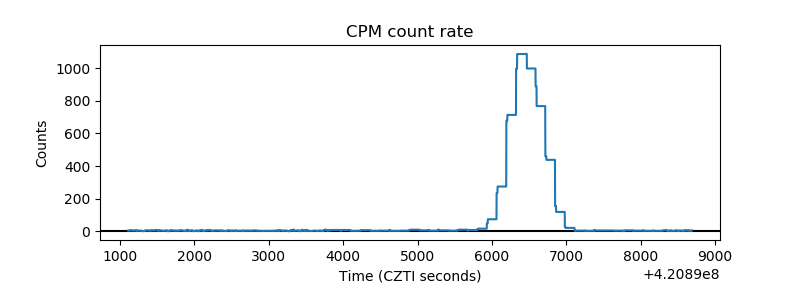 |
| CZT Counter | 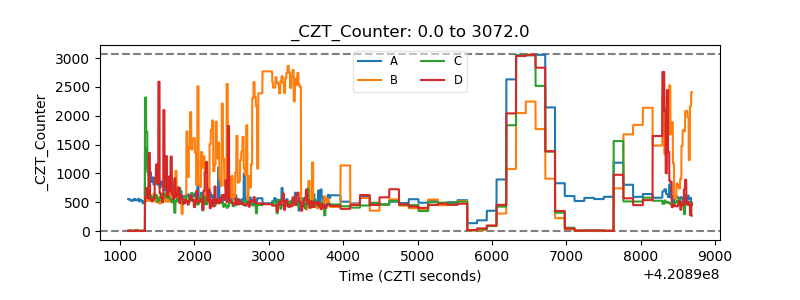 |
| +2.5 Volts monitor | 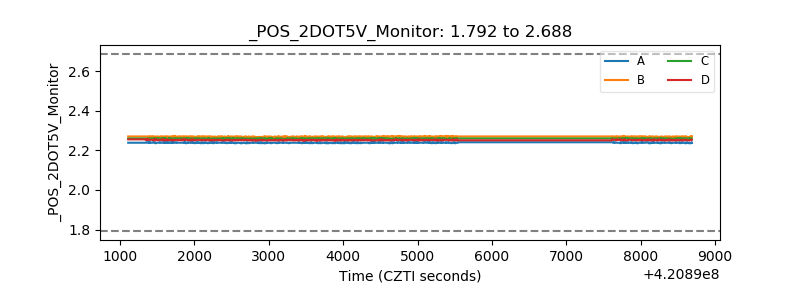 |
| +5 Volts monitor | 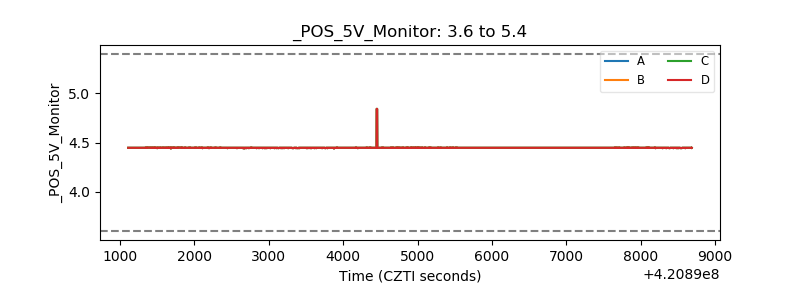 |
| _ROLL_ROT | 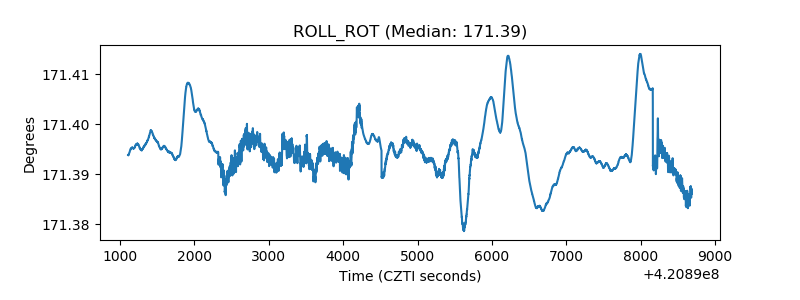 |
| _Roll_DEC | 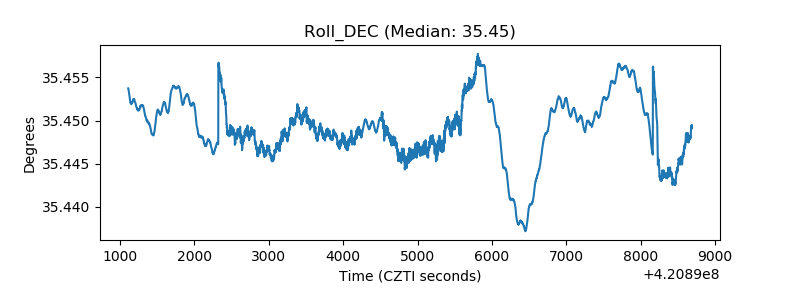 |
| _Roll_RA | 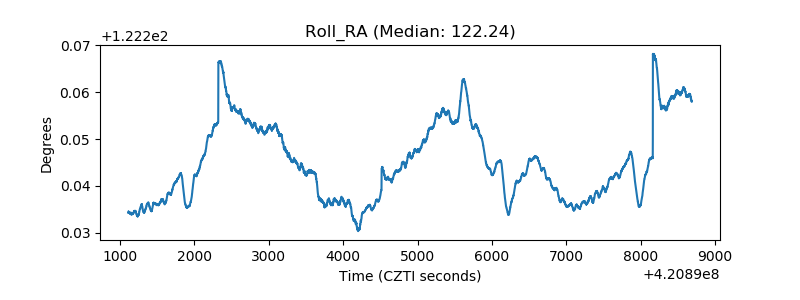 |
| Veto Counter | 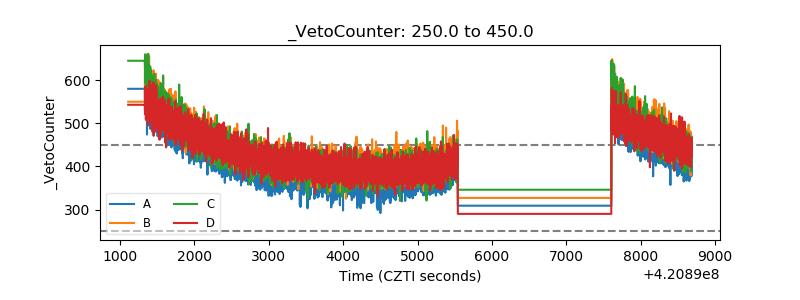 |