| Param | Original file | Final file |
|---|---|---|
| Filename | modeM0/AS1A12_095T02_9000005596_41084cztM0_level2.fits | modeM0/AS1A12_095T02_9000005596_41084cztM0_level2_quad_clean.evt |
| Size (bytes) | 376,629,120 | 89,631,360 |
| Size | 359.2 MB | 85.5 MB |
| Events in quadrant A | 3,132,769 | 628,029 |
| Events in quadrant B | 4,375,171 | 593,509 |
| Events in quadrant C | 2,609,335 | 598,855 |
| Events in quadrant D | 3,427,469 | 535,918 |
| Mode M0 | |||
|---|---|---|---|
| Quadrant | BADHDUFLAG | Total packets | Discarded packets |
| A | 0 | 12629 | 3 |
| B | 0 | 16374 | 2 |
| C | 0 | 10754 | 2 |
| D | 0 | 13526 | 2 |
| Mode SS | |||
|---|---|---|---|
| Quadrant | BADHDUFLAG | Total packets | Discarded packets |
| A | 0 | 106 | 0 |
| B | 0 | 106 | 0 |
| C | 0 | 106 | 0 |
| D | 0 | 106 | 0 |
| Mode M9 | |||
|---|---|---|---|
| Quadrant | BADHDUFLAG | Total packets | Discarded packets |
| A | 0 | 21 | 0 |
| B | 0 | 21 | 0 |
| C | 0 | 21 | 0 |
| D | 0 | 22 | 0 |
| Quadrant | Total seconds | Saturated seconds | Saturation percentage |
|---|---|---|---|
| A | 5100 | 22 | 0.431373% |
| B | 5100 | 475 | 9.313725% |
| C | 5100 | 50 | 0.980392% |
| D | 5100 | 299 | 5.862745% |
Noise dominated data is calculated using 1-second bins in cleaned event files. If a bin has >2000 counts, and if more than 50% of those come from <1% of pixels, then it is considered to be noise-dominated and hence unusable.
| Quadrant | # 1 sec bins | Bins with >0 counts | Bins with >2000 counts | High rate bins dominated by noise | Noise dominated (total time) | Noise dominated (detector-on time) | Marked lightcurve |
|---|---|---|---|---|---|---|---|
| A | 7252 | 5101 | 8 | 8 | 0.11% | 0.16% | 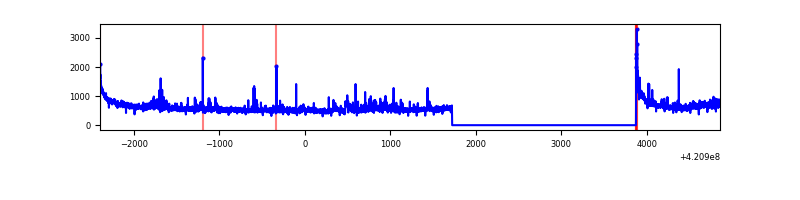 |
| B | 7252 | 5101 | 368 | 368 | 5.07% | 7.21% | 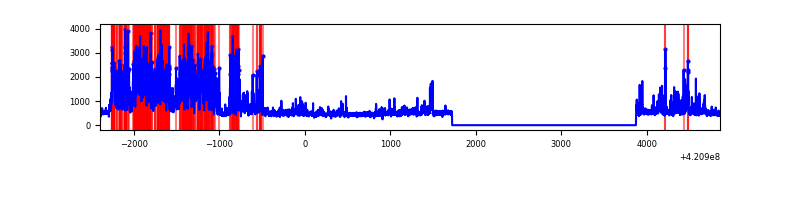 |
| C | 7252 | 5101 | 42 | 42 | 0.58% | 0.82% | 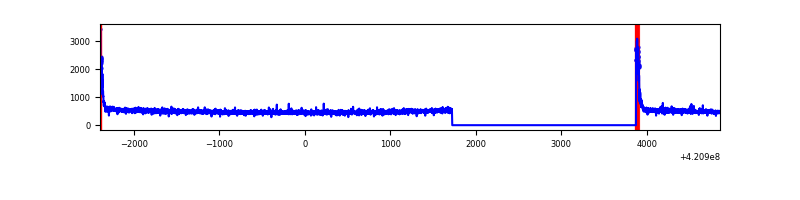 |
| D | 7252 | 5101 | 239 | 239 | 3.30% | 4.69% | 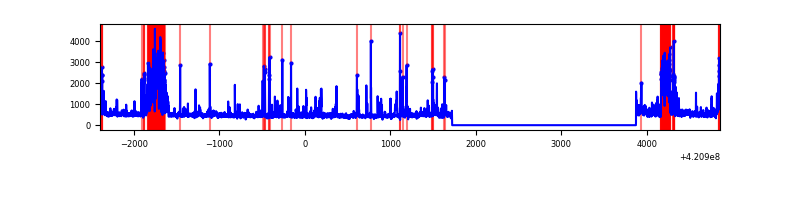 |
Top three noisy pixels from each quadrant. If the there are fewer than three noisy pixels in the level2.evt file, extra rows are filled as -1
| Pixel properties | Quadrant properties | ||||||
|---|---|---|---|---|---|---|---|
| Quadrant | DetID | PixID | Counts | Sigma | Mean | Median | Sigma |
| A | 10 | 83 | 558909 | 4592.73 | 594 | 584 | 121.6 |
| A | 12 | 189 | 168337 | 1379.92 | 594 | 584 | 121.6 |
| A | 2 | 79 | 51387 | 417.9 | 594 | 584 | 121.6 |
| B | 0 | 186 | 1832035 | 16792.73 | 571 | 557 | 109.1 |
| B | 0 | 190 | 177743 | 1624.61 | 571 | 557 | 109.1 |
| B | 5 | 255 | 70132 | 637.93 | 571 | 557 | 109.1 |
| C | 15 | 214 | 217231 | 1604.97 | 574 | 577 | 135.0 |
| C | 0 | 10 | 148509 | 1095.88 | 574 | 577 | 135.0 |
| C | 14 | 254 | 5175 | 34.06 | 574 | 577 | 135.0 |
| D | 2 | 249 | 482143 | 3427.0 | 569 | 554 | 140.5 |
| D | 12 | 233 | 303337 | 2154.61 | 569 | 554 | 140.5 |
| D | 13 | 171 | 132069 | 935.86 | 569 | 554 | 140.5 |
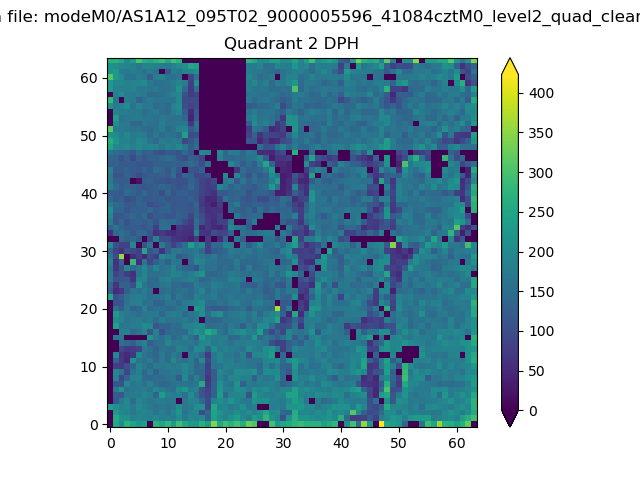
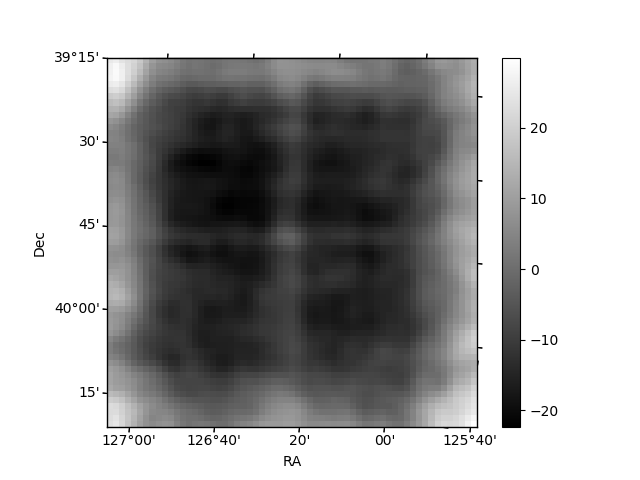
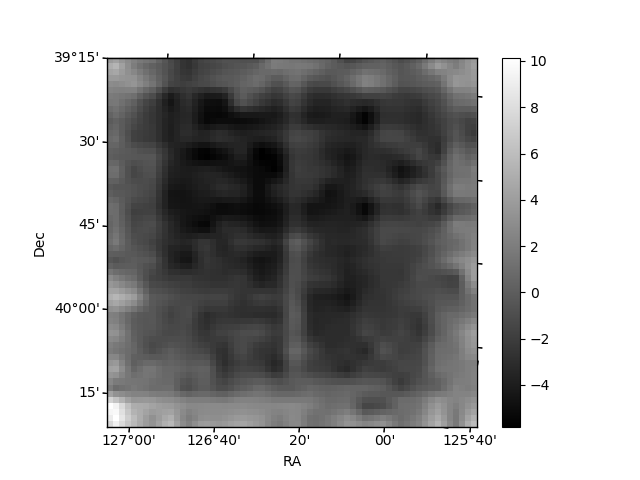
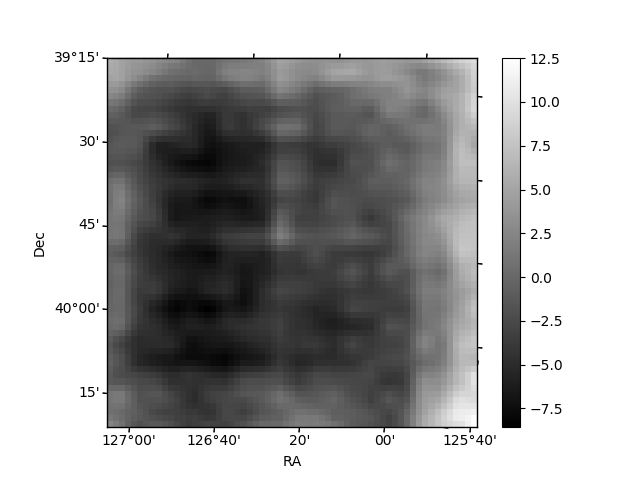
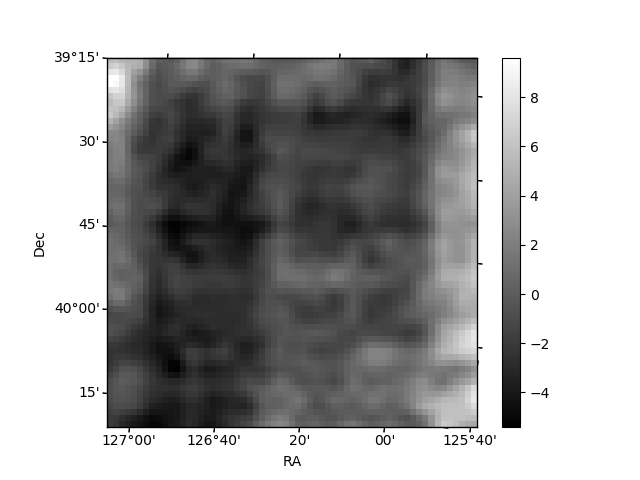
Histogram calculated using DETX and DETY for each event in the final _common_clean file
| Quadrant A | 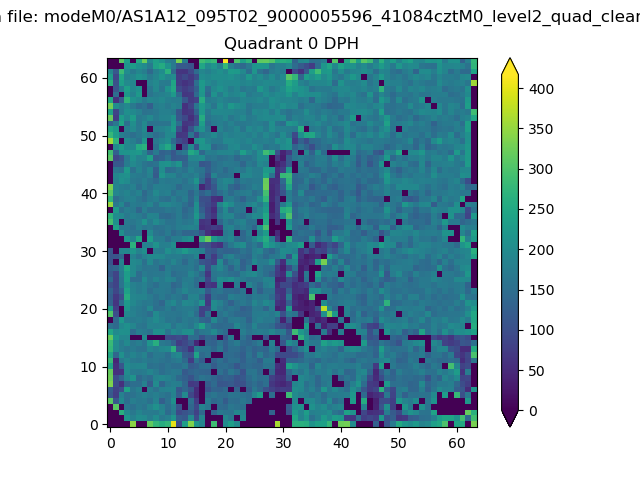 |
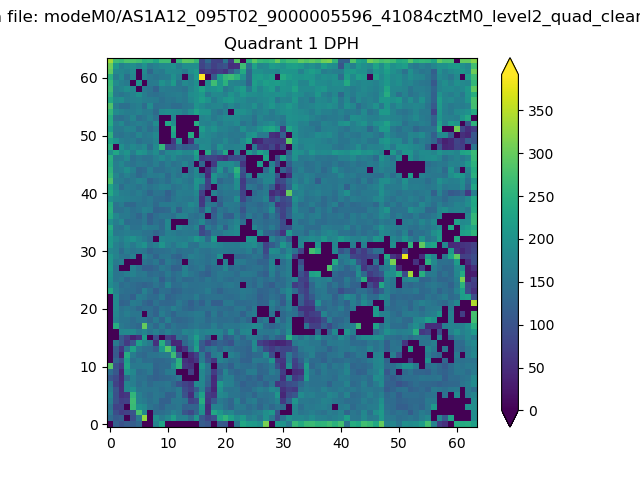 |
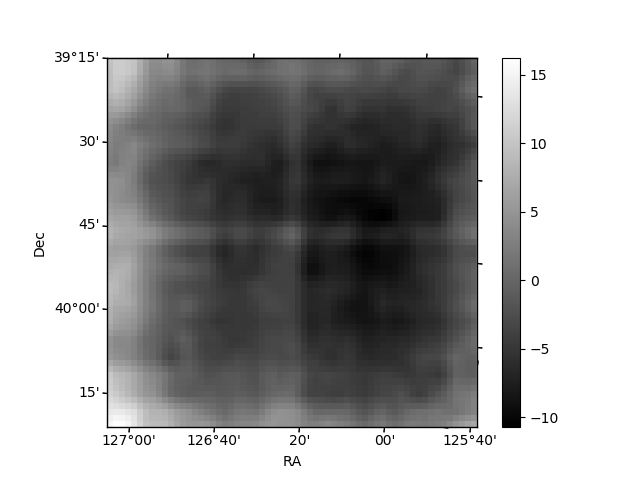
Quadrant B |
|---|---|---|---|
| Quadrant D | 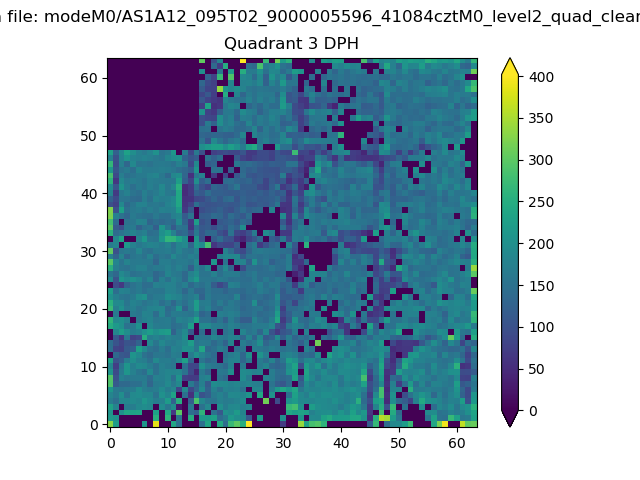 |
 |
Quadrant C |
| Plot type | Count rate plots | Images |
|---|---|---|
| Comparison with Poisson distribution Blue bars denote a histogram of data divided into 1 sec bins. Red curve is a Poisson curve with rate = median count rate of data. |
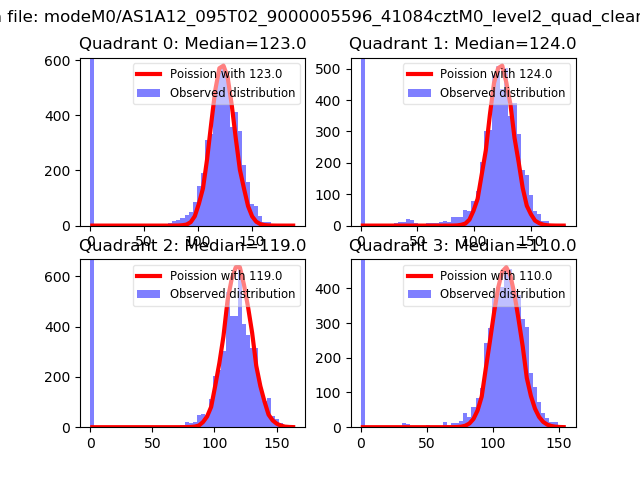 |
 |
| Quadrant-wise count rates Data is divided into 100 sec bins |
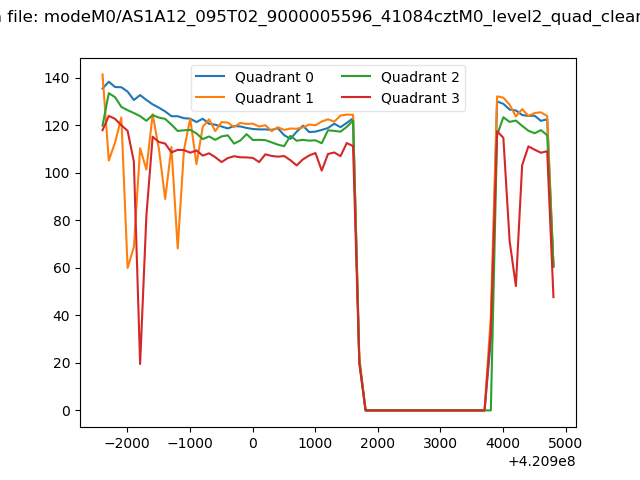 |
|
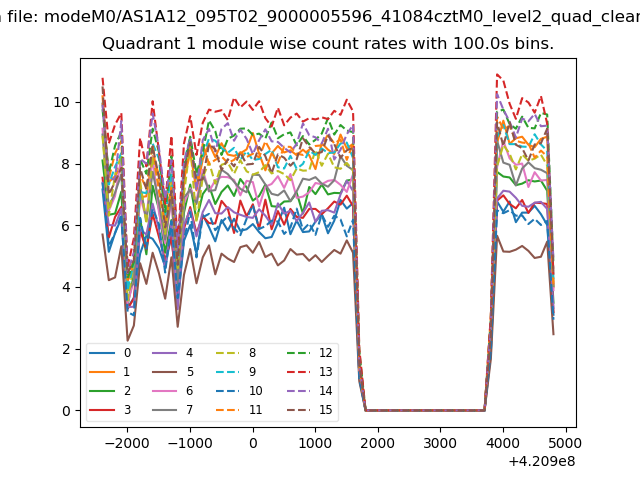
| Module-wise count rates for Quadrant A Data is divided into 100 sec bins |
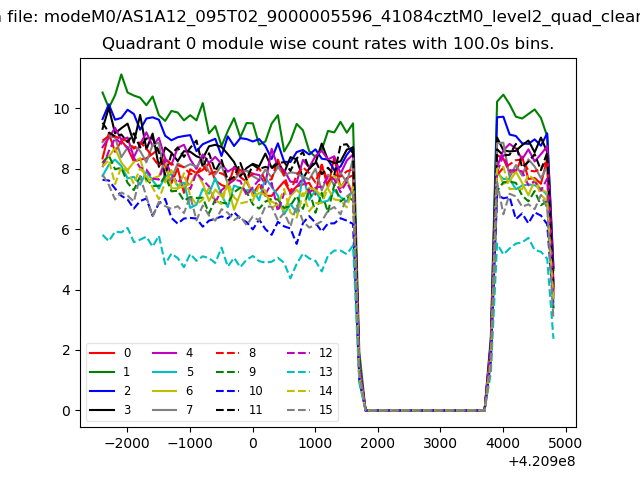 |
 |
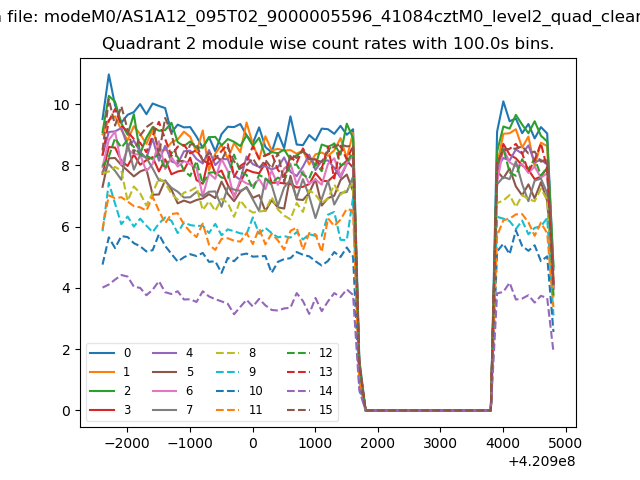
| Module-wise count rates for Quadrant B Data is divided into 100 sec bins |
 |
 |
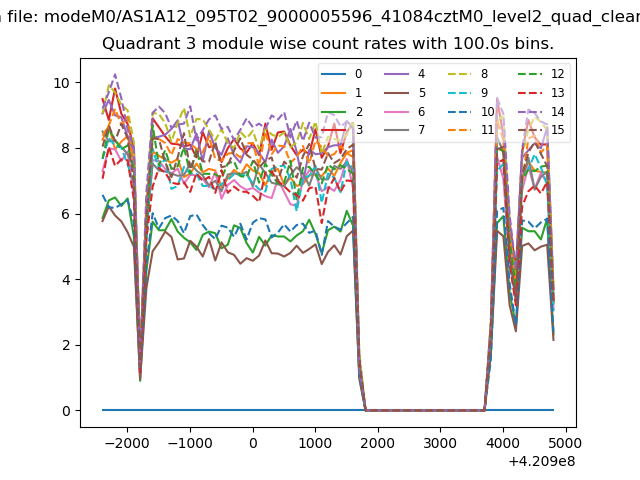
| Module-wise count rates for Quadrant C Data is divided into 100 sec bins |
 |
 |
| Module-wise count rates for Quadrant D Data is divided into 100 sec bins |
 |
 |
| Parameter | Plot |
|---|---|
| CZT HV Monitor | 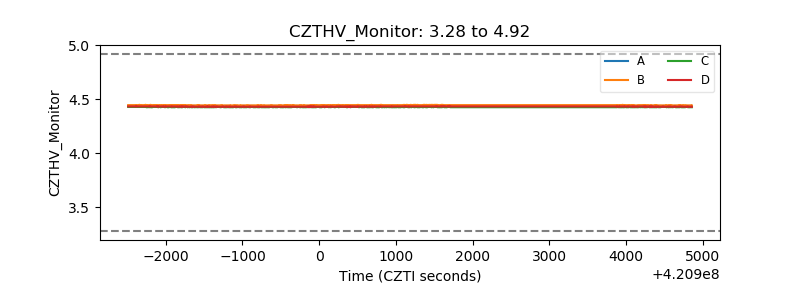 |
| D_VDD | 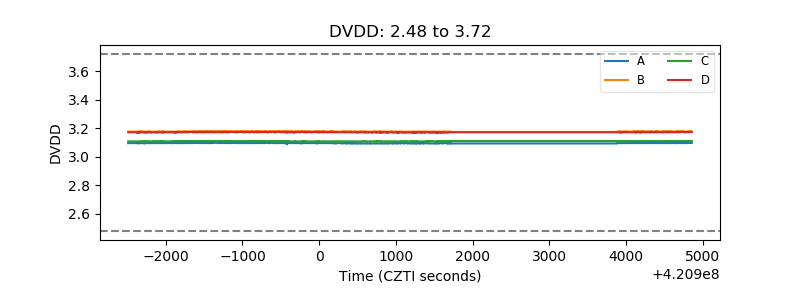 |
| Temperature 1 | 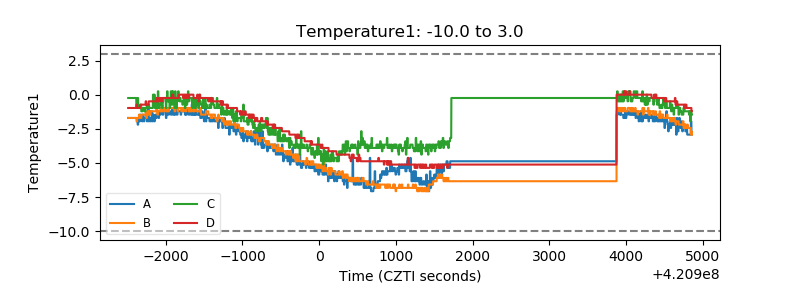 |
| Veto HV Monitor | 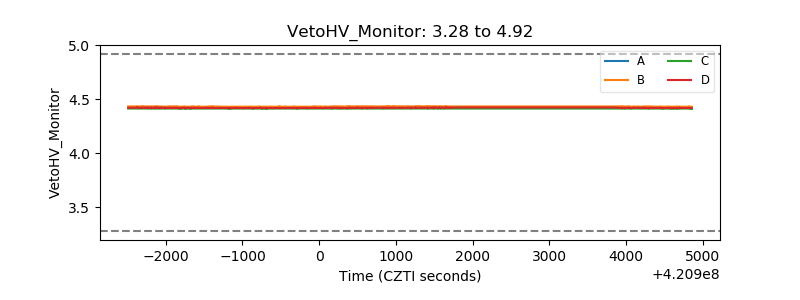 |
| Veto LLD | 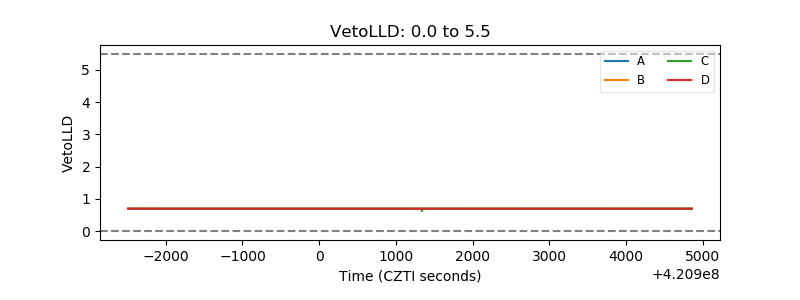 |
| Alpha Counter |  |
| _CPM_Rate | 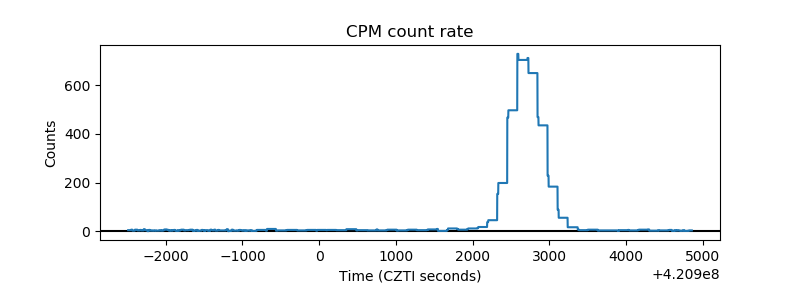 |
| CZT Counter | 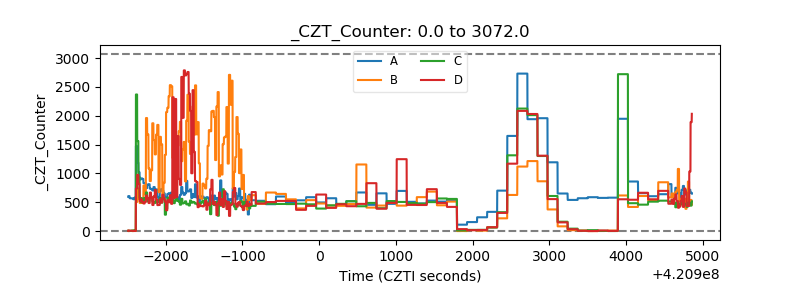 |
| +2.5 Volts monitor | 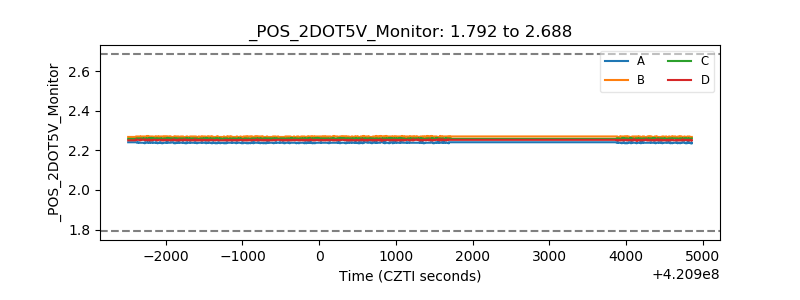 |
| +5 Volts monitor |  |
| _ROLL_ROT | 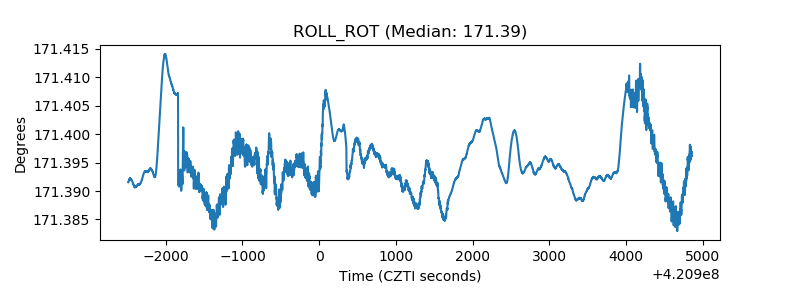 |
| _Roll_DEC | 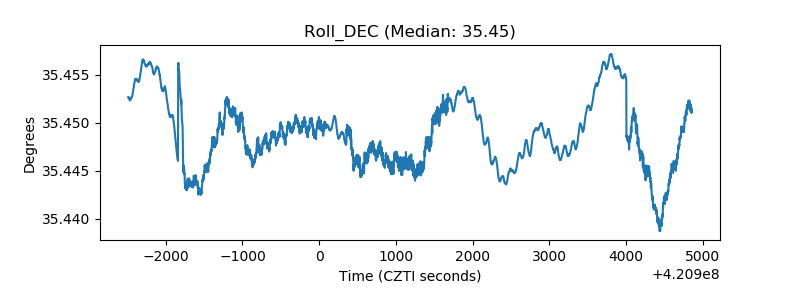 |
| _Roll_RA | 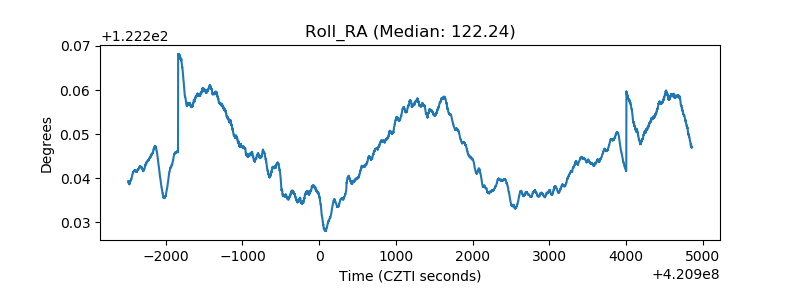 |
| Veto Counter | 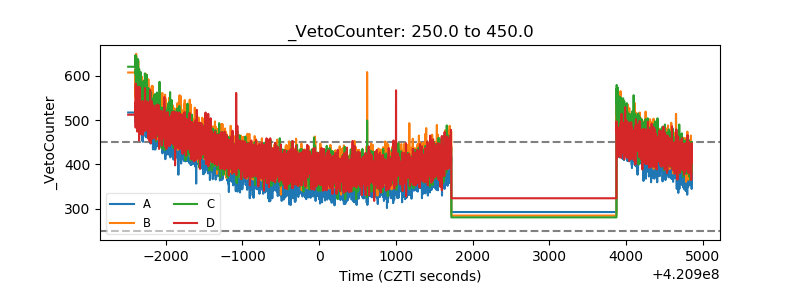 |