| Param | Original file | Final file |
|---|---|---|
| Filename | modeM0/AS1A12_095T02_9000005596_41085cztM0_level2.fits | modeM0/AS1A12_095T02_9000005596_41085cztM0_level2_quad_clean.evt |
| Size (bytes) | 328,717,440 | 86,051,520 |
| Size | 313.5 MB | 82.1 MB |
| Events in quadrant A | 3,181,558 | 588,217 |
| Events in quadrant B | 2,693,439 | 598,882 |
| Events in quadrant C | 2,603,901 | 560,032 |
| Events in quadrant D | 3,298,823 | 507,186 |
| Mode M0 | |||
|---|---|---|---|
| Quadrant | BADHDUFLAG | Total packets | Discarded packets |
| A | 0 | 12933 | 3 |
| B | 0 | 11427 | 2 |
| C | 0 | 10826 | 2 |
| D | 0 | 13173 | 2 |
| Mode SS | |||
|---|---|---|---|
| Quadrant | BADHDUFLAG | Total packets | Discarded packets |
| A | 0 | 102 | 0 |
| B | 0 | 102 | 0 |
| C | 0 | 102 | 0 |
| D | 0 | 102 | 0 |
| Mode M9 | |||
|---|---|---|---|
| Quadrant | BADHDUFLAG | Total packets | Discarded packets |
| A | 0 | 21 | 0 |
| B | 0 | 21 | 0 |
| C | 0 | 21 | 0 |
| D | 0 | 22 | 0 |
| Quadrant | Total seconds | Saturated seconds | Saturation percentage |
|---|---|---|---|
| A | 5011 | 30 | 0.598683% |
| B | 5011 | 29 | 0.578727% |
| C | 5011 | 80 | 1.596488% |
| D | 5011 | 257 | 5.128717% |
Noise dominated data is calculated using 1-second bins in cleaned event files. If a bin has >2000 counts, and if more than 50% of those come from <1% of pixels, then it is considered to be noise-dominated and hence unusable.
| Quadrant | # 1 sec bins | Bins with >0 counts | Bins with >2000 counts | High rate bins dominated by noise | Noise dominated (total time) | Noise dominated (detector-on time) | Marked lightcurve |
|---|---|---|---|---|---|---|---|
| A | 7134 | 5012 | 9 | 9 | 0.13% | 0.18% | 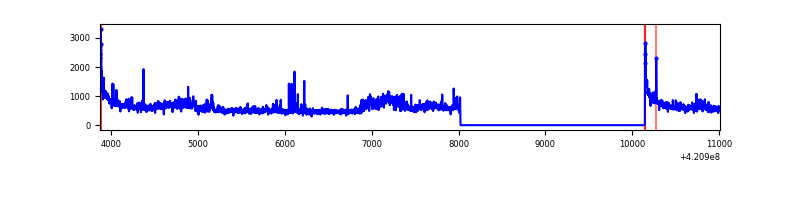 |
| B | 7134 | 5012 | 18 | 18 | 0.25% | 0.36% | 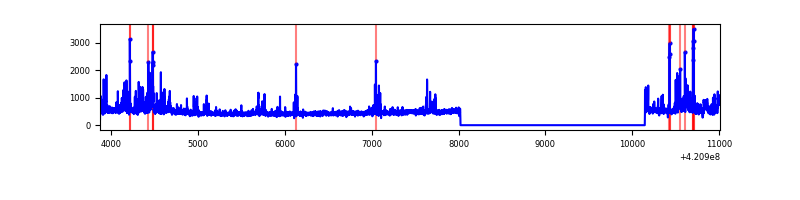 |
| C | 7134 | 5012 | 65 | 65 | 0.91% | 1.30% | 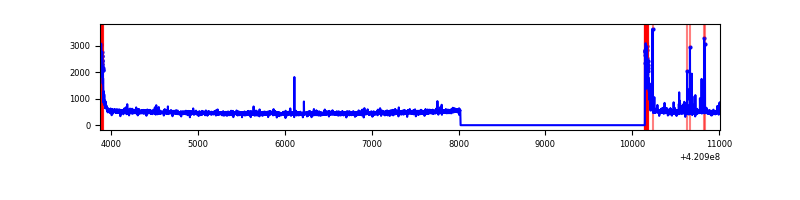 |
| D | 7134 | 5012 | 211 | 211 | 2.96% | 4.21% | 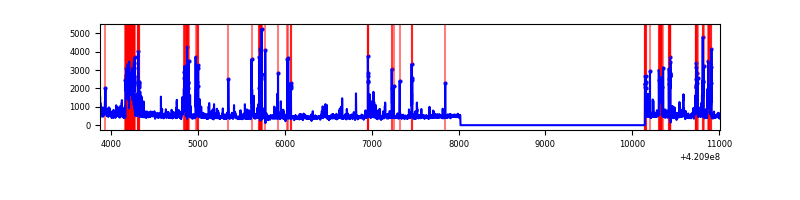 |
Top three noisy pixels from each quadrant. If the there are fewer than three noisy pixels in the level2.evt file, extra rows are filled as -1
| Pixel properties | Quadrant properties | ||||||
|---|---|---|---|---|---|---|---|
| Quadrant | DetID | PixID | Counts | Sigma | Mean | Median | Sigma |
| A | 10 | 83 | 543454 | 4689.28 | 562 | 552 | 115.8 |
| A | 12 | 189 | 392110 | 3382.06 | 562 | 552 | 115.8 |
| A | 13 | 248 | 37155 | 316.16 | 562 | 552 | 115.8 |
| B | 0 | 186 | 225653 | 2084.49 | 558 | 543 | 108.0 |
| B | 5 | 32 | 85249 | 784.37 | 558 | 543 | 108.0 |
| B | 5 | 255 | 72660 | 667.79 | 558 | 543 | 108.0 |
| C | 15 | 214 | 213339 | 1668.63 | 546 | 550 | 127.5 |
| C | 0 | 10 | 190864 | 1492.39 | 546 | 550 | 127.5 |
| C | 14 | 254 | 61285 | 476.27 | 546 | 550 | 127.5 |
| D | 12 | 233 | 373565 | 2824.3 | 540 | 525 | 132.1 |
| D | 13 | 249 | 248042 | 1873.96 | 540 | 525 | 132.1 |
| D | 2 | 249 | 158528 | 1196.24 | 540 | 525 | 132.1 |
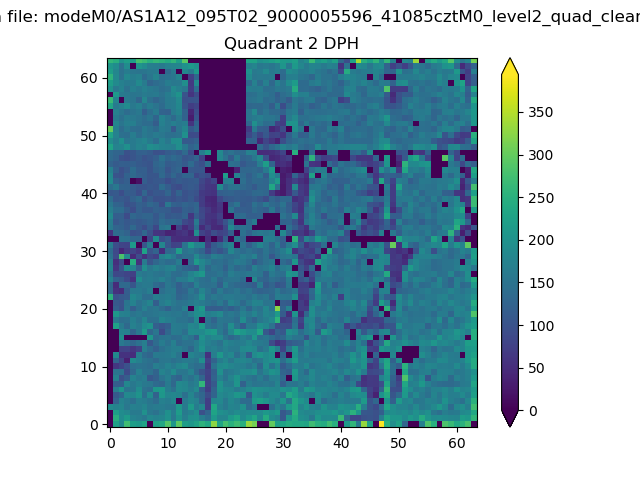
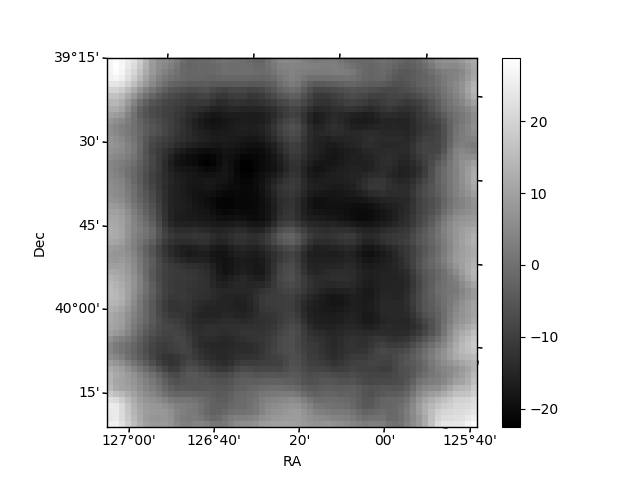
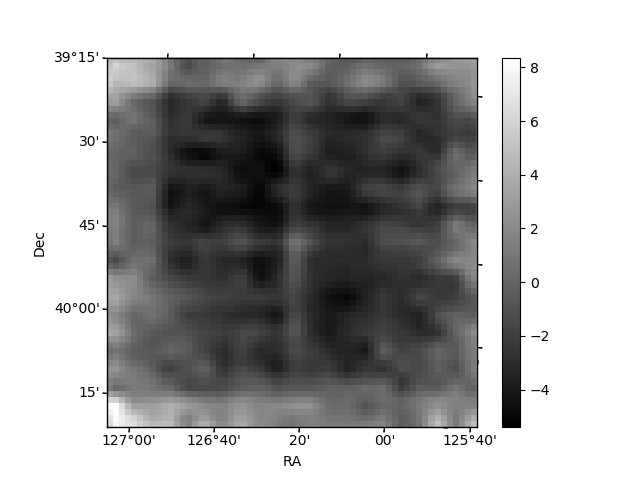
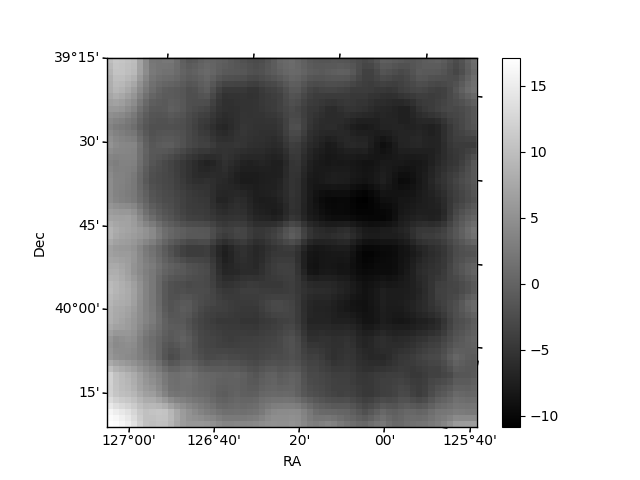
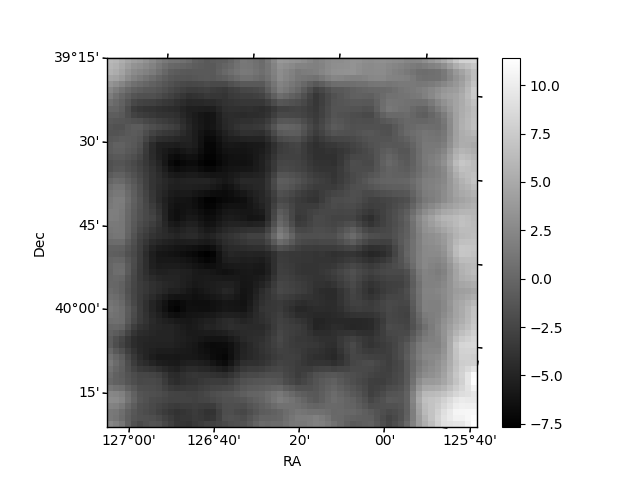
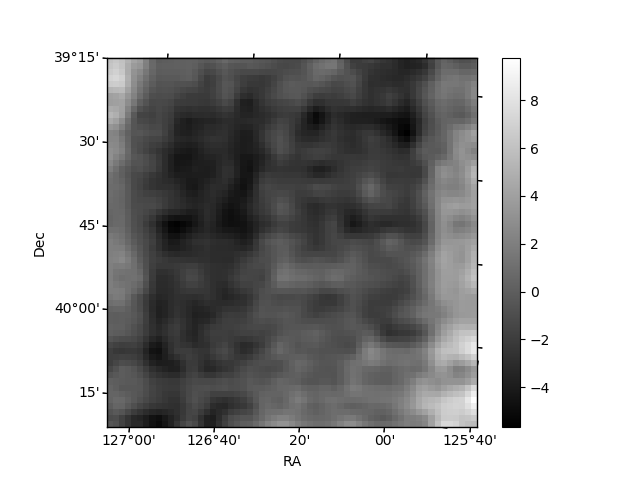
Histogram calculated using DETX and DETY for each event in the final _common_clean file
| Quadrant A | 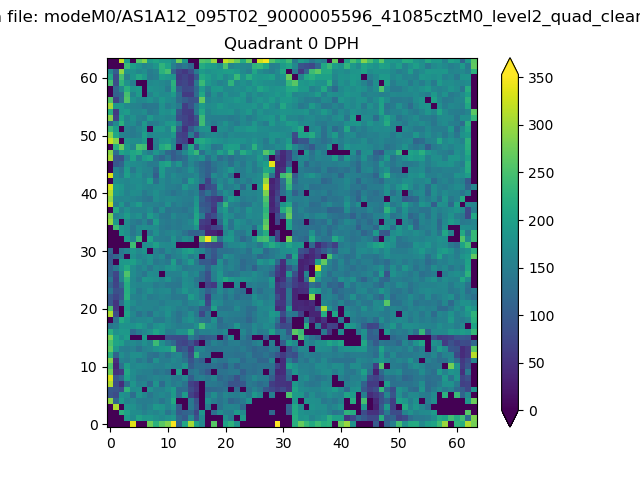 |
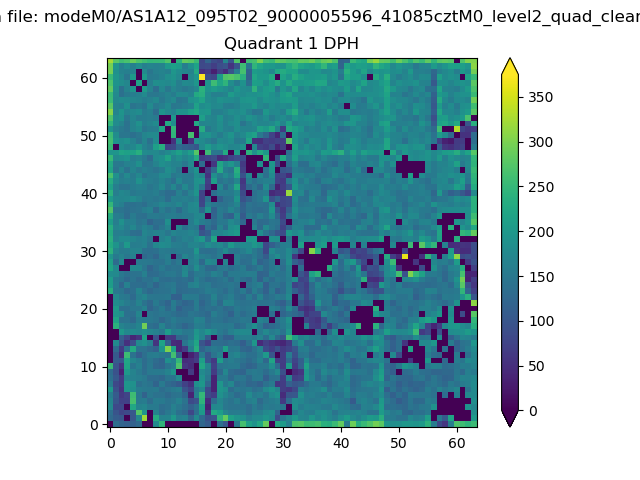 |
Quadrant B |
|---|---|---|---|
| Quadrant D | 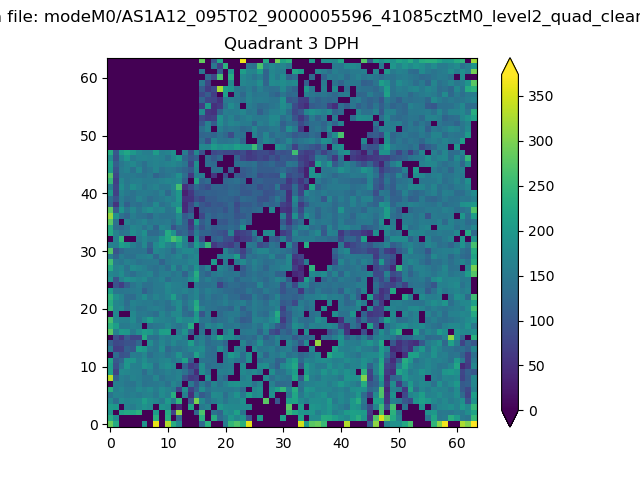 |
 |
Quadrant C |
| Plot type | Count rate plots | Images |
|---|---|---|
| Comparison with Poisson distribution Blue bars denote a histogram of data divided into 1 sec bins. Red curve is a Poisson curve with rate = median count rate of data. |
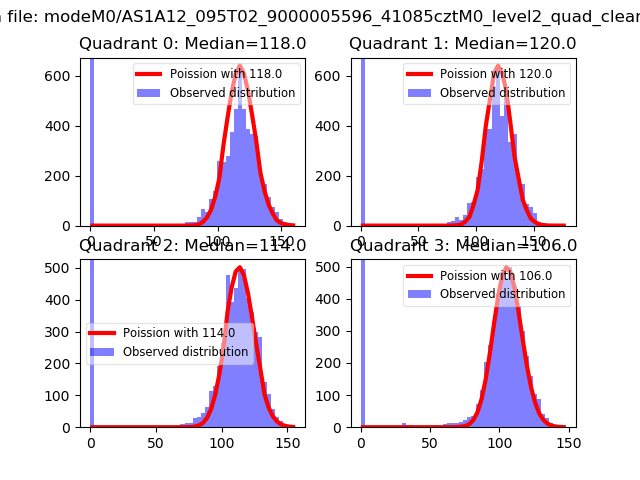 |
 |
| Quadrant-wise count rates Data is divided into 100 sec bins |
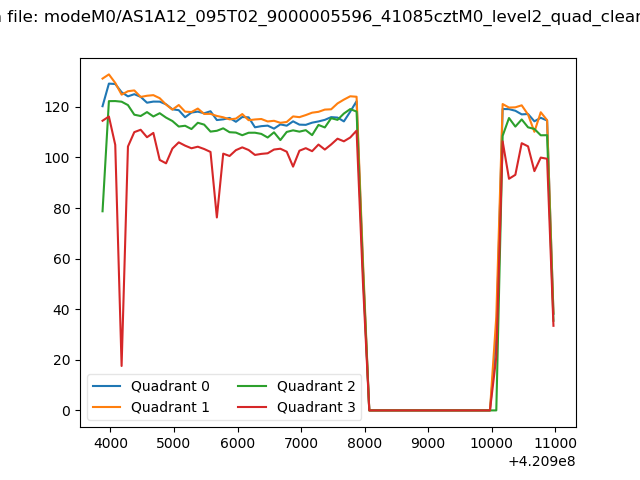 |
|
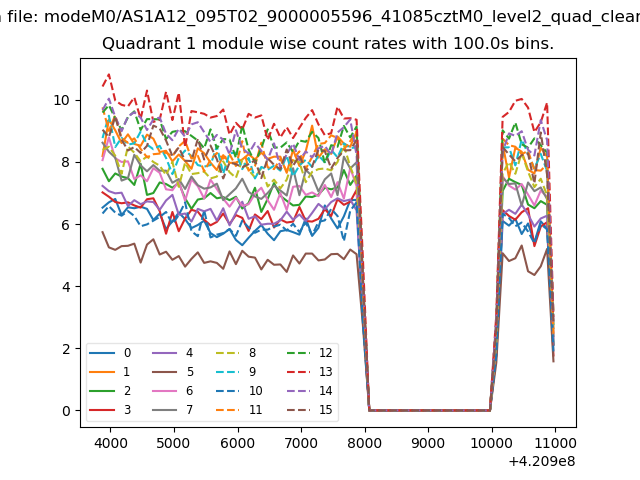
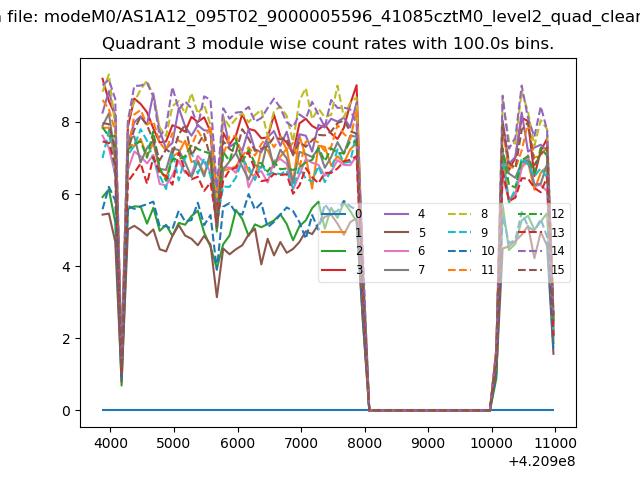
| Module-wise count rates for Quadrant A Data is divided into 100 sec bins |
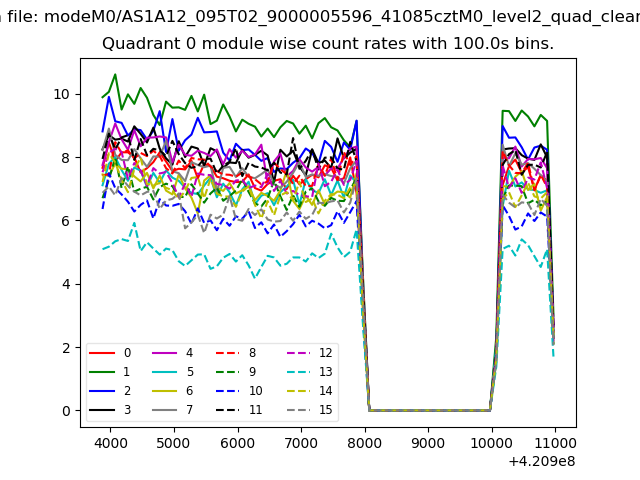 |
 |
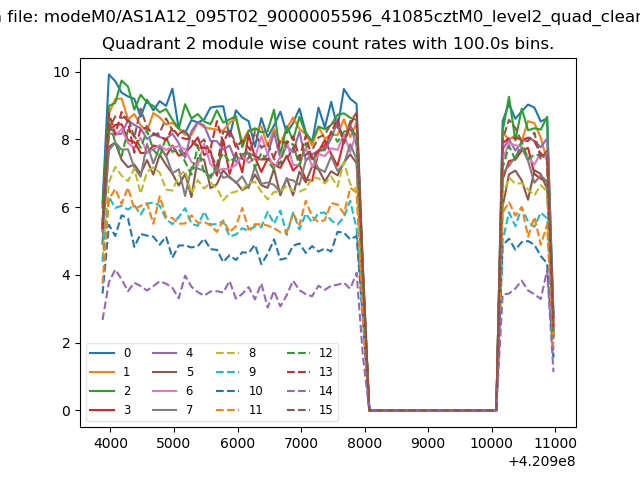
| Module-wise count rates for Quadrant B Data is divided into 100 sec bins |
 |
 |
| Module-wise count rates for Quadrant C Data is divided into 100 sec bins |
 |
 |
| Module-wise count rates for Quadrant D Data is divided into 100 sec bins |
 |
 |
| Parameter | Plot |
|---|---|
| CZT HV Monitor | 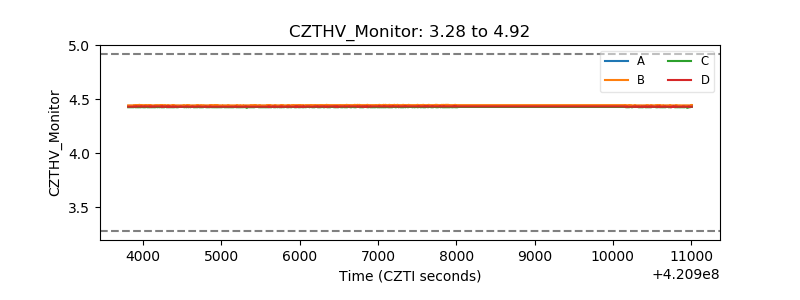 |
| D_VDD | 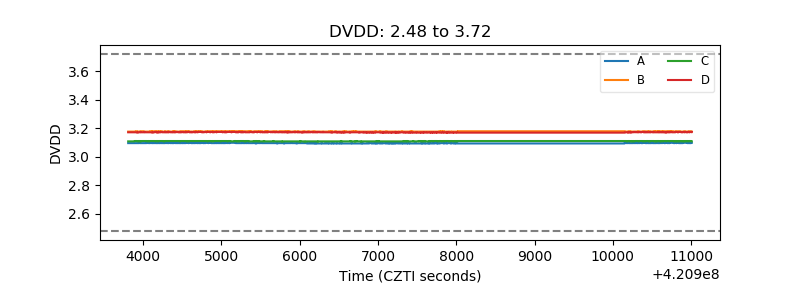 |
| Temperature 1 | 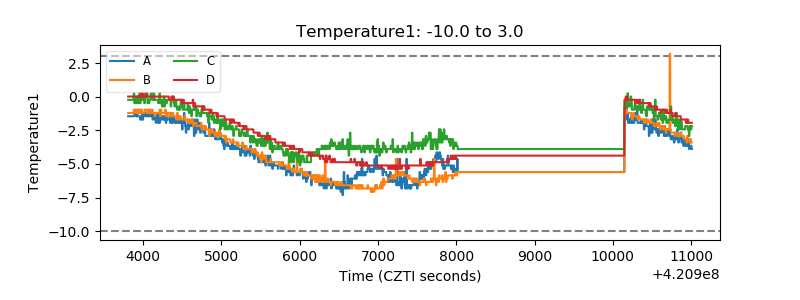 |
| Veto HV Monitor | 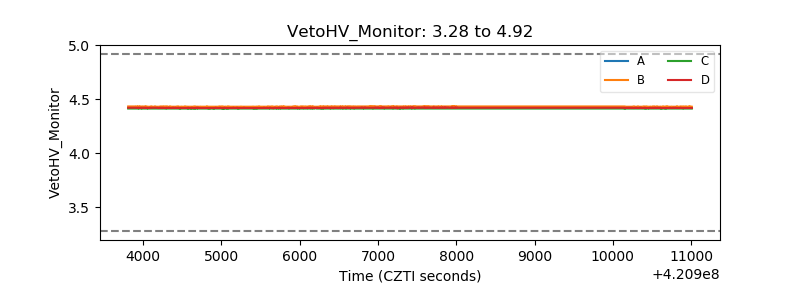 |
| Veto LLD | 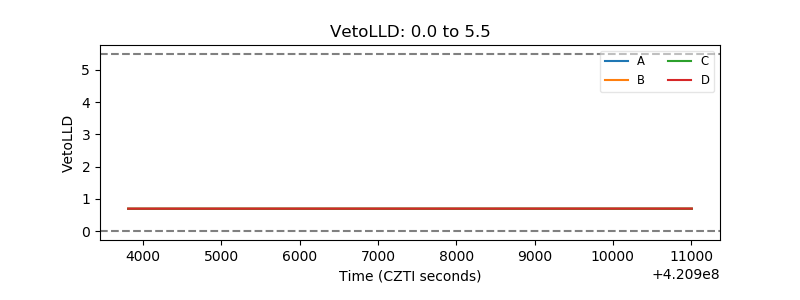 |
| Alpha Counter | 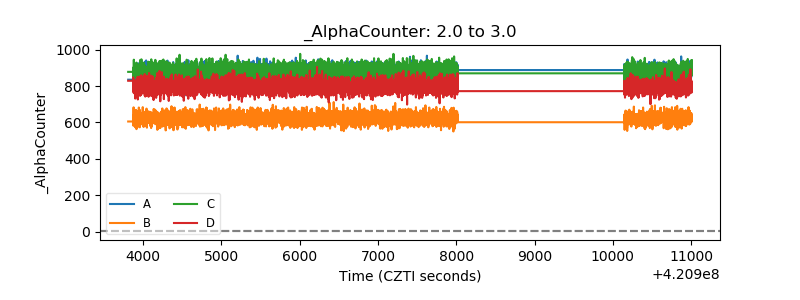 |
| _CPM_Rate | 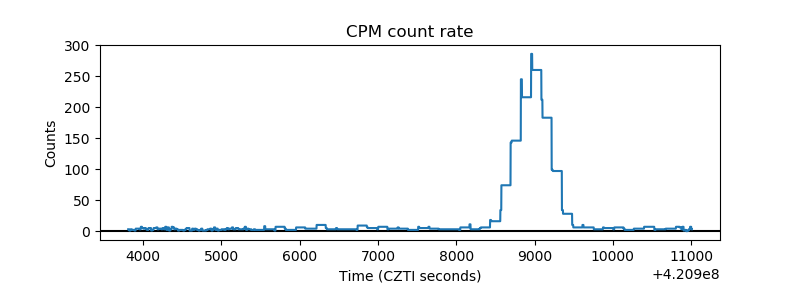 |
| CZT Counter | 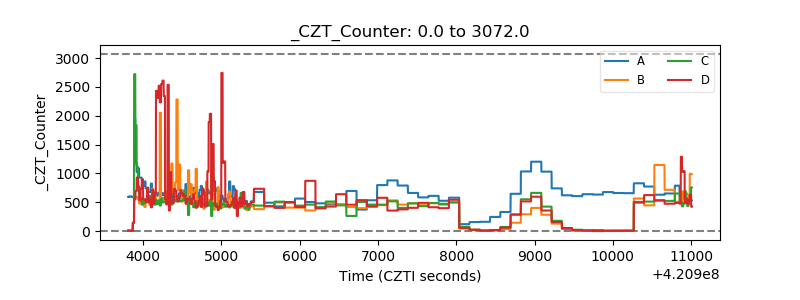 |
| +2.5 Volts monitor | 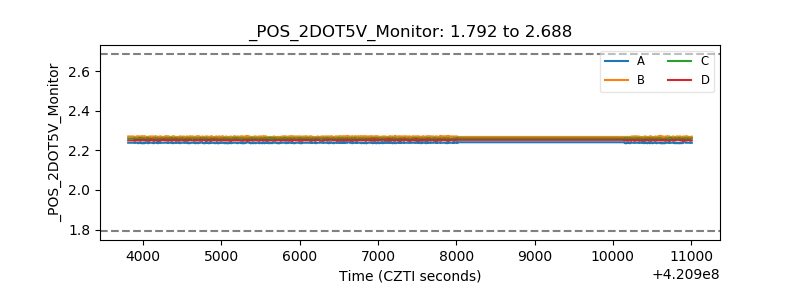 |
| +5 Volts monitor |  |
| _ROLL_ROT | 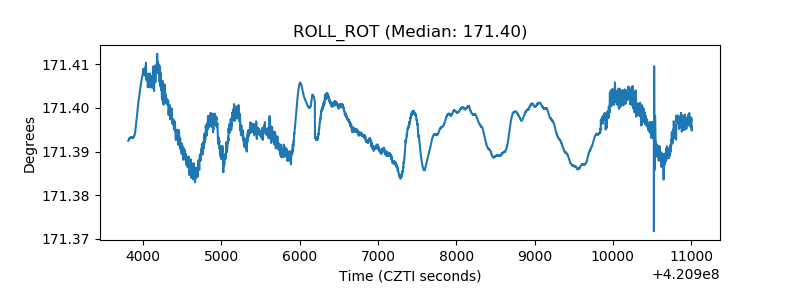 |
| _Roll_DEC | 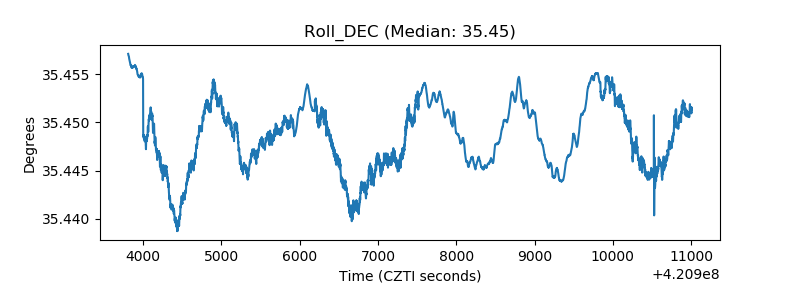 |
| _Roll_RA | 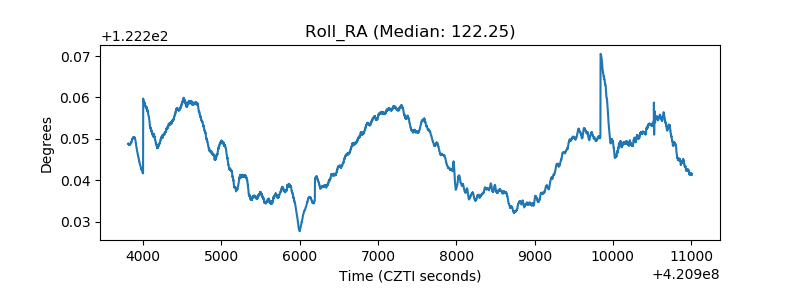 |
| Veto Counter | 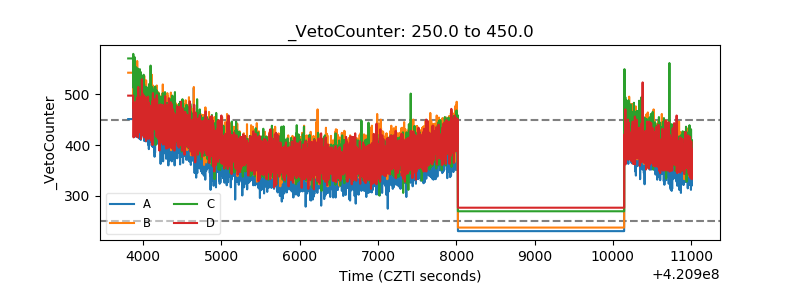 |