| Param | Original file | Final file |
|---|---|---|
| Filename | modeM0/AS1A12_095T02_9000005596_41086cztM0_level2.fits | modeM0/AS1A12_095T02_9000005596_41086cztM0_level2_quad_clean.evt |
| Size (bytes) | 341,395,200 | 85,282,560 |
| Size | 325.6 MB | 81.3 MB |
| Events in quadrant A | 3,400,775 | 576,292 |
| Events in quadrant B | 2,774,955 | 585,868 |
| Events in quadrant C | 3,266,190 | 543,441 |
| Events in quadrant D | 2,795,370 | 516,350 |
| Mode M0 | |||
|---|---|---|---|
| Quadrant | BADHDUFLAG | Total packets | Discarded packets |
| A | 0 | 13482 | 3 |
| B | 0 | 11703 | 2 |
| C | 0 | 13011 | 2 |
| D | 0 | 11866 | 2 |
| Mode SS | |||
|---|---|---|---|
| Quadrant | BADHDUFLAG | Total packets | Discarded packets |
| A | 0 | 106 | 0 |
| B | 0 | 106 | 0 |
| C | 0 | 106 | 0 |
| D | 0 | 106 | 0 |
| Mode M9 | |||
|---|---|---|---|
| Quadrant | BADHDUFLAG | Total packets | Discarded packets |
| A | 0 | 19 | 0 |
| B | 0 | 19 | 0 |
| C | 0 | 19 | 0 |
| D | 0 | 19 | 0 |
| Quadrant | Total seconds | Saturated seconds | Saturation percentage |
|---|---|---|---|
| A | 5137 | 21 | 0.408799% |
| B | 5137 | 37 | 0.720265% |
| C | 5137 | 221 | 4.302122% |
| D | 5137 | 81 | 1.576796% |
Noise dominated data is calculated using 1-second bins in cleaned event files. If a bin has >2000 counts, and if more than 50% of those come from <1% of pixels, then it is considered to be noise-dominated and hence unusable.
| Quadrant | # 1 sec bins | Bins with >0 counts | Bins with >2000 counts | High rate bins dominated by noise | Noise dominated (total time) | Noise dominated (detector-on time) | Marked lightcurve |
|---|---|---|---|---|---|---|---|
| A | 7080 | 5138 | 3 | 3 | 0.04% | 0.06% | 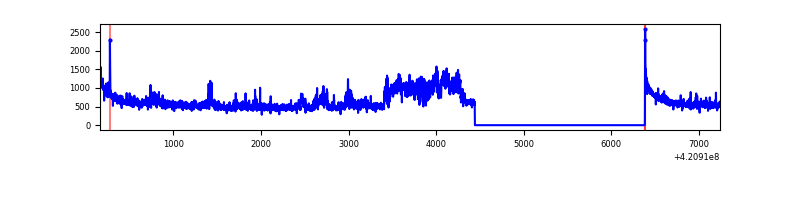 |
| B | 7080 | 5138 | 24 | 24 | 0.34% | 0.47% | 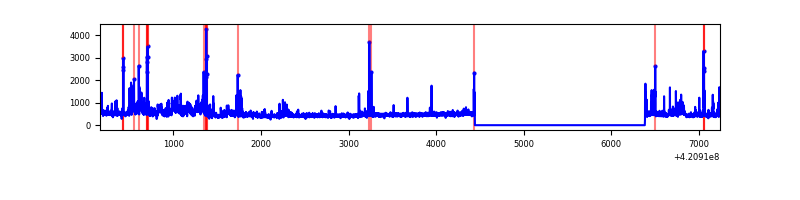 |
| C | 7080 | 5138 | 197 | 197 | 2.78% | 3.83% | 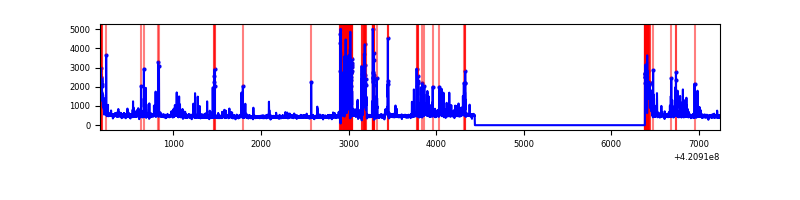 |
| D | 7080 | 5138 | 79 | 79 | 1.12% | 1.54% | 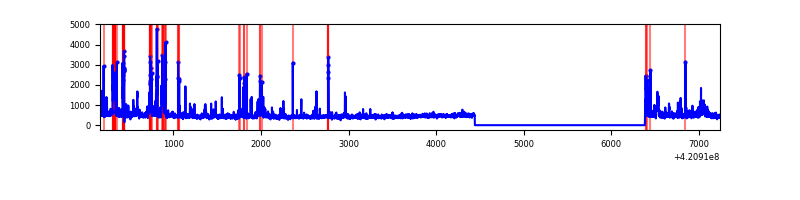 |
Top three noisy pixels from each quadrant. If the there are fewer than three noisy pixels in the level2.evt file, extra rows are filled as -1
| Pixel properties | Quadrant properties | ||||||
|---|---|---|---|---|---|---|---|
| Quadrant | DetID | PixID | Counts | Sigma | Mean | Median | Sigma |
| A | 12 | 189 | 657362 | 5692.22 | 559 | 547 | 115.4 |
| A | 10 | 83 | 530909 | 4596.32 | 559 | 547 | 115.4 |
| A | 13 | 248 | 30700 | 261.32 | 559 | 547 | 115.4 |
| B | 5 | 32 | 204561 | 1867.54 | 559 | 544 | 109.2 |
| B | 0 | 190 | 172768 | 1576.51 | 559 | 544 | 109.2 |
| B | 0 | 186 | 78834 | 716.65 | 559 | 544 | 109.2 |
| C | 14 | 254 | 753227 | 5948.5 | 541 | 545 | 126.5 |
| C | 15 | 214 | 214284 | 1689.19 | 541 | 545 | 126.5 |
| C | 0 | 10 | 179819 | 1416.81 | 541 | 545 | 126.5 |
| D | 2 | 249 | 176325 | 1313.73 | 547 | 533 | 133.8 |
| D | 13 | 249 | 137522 | 1023.75 | 547 | 533 | 133.8 |
| D | 2 | 16 | 119655 | 890.22 | 547 | 533 | 133.8 |
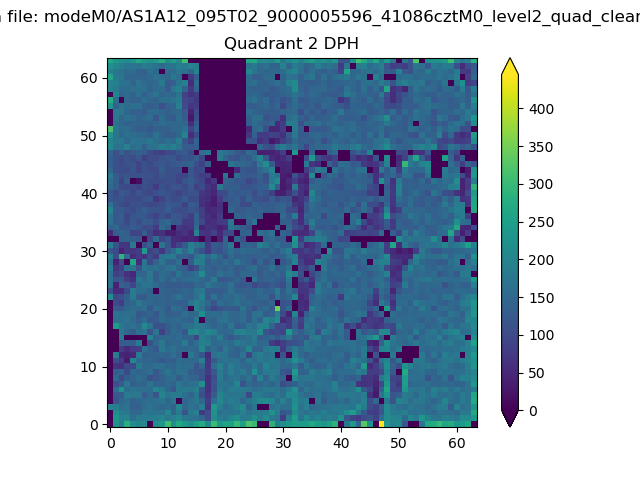
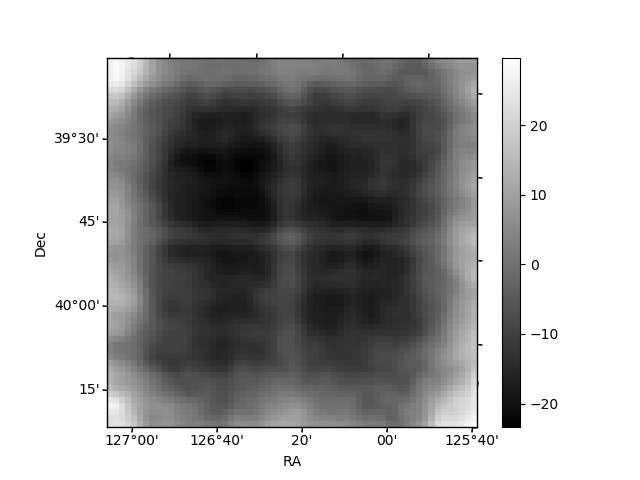
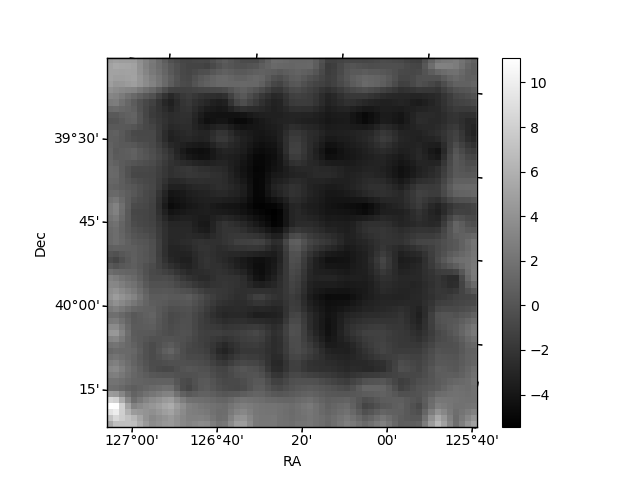
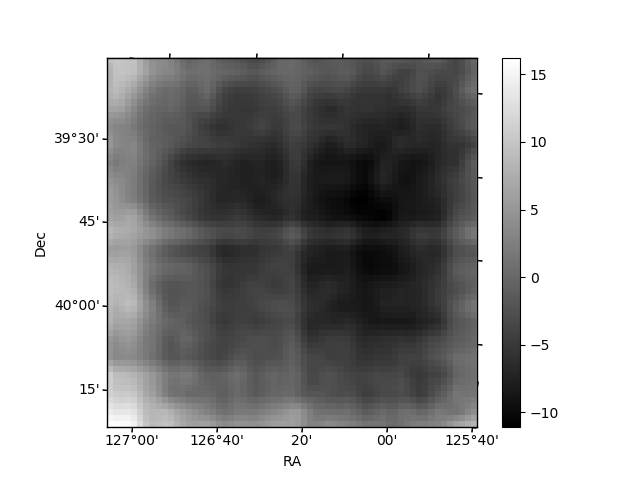
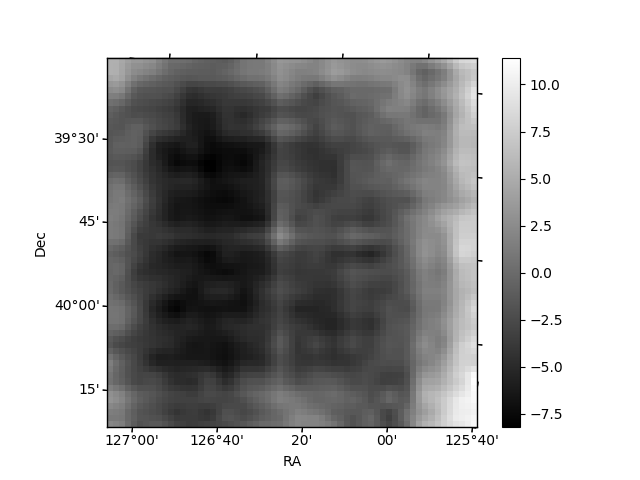
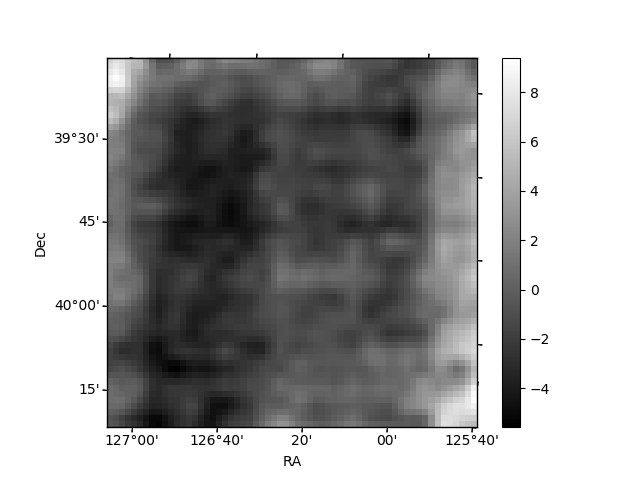
Histogram calculated using DETX and DETY for each event in the final _common_clean file
| Quadrant A | 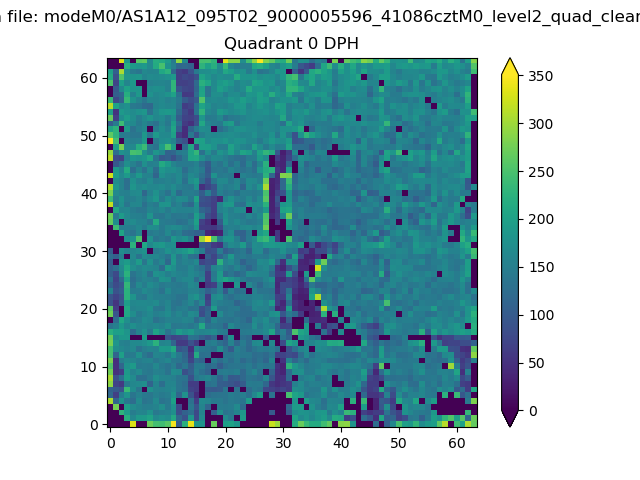 |
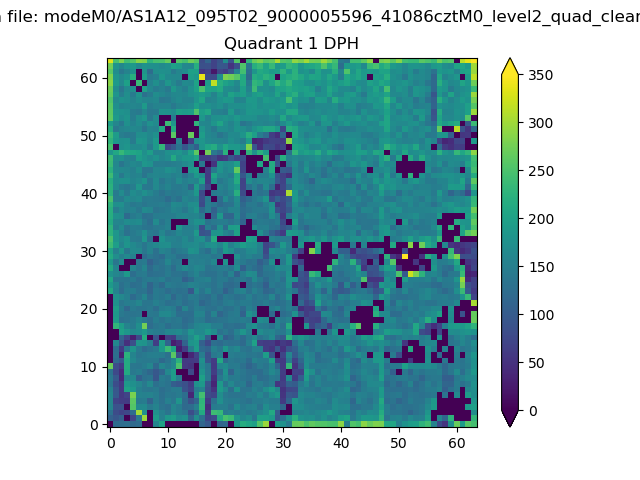 |
Quadrant B |
|---|---|---|---|
| Quadrant D | 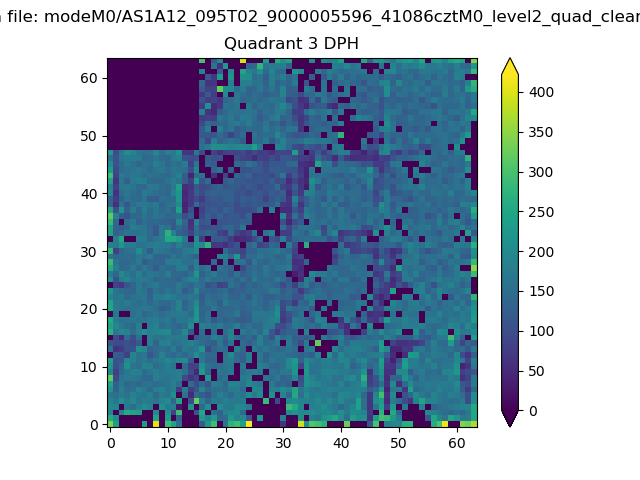 |
 |
Quadrant C |
| Plot type | Count rate plots | Images |
|---|---|---|
| Comparison with Poisson distribution Blue bars denote a histogram of data divided into 1 sec bins. Red curve is a Poisson curve with rate = median count rate of data. |
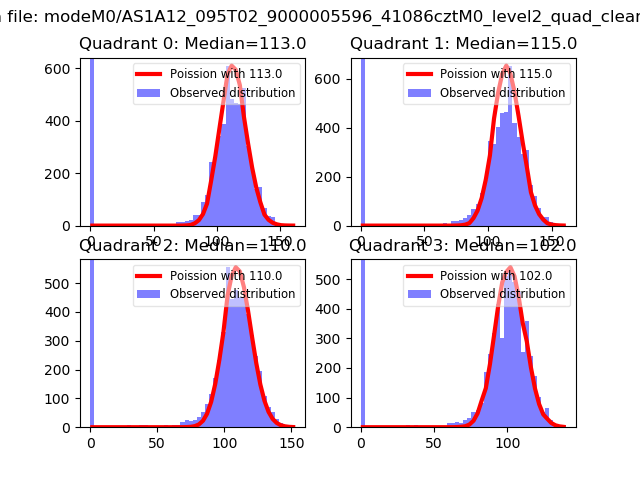 |
 |
| Quadrant-wise count rates Data is divided into 100 sec bins |
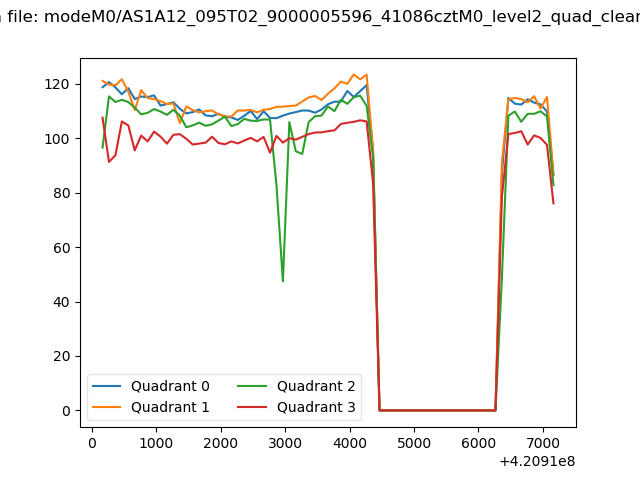 |
|
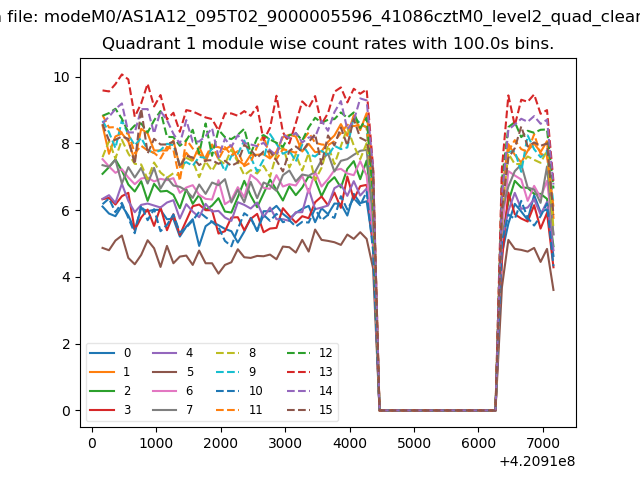
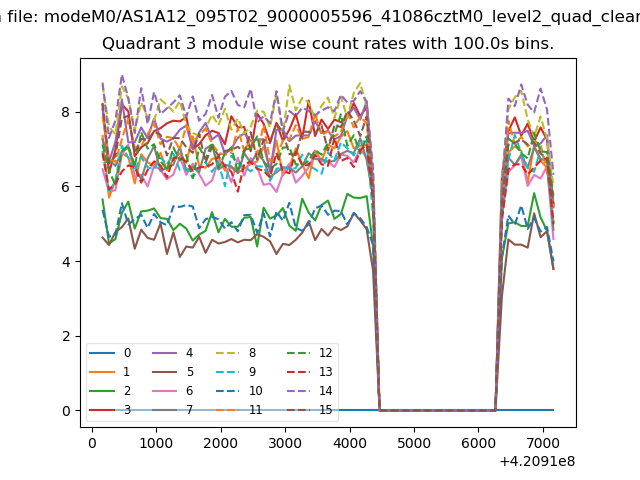
| Module-wise count rates for Quadrant A Data is divided into 100 sec bins |
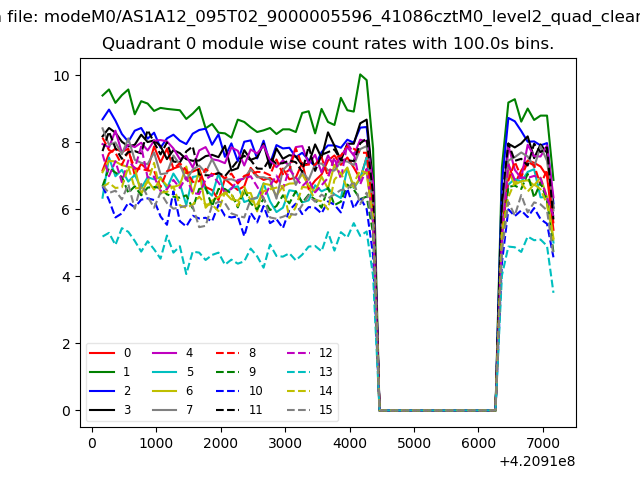 |
 |
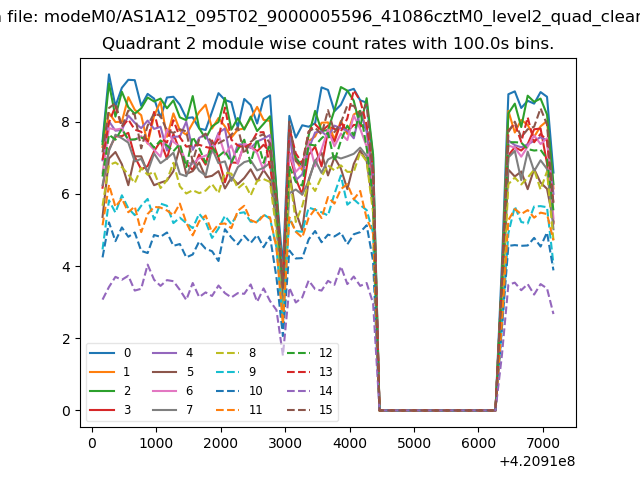
| Module-wise count rates for Quadrant B Data is divided into 100 sec bins |
 |
 |
| Module-wise count rates for Quadrant C Data is divided into 100 sec bins |
 |
 |
| Module-wise count rates for Quadrant D Data is divided into 100 sec bins |
 |
 |
| Parameter | Plot |
|---|---|
| CZT HV Monitor | 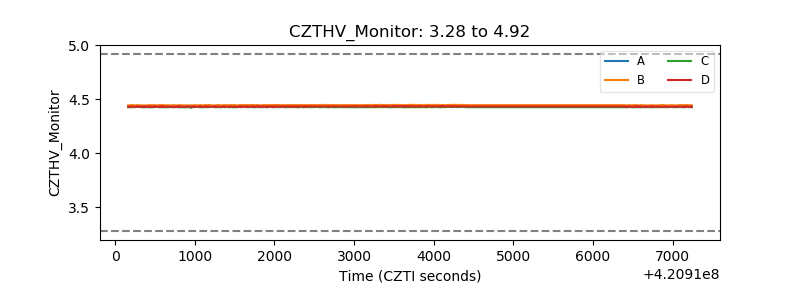 |
| D_VDD | 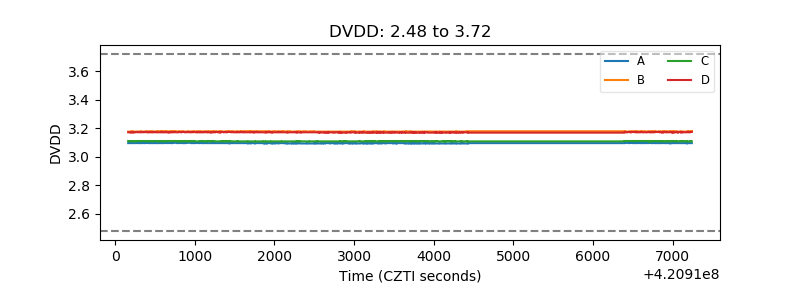 |
| Temperature 1 | 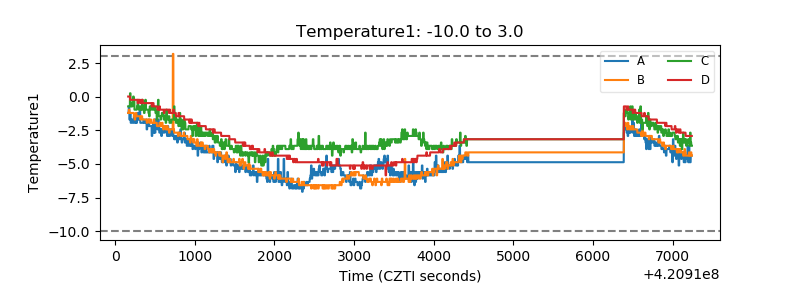 |
| Veto HV Monitor | 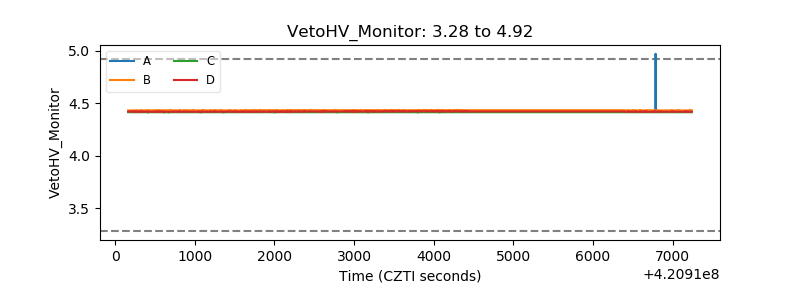 |
| Veto LLD | 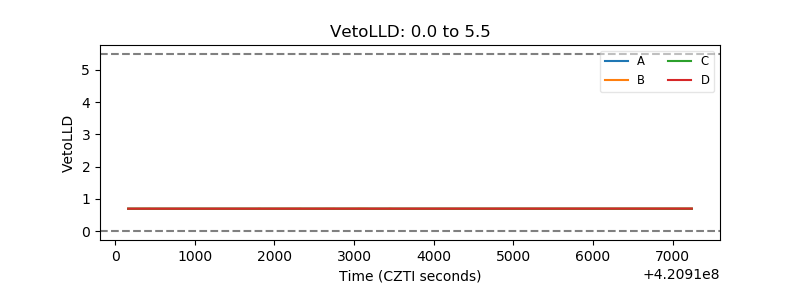 |
| Alpha Counter | 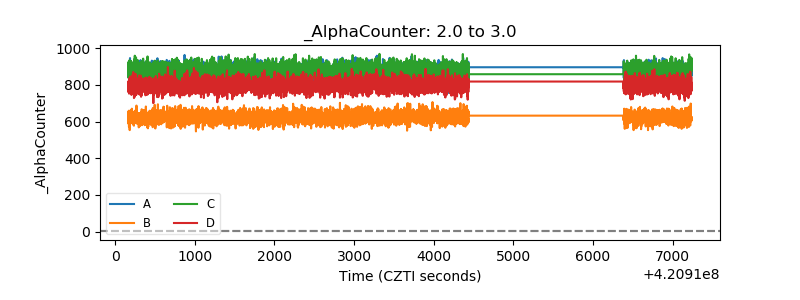 |
| _CPM_Rate | 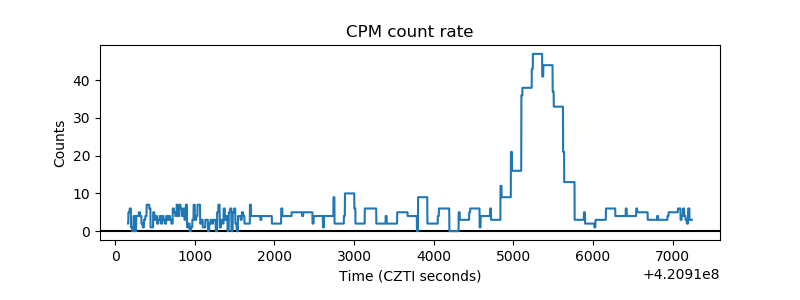 |
| CZT Counter | 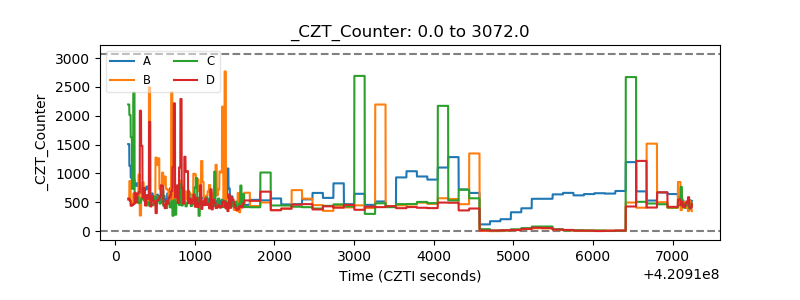 |
| +2.5 Volts monitor | 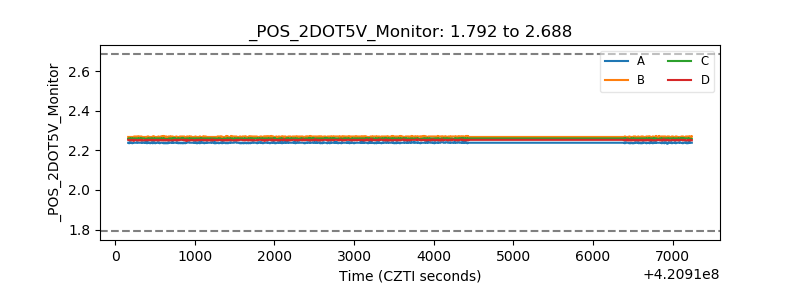 |
| +5 Volts monitor | 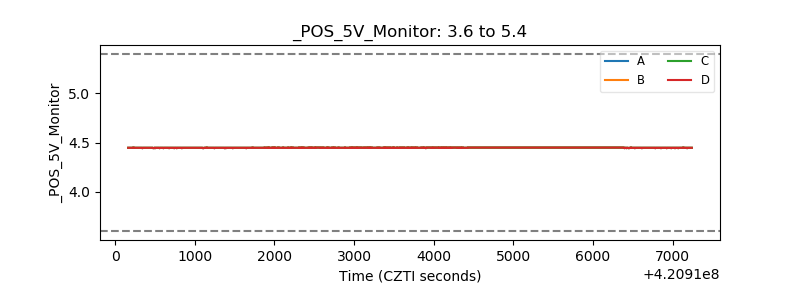 |
| _ROLL_ROT | 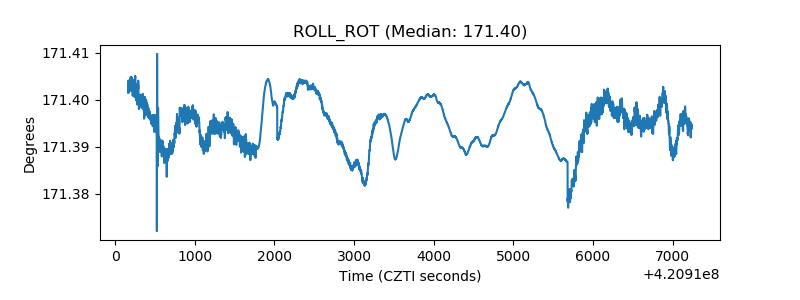 |
| _Roll_DEC | 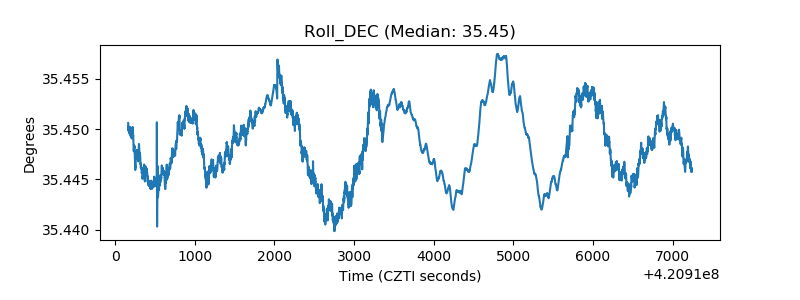 |
| _Roll_RA | 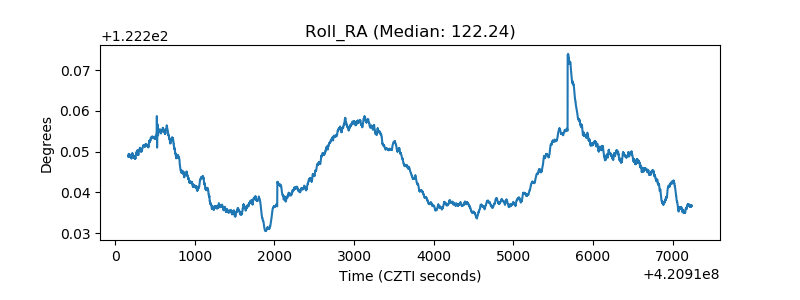 |
| Veto Counter | 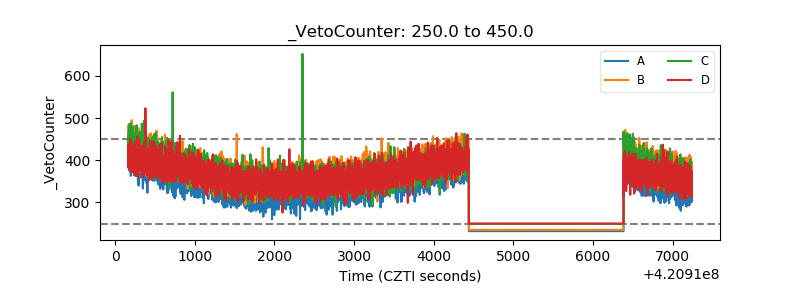 |