| Param | Original file | Final file |
|---|---|---|
| Filename | modeM0/AS1A12_095T02_9000005596_41087cztM0_level2.fits | modeM0/AS1A12_095T02_9000005596_41087cztM0_level2_quad_clean.evt |
| Size (bytes) | 334,347,840 | 89,553,600 |
| Size | 318.9 MB | 85.4 MB |
| Events in quadrant A | 3,008,176 | 604,555 |
| Events in quadrant B | 2,703,558 | 617,179 |
| Events in quadrant C | 2,876,459 | 582,688 |
| Events in quadrant D | 3,358,014 | 520,529 |
| Mode M0 | |||
|---|---|---|---|
| Quadrant | BADHDUFLAG | Total packets | Discarded packets |
| A | 0 | 12316 | 3 |
| B | 0 | 11890 | 2 |
| C | 0 | 12145 | 2 |
| D | 0 | 13916 | 2 |
| Mode SS | |||
|---|---|---|---|
| Quadrant | BADHDUFLAG | Total packets | Discarded packets |
| A | 0 | 114 | 0 |
| B | 0 | 114 | 0 |
| C | 0 | 114 | 0 |
| D | 0 | 114 | 0 |
| Mode M9 | |||
|---|---|---|---|
| Quadrant | BADHDUFLAG | Total packets | Discarded packets |
| A | 0 | 25 | 0 |
| B | 0 | 25 | 0 |
| C | 0 | 25 | 0 |
| D | 0 | 26 | 0 |
| Quadrant | Total seconds | Saturated seconds | Saturation percentage |
|---|---|---|---|
| A | 5521 | 24 | 0.434704% |
| B | 5521 | 23 | 0.416591% |
| C | 5521 | 81 | 1.467126% |
| D | 5521 | 309 | 5.596812% |
Noise dominated data is calculated using 1-second bins in cleaned event files. If a bin has >2000 counts, and if more than 50% of those come from <1% of pixels, then it is considered to be noise-dominated and hence unusable.
| Quadrant | # 1 sec bins | Bins with >0 counts | Bins with >2000 counts | High rate bins dominated by noise | Noise dominated (total time) | Noise dominated (detector-on time) | Marked lightcurve |
|---|---|---|---|---|---|---|---|
| A | 7134 | 5522 | 12 | 12 | 0.17% | 0.22% | 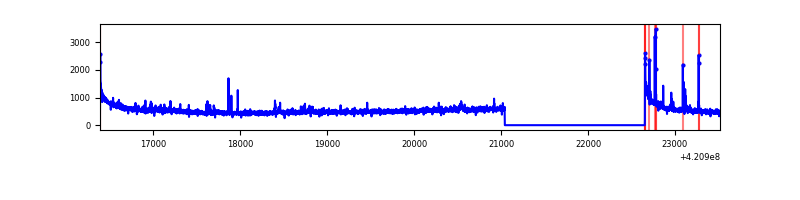 |
| B | 7134 | 5522 | 16 | 16 | 0.22% | 0.29% | 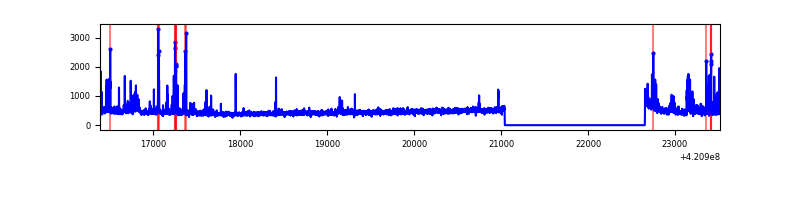 |
| C | 7134 | 5522 | 80 | 80 | 1.12% | 1.45% | 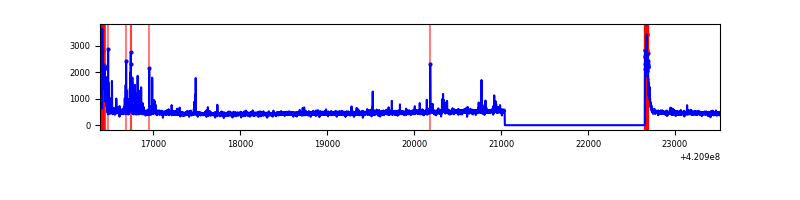 |
| D | 7134 | 5522 | 242 | 242 | 3.39% | 4.38% | 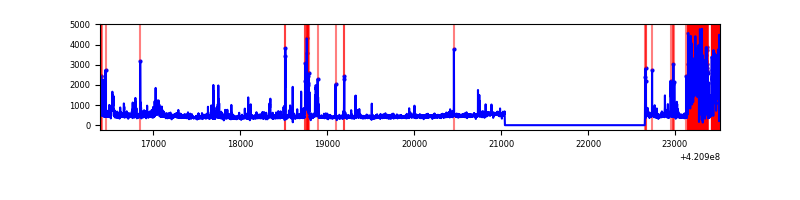 |
Top three noisy pixels from each quadrant. If the there are fewer than three noisy pixels in the level2.evt file, extra rows are filled as -1
| Pixel properties | Quadrant properties | ||||||
|---|---|---|---|---|---|---|---|
| Quadrant | DetID | PixID | Counts | Sigma | Mean | Median | Sigma |
| A | 10 | 83 | 551783 | 4423.87 | 602 | 588 | 124.6 |
| A | 12 | 189 | 47412 | 375.81 | 602 | 588 | 124.6 |
| A | 13 | 248 | 43237 | 342.3 | 602 | 588 | 124.6 |
| B | 5 | 255 | 141527 | 1205.15 | 600 | 584 | 117.0 |
| B | 0 | 190 | 66251 | 561.49 | 600 | 584 | 117.0 |
| B | 5 | 32 | 51253 | 433.25 | 600 | 584 | 117.0 |
| C | 15 | 214 | 233245 | 1700.24 | 586 | 589 | 136.8 |
| C | 0 | 10 | 220985 | 1610.65 | 586 | 589 | 136.8 |
| C | 14 | 254 | 123605 | 899.0 | 586 | 589 | 136.8 |
| D | 2 | 249 | 729998 | 5138.7 | 574 | 558 | 142.0 |
| D | 13 | 249 | 120673 | 846.18 | 574 | 558 | 142.0 |
| D | 5 | 32 | 106365 | 745.38 | 574 | 558 | 142.0 |
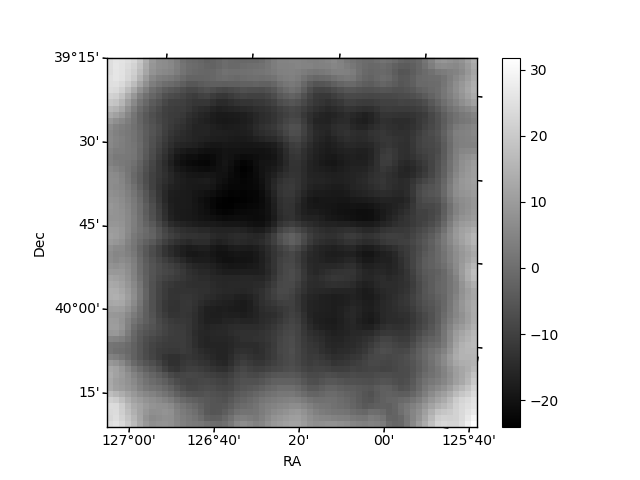
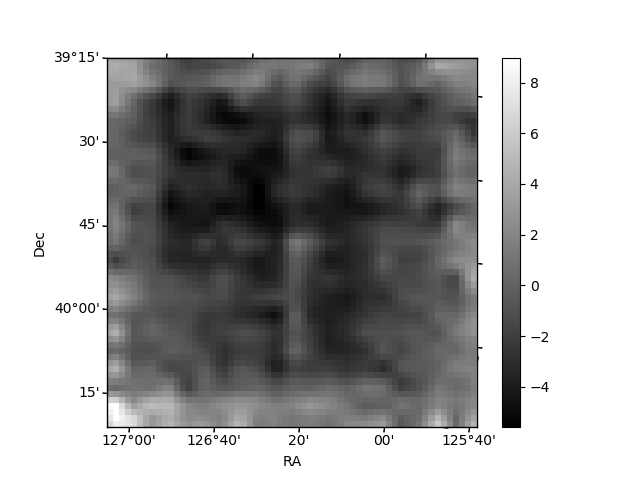
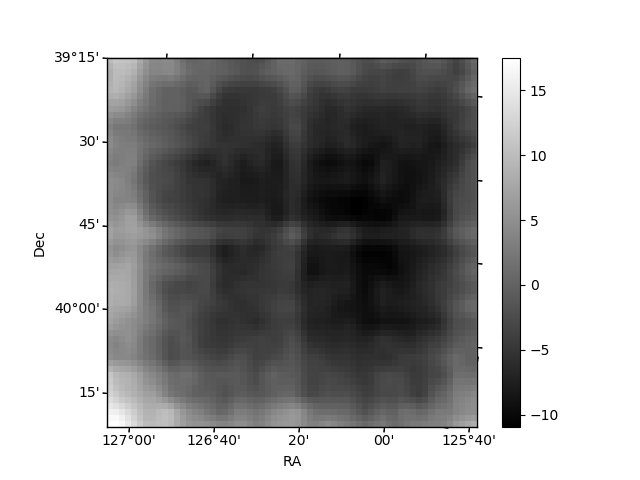
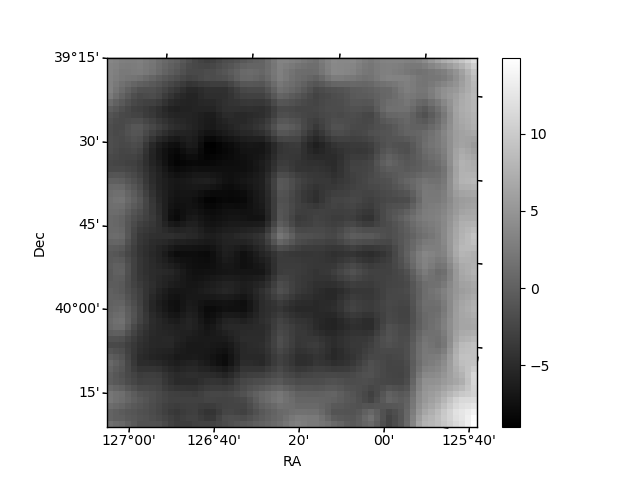
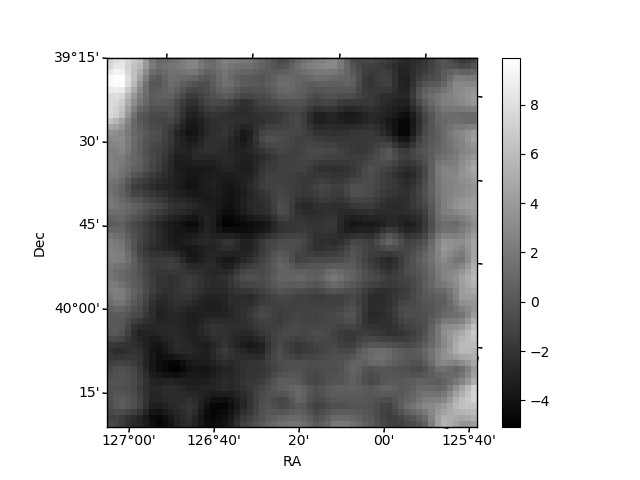
Histogram calculated using DETX and DETY for each event in the final _common_clean file
| Quadrant A | 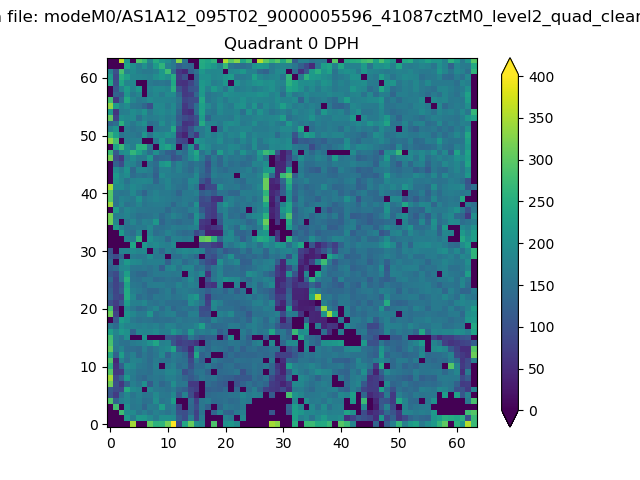 |
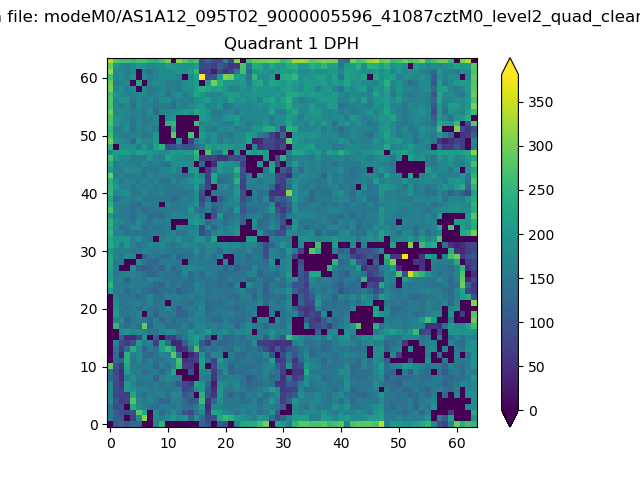 |
Quadrant B |
|---|---|---|---|
| Quadrant D | 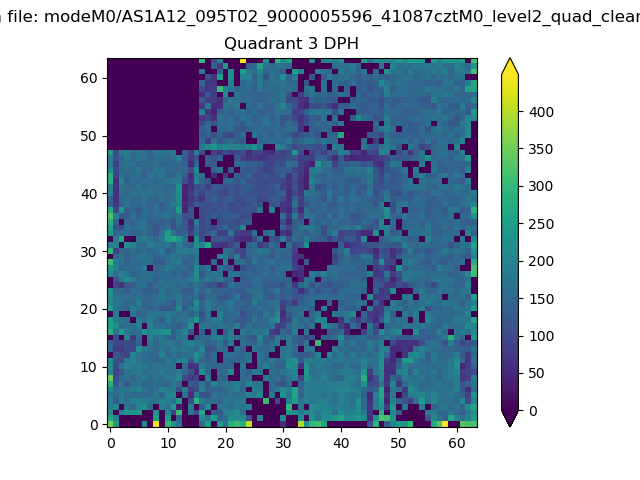 |
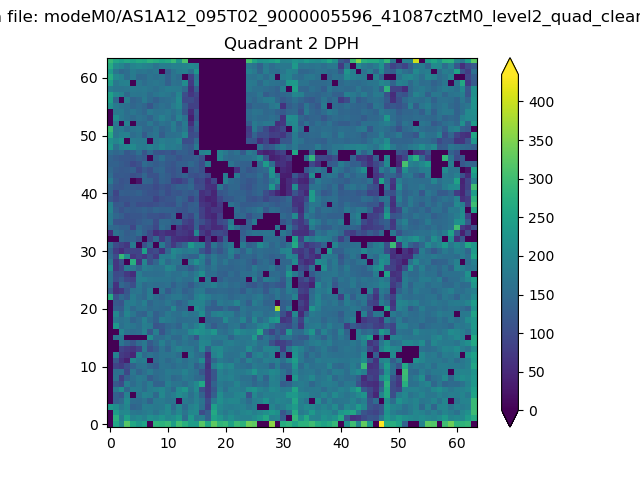 |
Quadrant C |
| Plot type | Count rate plots | Images |
|---|---|---|
| Comparison with Poisson distribution Blue bars denote a histogram of data divided into 1 sec bins. Red curve is a Poisson curve with rate = median count rate of data. |
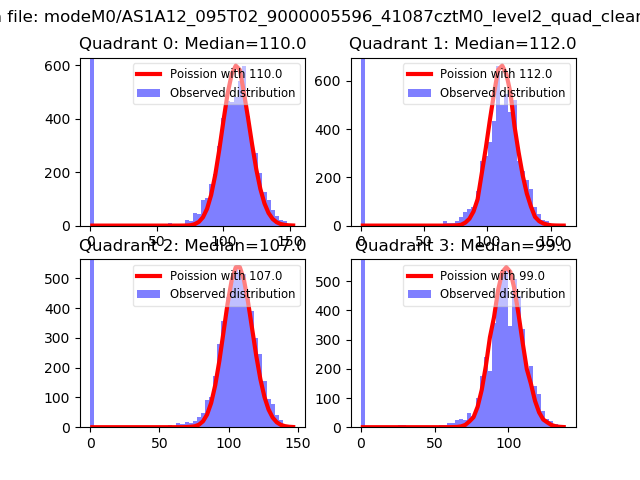 |
 |
| Quadrant-wise count rates Data is divided into 100 sec bins |
 |
|
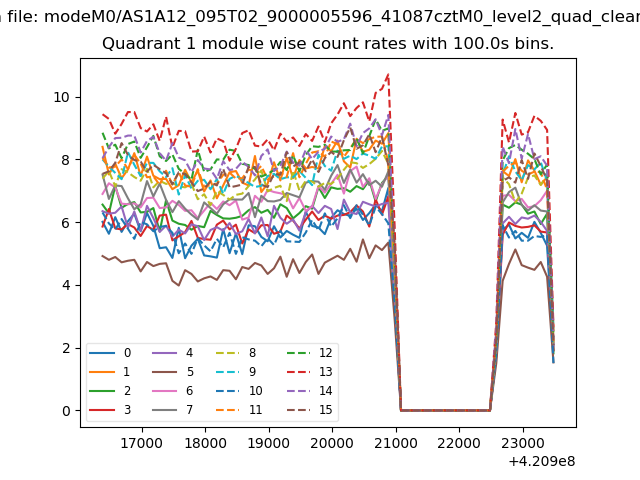
| Module-wise count rates for Quadrant A Data is divided into 100 sec bins |
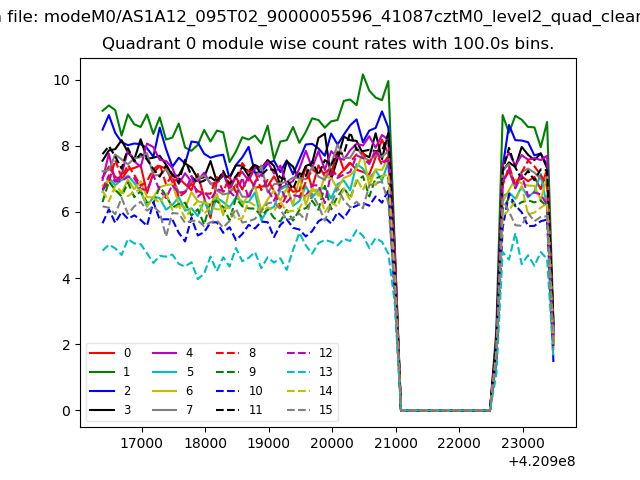 |
 |
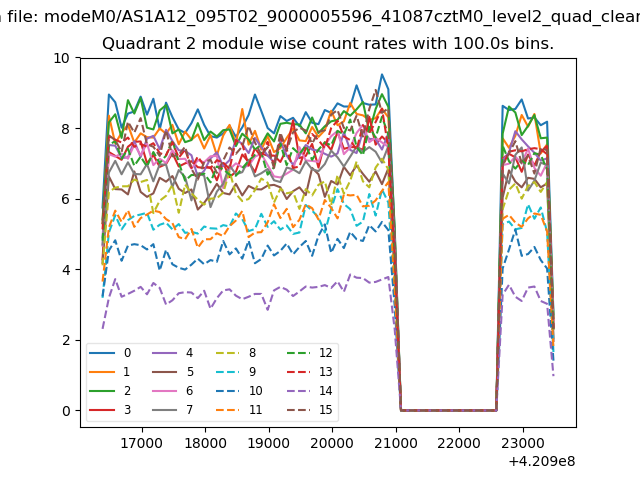
| Module-wise count rates for Quadrant B Data is divided into 100 sec bins |
 |
 |
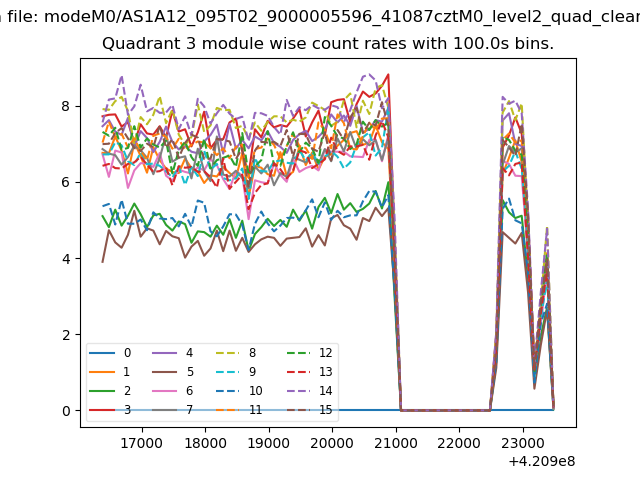
| Module-wise count rates for Quadrant C Data is divided into 100 sec bins |
 |
 |
| Module-wise count rates for Quadrant D Data is divided into 100 sec bins |
 |
 |
| Parameter | Plot |
|---|---|
| CZT HV Monitor | 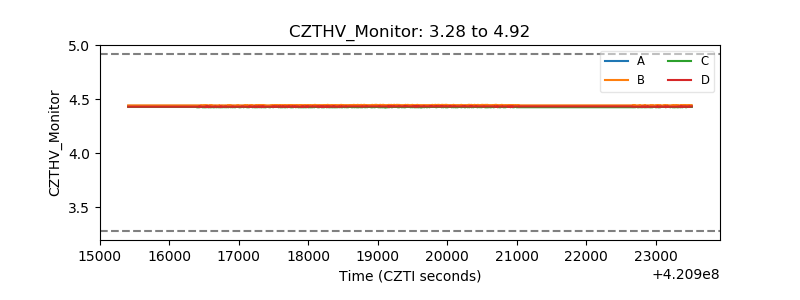 |
| D_VDD |  |
| Temperature 1 | 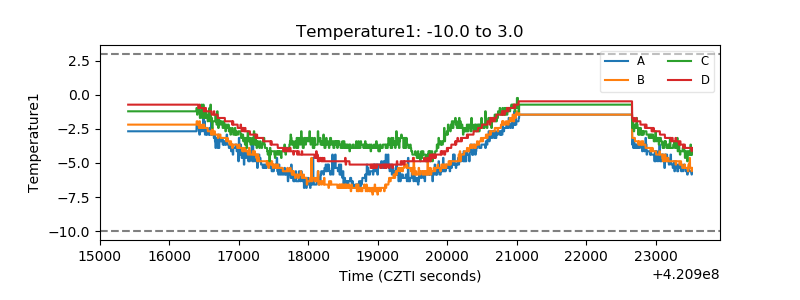 |
| Veto HV Monitor | 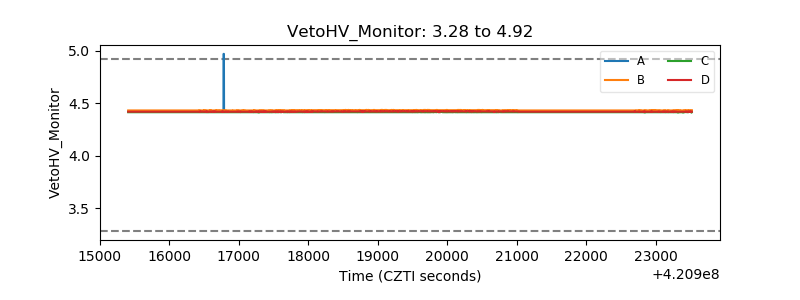 |
| Veto LLD | 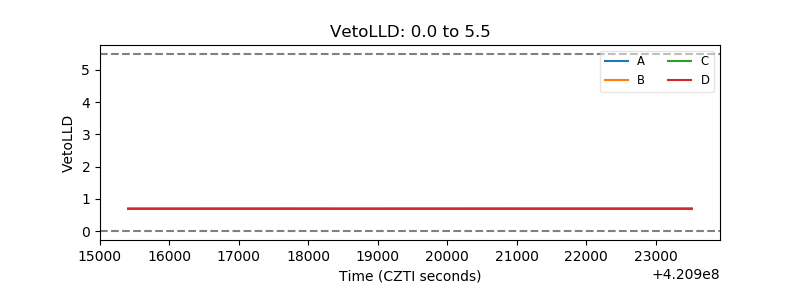 |
| Alpha Counter | 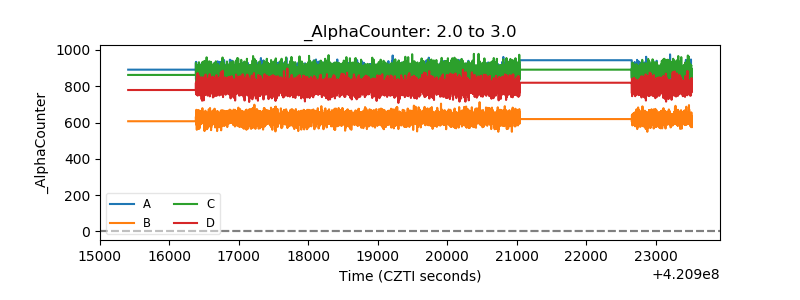 |
| _CPM_Rate | 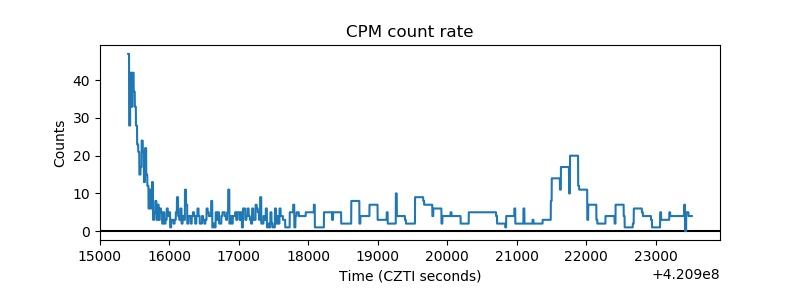 |
| CZT Counter | 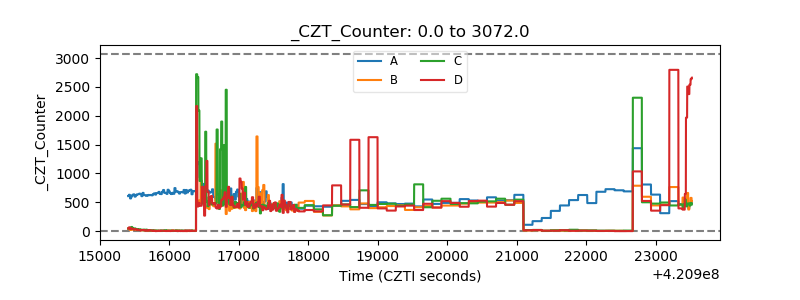 |
| +2.5 Volts monitor |  |
| +5 Volts monitor |  |
| _ROLL_ROT |  |
| _Roll_DEC | 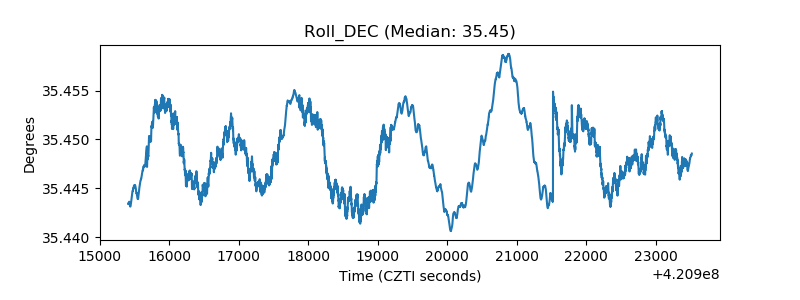 |
| _Roll_RA | 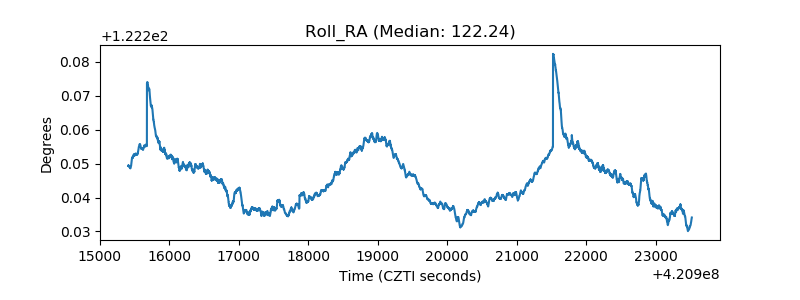 |
| Veto Counter | 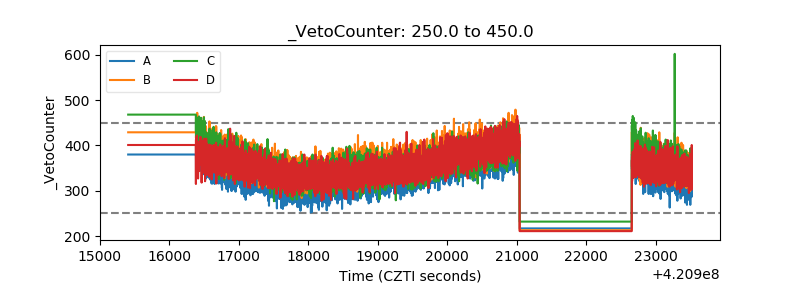 |