| Param | Original file | Final file |
|---|---|---|
| Filename | modeM0/AS1A12_095T02_9000005596_41088cztM0_level2.fits | modeM0/AS1A12_095T02_9000005596_41088cztM0_level2_quad_clean.evt |
| Size (bytes) | 376,309,440 | 92,269,440 |
| Size | 358.9 MB | 88.0 MB |
| Events in quadrant A | 3,117,979 | 628,435 |
| Events in quadrant B | 3,030,706 | 639,153 |
| Events in quadrant C | 2,918,639 | 611,943 |
| Events in quadrant D | 4,410,835 | 508,926 |
| Mode M0 | |||
|---|---|---|---|
| Quadrant | BADHDUFLAG | Total packets | Discarded packets |
| A | 0 | 12762 | 3 |
| B | 0 | 13008 | 2 |
| C | 0 | 12408 | 2 |
| D | 0 | 17158 | 2 |
| Mode SS | |||
|---|---|---|---|
| Quadrant | BADHDUFLAG | Total packets | Discarded packets |
| A | 0 | 118 | 0 |
| B | 0 | 118 | 0 |
| C | 0 | 118 | 0 |
| D | 0 | 118 | 0 |
| Mode M9 | |||
|---|---|---|---|
| Quadrant | BADHDUFLAG | Total packets | Discarded packets |
| A | 0 | 23 | 0 |
| B | 0 | 23 | 0 |
| C | 0 | 23 | 0 |
| D | 0 | 24 | 0 |
| Quadrant | Total seconds | Saturated seconds | Saturation percentage |
|---|---|---|---|
| A | 5799 | 25 | 0.431109% |
| B | 5799 | 70 | 1.207105% |
| C | 5799 | 66 | 1.138127% |
| D | 5799 | 665 | 11.467494% |
Noise dominated data is calculated using 1-second bins in cleaned event files. If a bin has >2000 counts, and if more than 50% of those come from <1% of pixels, then it is considered to be noise-dominated and hence unusable.
| Quadrant | # 1 sec bins | Bins with >0 counts | Bins with >2000 counts | High rate bins dominated by noise | Noise dominated (total time) | Noise dominated (detector-on time) | Marked lightcurve |
|---|---|---|---|---|---|---|---|
| A | 7171 | 5800 | 13 | 13 | 0.18% | 0.22% | 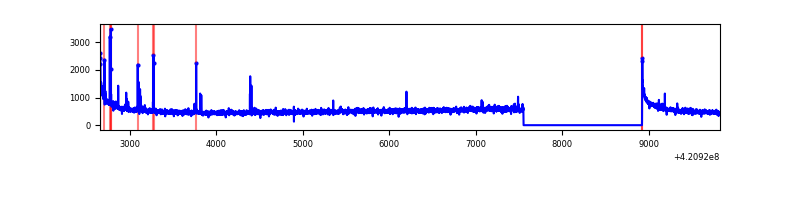 |
| B | 7171 | 5800 | 41 | 41 | 0.57% | 0.71% | 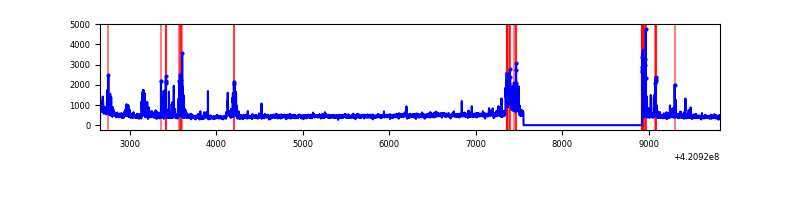 |
| C | 7171 | 5800 | 58 | 58 | 0.81% | 1.00% | 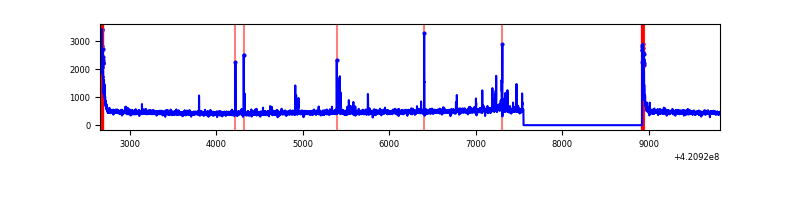 |
| D | 7171 | 5800 | 552 | 552 | 7.70% | 9.52% | 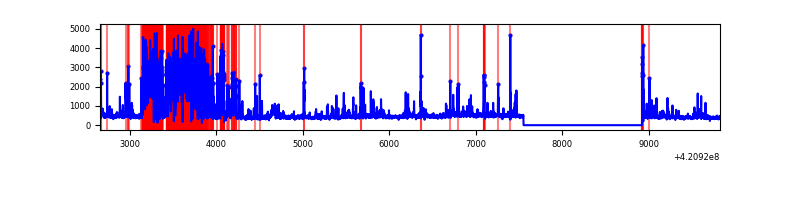 |
Top three noisy pixels from each quadrant. If the there are fewer than three noisy pixels in the level2.evt file, extra rows are filled as -1
| Pixel properties | Quadrant properties | ||||||
|---|---|---|---|---|---|---|---|
| Quadrant | DetID | PixID | Counts | Sigma | Mean | Median | Sigma |
| A | 10 | 83 | 558771 | 4241.86 | 635 | 622 | 131.6 |
| A | 13 | 248 | 44108 | 330.48 | 635 | 622 | 131.6 |
| A | 7 | 3 | 25193 | 186.73 | 635 | 622 | 131.6 |
| B | 5 | 255 | 141767 | 1137.78 | 630 | 613 | 124.1 |
| B | 0 | 190 | 134695 | 1080.78 | 630 | 613 | 124.1 |
| B | 0 | 186 | 119838 | 961.02 | 630 | 613 | 124.1 |
| C | 15 | 214 | 246912 | 1691.55 | 620 | 626 | 145.6 |
| C | 0 | 10 | 162493 | 1111.74 | 620 | 626 | 145.6 |
| C | 14 | 254 | 90991 | 620.65 | 620 | 626 | 145.6 |
| D | 2 | 249 | 1890183 | 12998.79 | 585 | 568 | 145.4 |
| D | 13 | 249 | 116239 | 795.71 | 585 | 568 | 145.4 |
| D | 2 | 153 | 35094 | 237.51 | 585 | 568 | 145.4 |
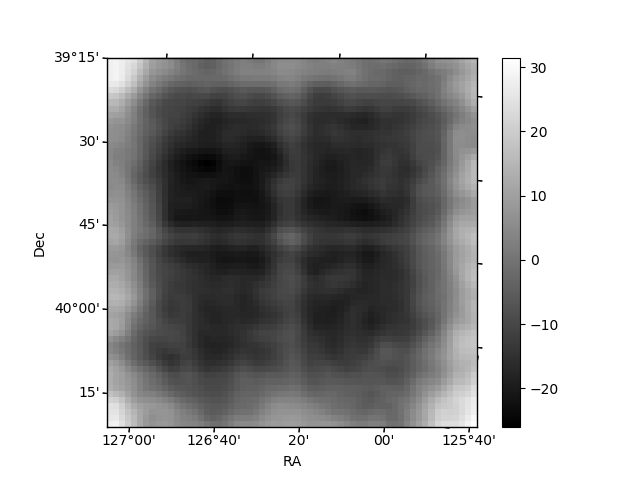
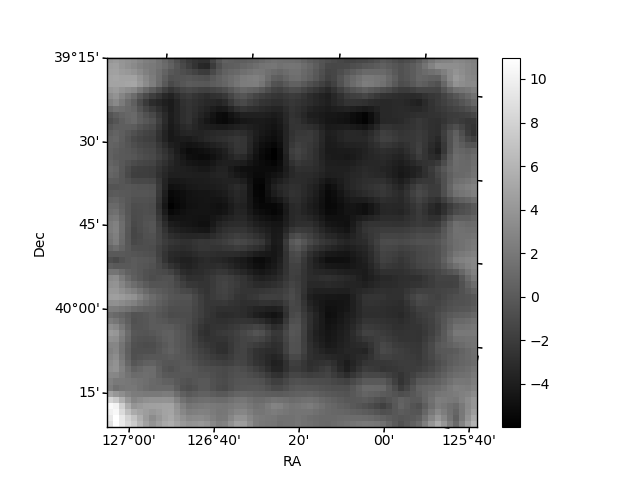
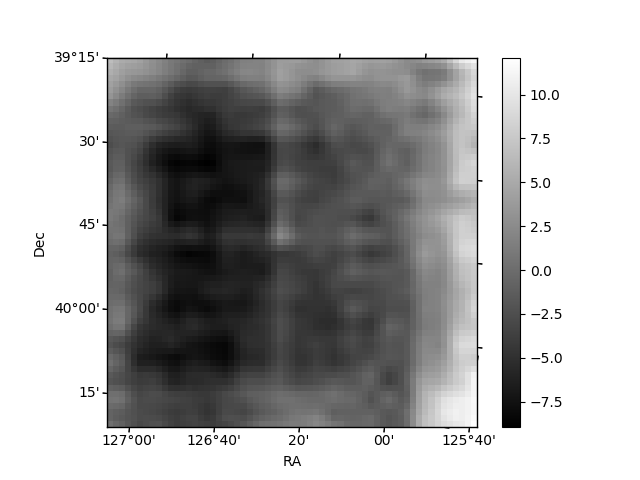
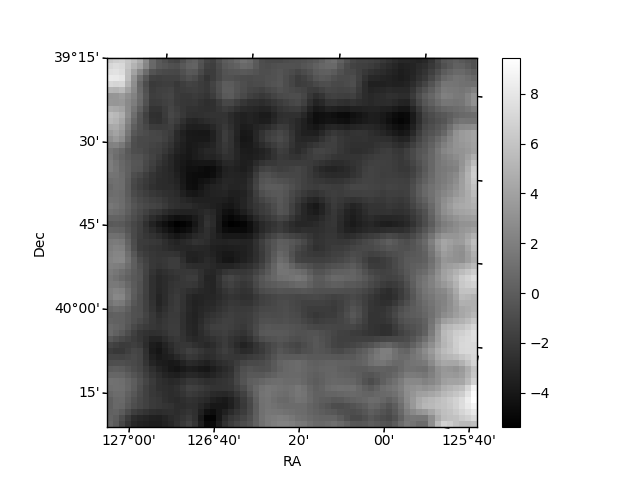
Histogram calculated using DETX and DETY for each event in the final _common_clean file
| Quadrant A | 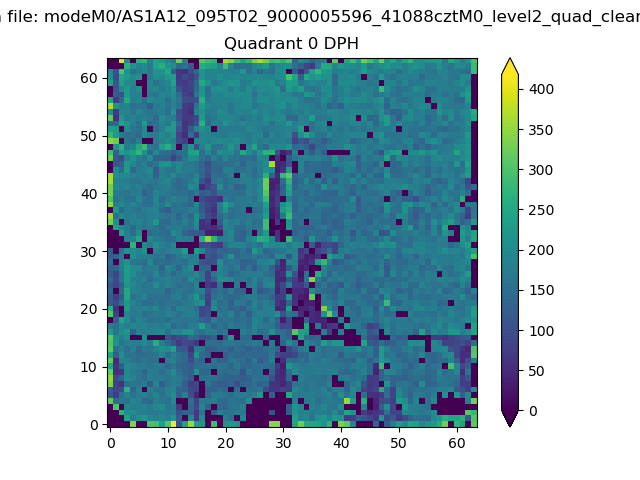 |
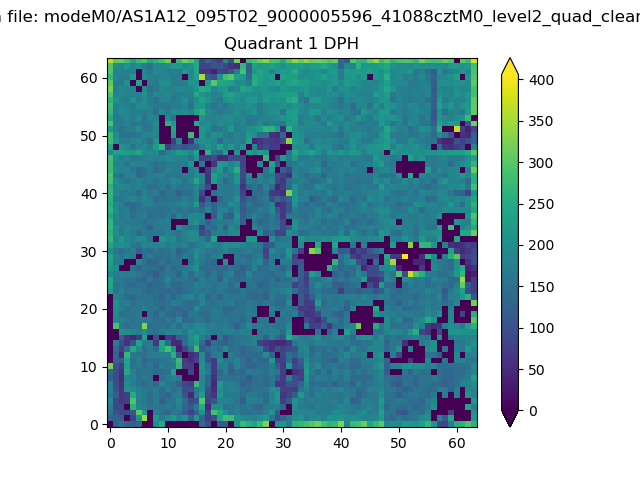 |
Quadrant B |
|---|---|---|---|
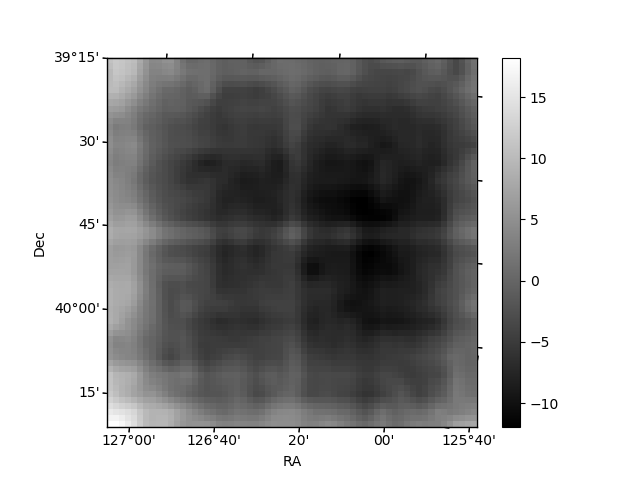
| Quadrant D | 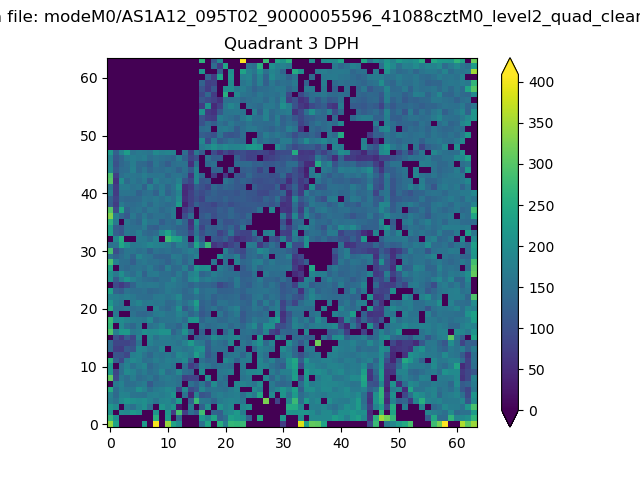 |
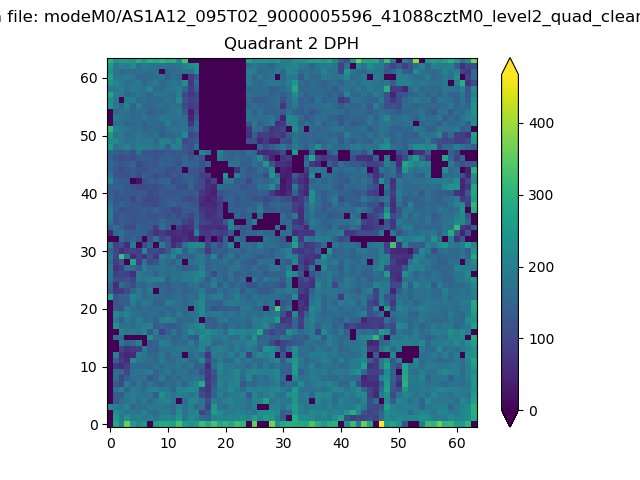 |
Quadrant C |
| Plot type | Count rate plots | Images |
|---|---|---|
| Comparison with Poisson distribution Blue bars denote a histogram of data divided into 1 sec bins. Red curve is a Poisson curve with rate = median count rate of data. |
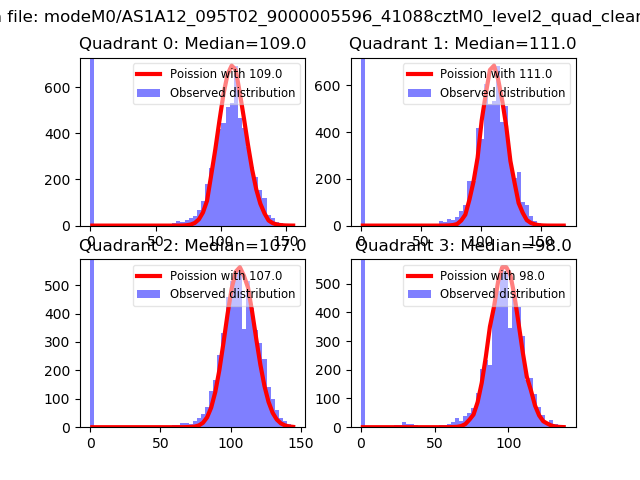 |
 |
| Quadrant-wise count rates Data is divided into 100 sec bins |
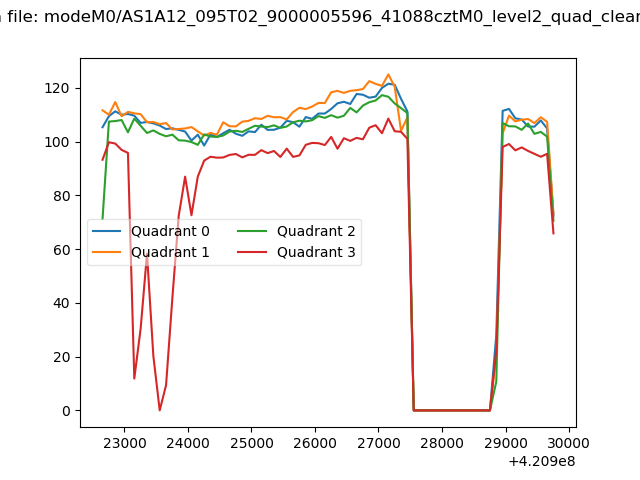 |
|
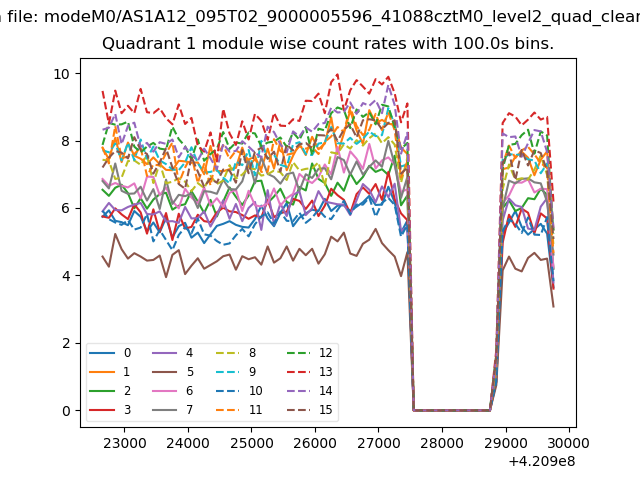
| Module-wise count rates for Quadrant A Data is divided into 100 sec bins |
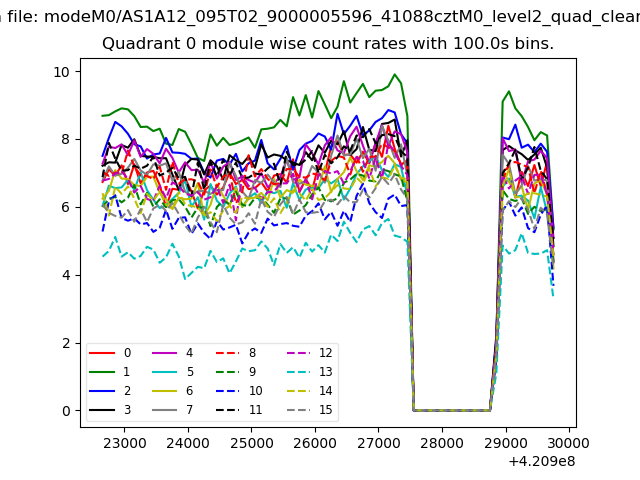 |
 |
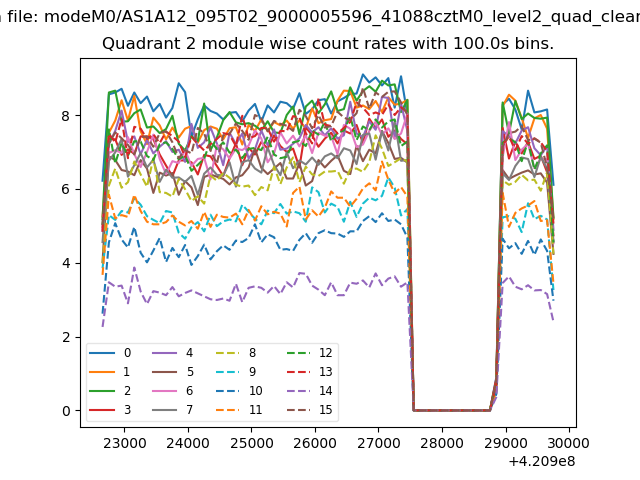
| Module-wise count rates for Quadrant B Data is divided into 100 sec bins |
 |
 |
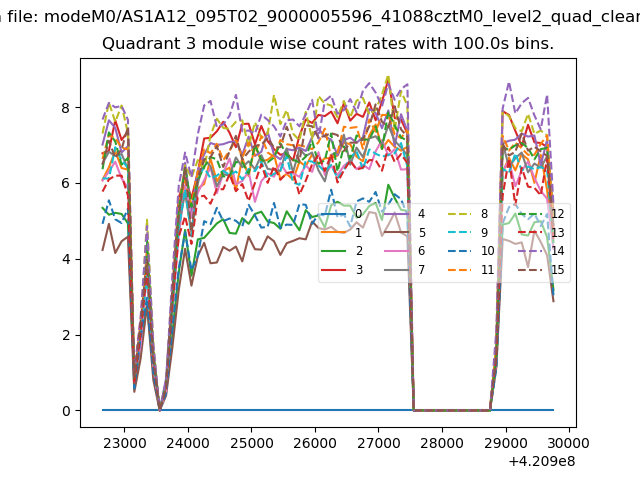
| Module-wise count rates for Quadrant C Data is divided into 100 sec bins |
 |
 |
| Module-wise count rates for Quadrant D Data is divided into 100 sec bins |
 |
 |
| Parameter | Plot |
|---|---|
| CZT HV Monitor | 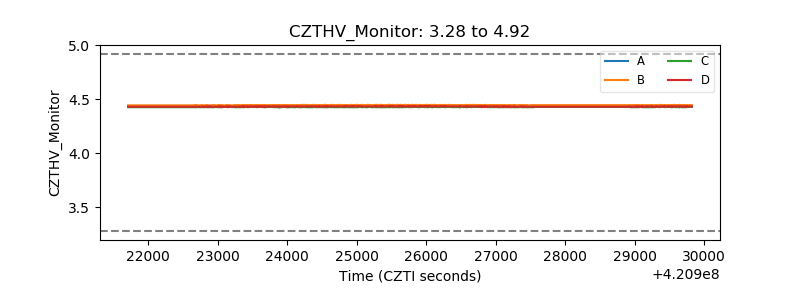 |
| D_VDD | 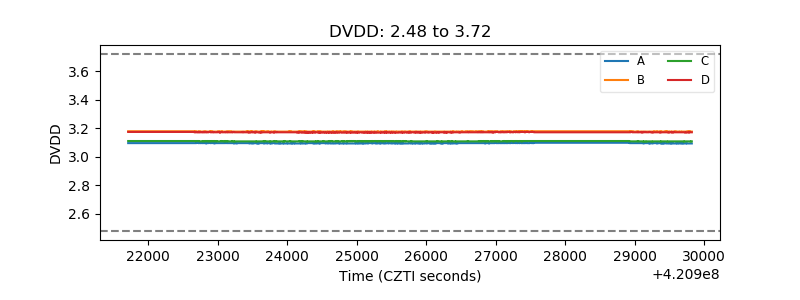 |
| Temperature 1 | 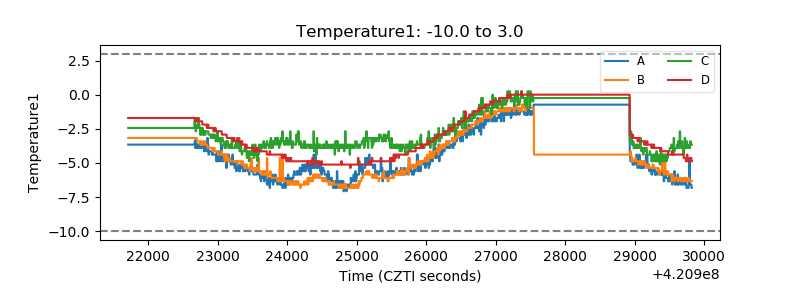 |
| Veto HV Monitor | 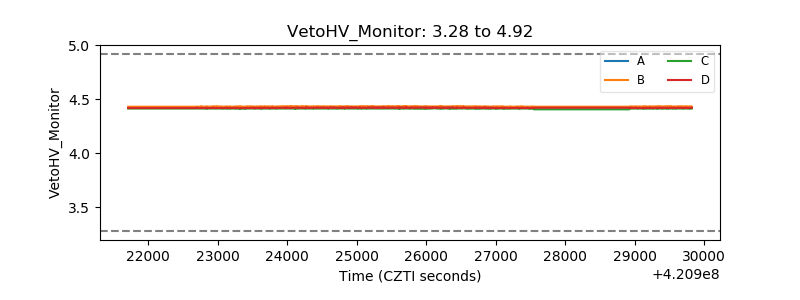 |
| Veto LLD | 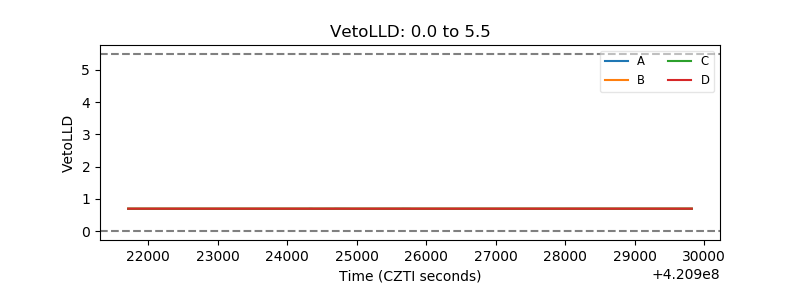 |
| Alpha Counter | 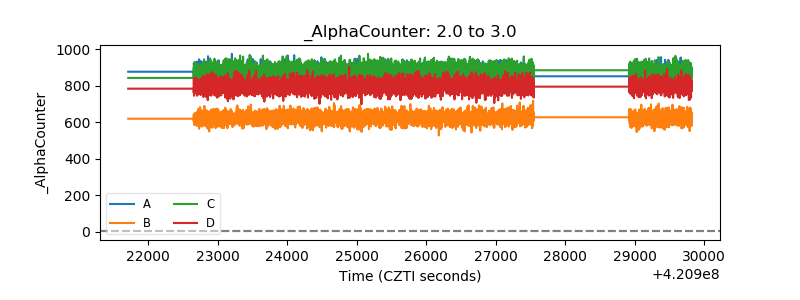 |
| _CPM_Rate | 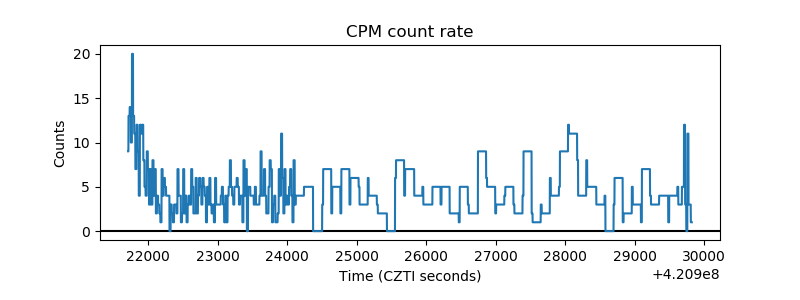 |
| CZT Counter | 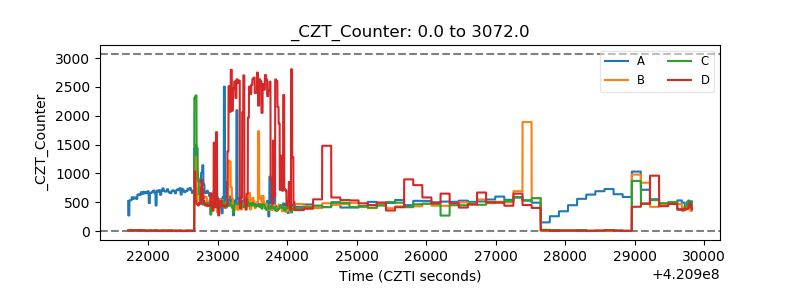 |
| +2.5 Volts monitor | 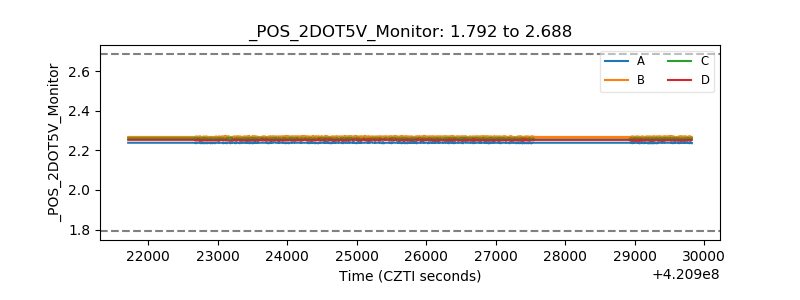 |
| +5 Volts monitor | 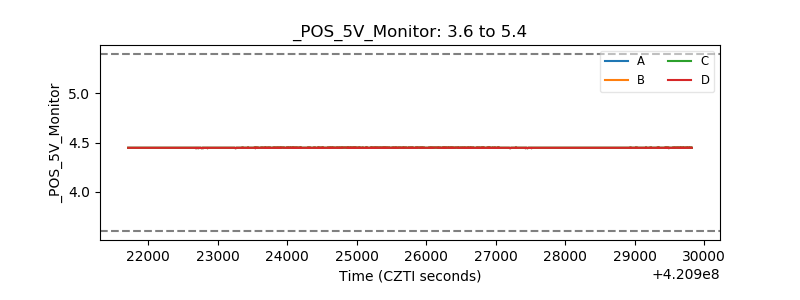 |
| _ROLL_ROT | 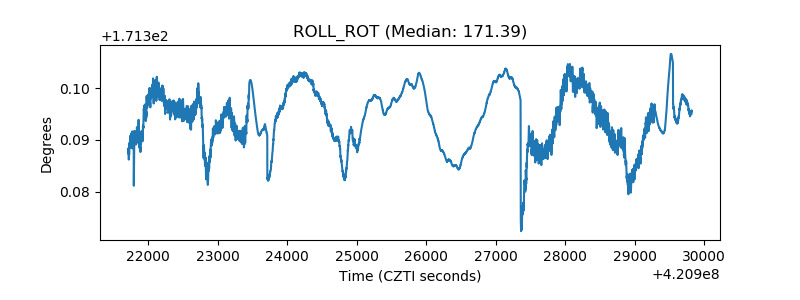 |
| _Roll_DEC | 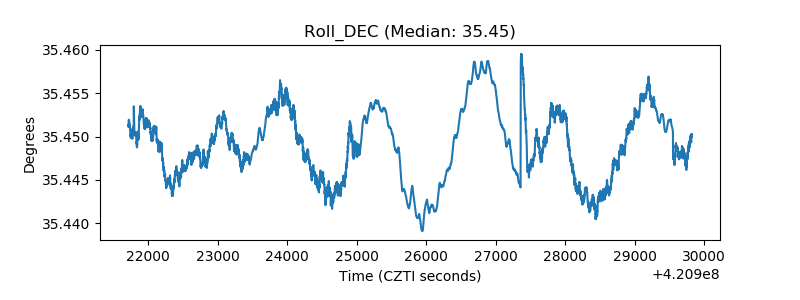 |
| _Roll_RA | 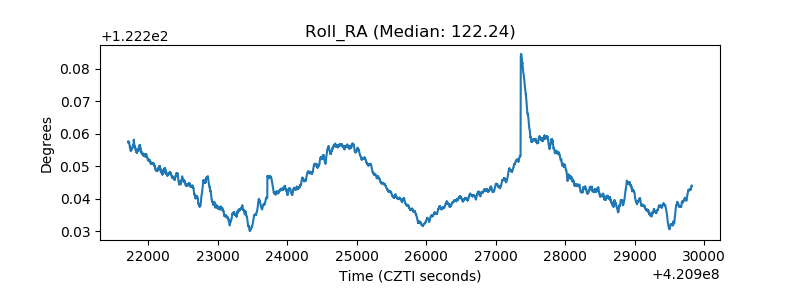 |
| Veto Counter | 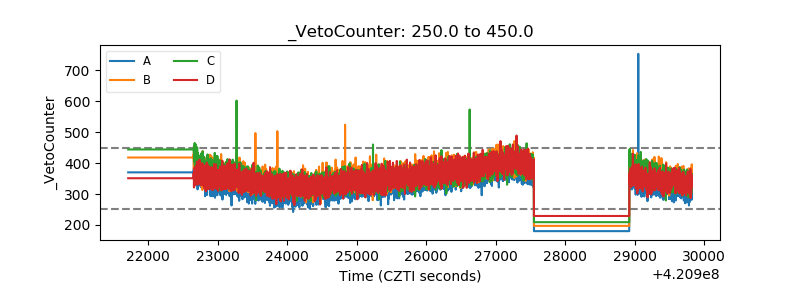 |