| Param | Original file | Final file |
|---|---|---|
| Filename | modeM0/AS1A12_095T02_9000005596_41089cztM0_level2.fits | modeM0/AS1A12_095T02_9000005596_41089cztM0_level2_quad_clean.evt |
| Size (bytes) | 397,932,480 | 93,101,760 |
| Size | 379.5 MB | 88.8 MB |
| Events in quadrant A | 3,247,205 | 638,401 |
| Events in quadrant B | 3,282,439 | 643,082 |
| Events in quadrant C | 2,881,307 | 623,600 |
| Events in quadrant D | 4,858,106 | 500,018 |
| Mode M0 | |||
|---|---|---|---|
| Quadrant | BADHDUFLAG | Total packets | Discarded packets |
| A | 0 | 13209 | 3 |
| B | 0 | 14055 | 2 |
| C | 0 | 12322 | 2 |
| D | 0 | 18864 | 2 |
| Mode SS | |||
|---|---|---|---|
| Quadrant | BADHDUFLAG | Total packets | Discarded packets |
| A | 0 | 120 | 0 |
| B | 0 | 120 | 0 |
| C | 0 | 120 | 0 |
| D | 0 | 120 | 0 |
| Mode M9 | |||
|---|---|---|---|
| Quadrant | BADHDUFLAG | Total packets | Discarded packets |
| A | 0 | 26 | 0 |
| B | 0 | 26 | 0 |
| C | 0 | 26 | 0 |
| D | 0 | 26 | 0 |
| Quadrant | Total seconds | Saturated seconds | Saturation percentage |
|---|---|---|---|
| A | 5923 | 12 | 0.202600% |
| B | 5923 | 110 | 1.857167% |
| C | 5923 | 34 | 0.574033% |
| D | 5923 | 889 | 15.009286% |
Noise dominated data is calculated using 1-second bins in cleaned event files. If a bin has >2000 counts, and if more than 50% of those come from <1% of pixels, then it is considered to be noise-dominated and hence unusable.
| Quadrant | # 1 sec bins | Bins with >0 counts | Bins with >2000 counts | High rate bins dominated by noise | Noise dominated (total time) | Noise dominated (detector-on time) | Marked lightcurve |
|---|---|---|---|---|---|---|---|
| A | 7235 | 5924 | 5 | 5 | 0.07% | 0.08% | 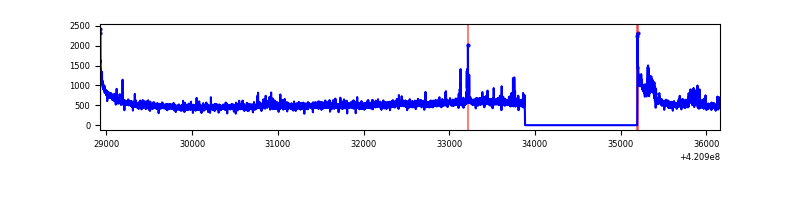 |
| B | 7235 | 5924 | 62 | 62 | 0.86% | 1.05% | 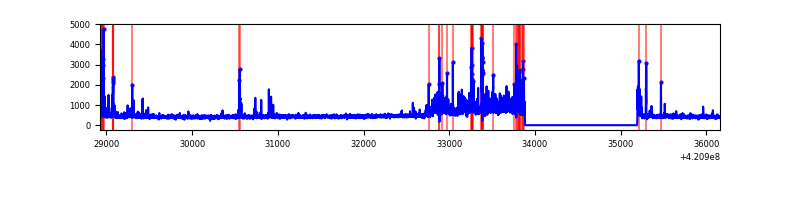 |
| C | 7235 | 5924 | 27 | 27 | 0.37% | 0.46% | 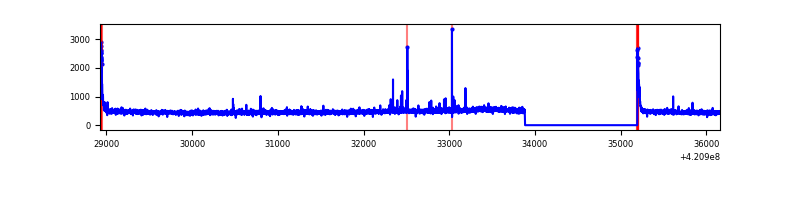 |
| D | 7235 | 5924 | 730 | 730 | 10.09% | 12.32% | 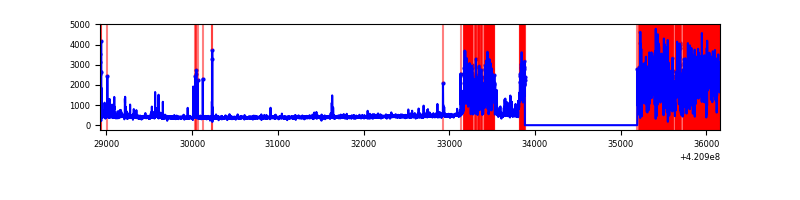 |
Top three noisy pixels from each quadrant. If the there are fewer than three noisy pixels in the level2.evt file, extra rows are filled as -1
| Pixel properties | Quadrant properties | ||||||
|---|---|---|---|---|---|---|---|
| Quadrant | DetID | PixID | Counts | Sigma | Mean | Median | Sigma |
| A | 10 | 83 | 567644 | 4181.14 | 651 | 638 | 135.6 |
| A | 12 | 189 | 84612 | 619.23 | 651 | 638 | 135.6 |
| A | 2 | 79 | 54375 | 396.26 | 651 | 638 | 135.6 |
| B | 0 | 186 | 375777 | 2975.39 | 643 | 627 | 126.1 |
| B | 5 | 255 | 198916 | 1572.67 | 643 | 627 | 126.1 |
| B | 5 | 32 | 79582 | 626.21 | 643 | 627 | 126.1 |
| C | 15 | 214 | 254824 | 1696.33 | 637 | 641 | 149.8 |
| C | 0 | 10 | 99705 | 661.12 | 637 | 641 | 149.8 |
| C | 14 | 254 | 17675 | 113.68 | 637 | 641 | 149.8 |
| D | 2 | 249 | 2390736 | 16023.72 | 598 | 580 | 149.2 |
| D | 13 | 249 | 88565 | 589.86 | 598 | 580 | 149.2 |
| D | 2 | 234 | 29485 | 193.78 | 598 | 580 | 149.2 |
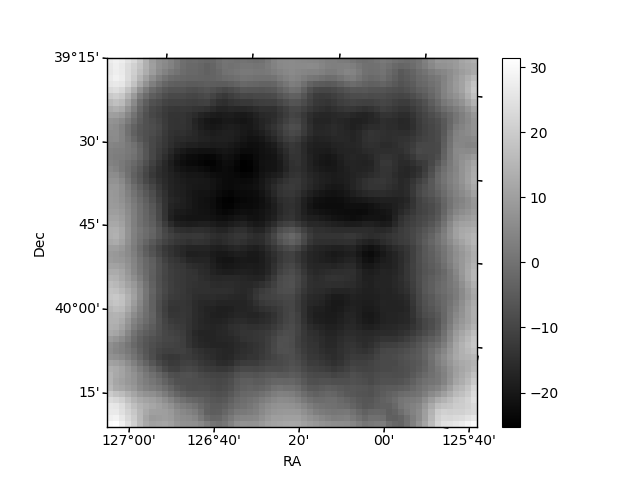
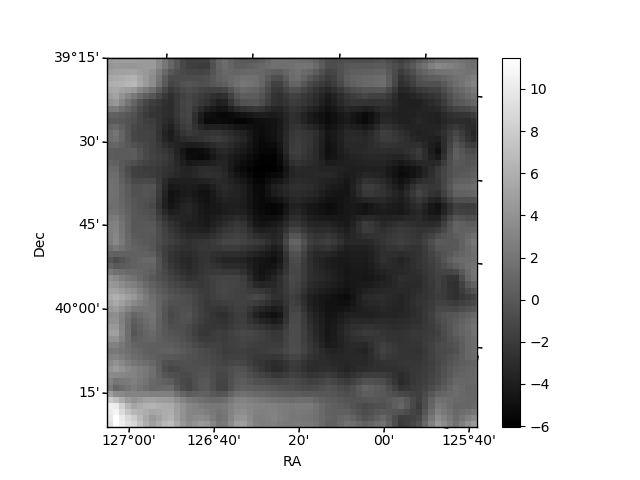
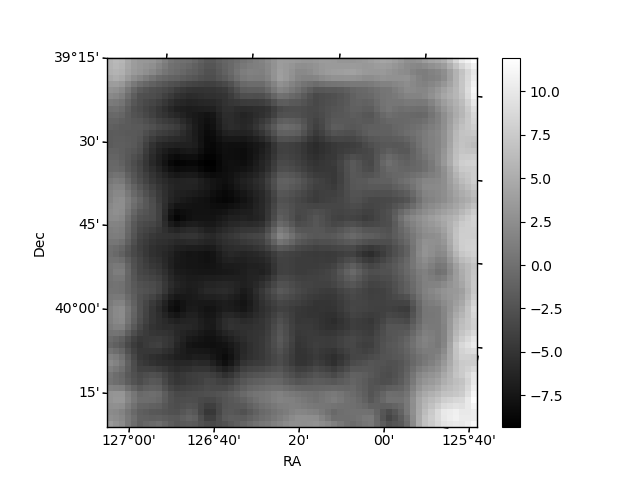
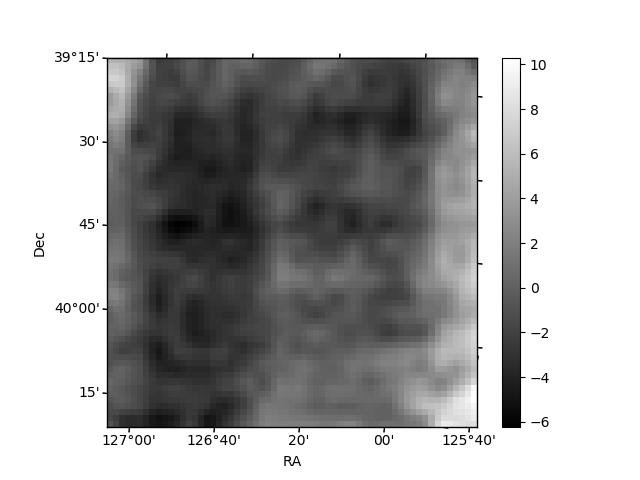
Histogram calculated using DETX and DETY for each event in the final _common_clean file
| Quadrant A | 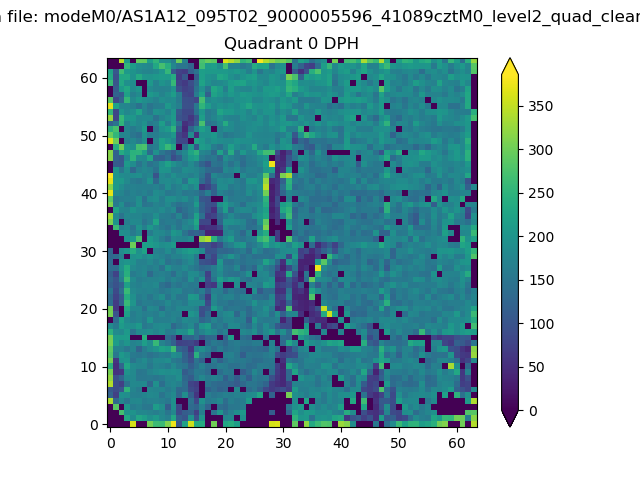 |
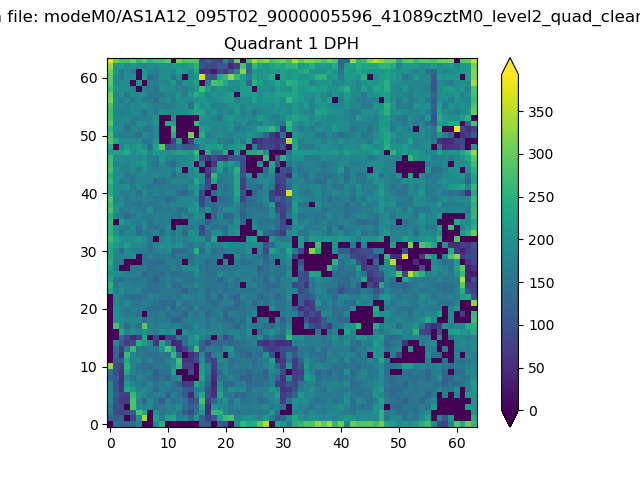 |
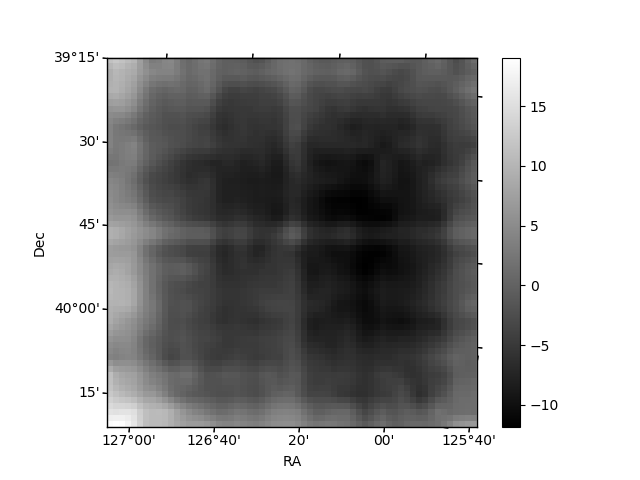
Quadrant B |
|---|---|---|---|
| Quadrant D | 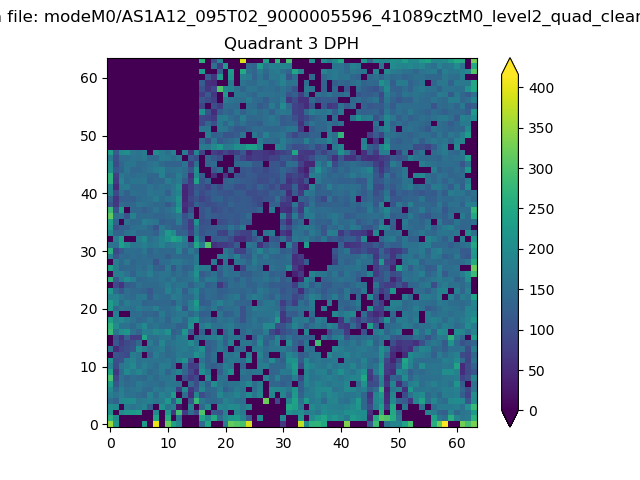 |
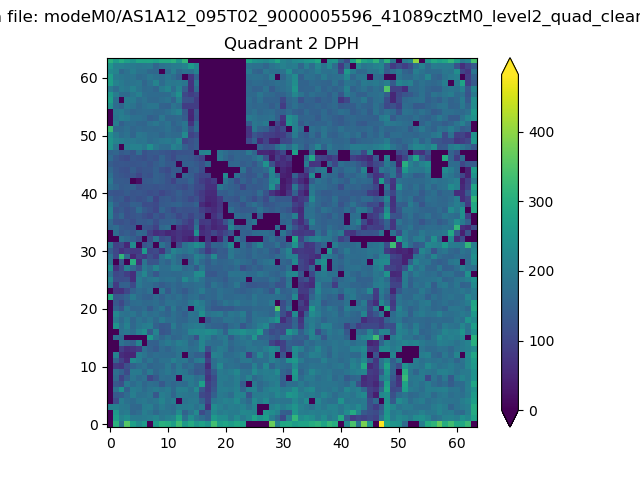 |
Quadrant C |
| Plot type | Count rate plots | Images |
|---|---|---|
| Comparison with Poisson distribution Blue bars denote a histogram of data divided into 1 sec bins. Red curve is a Poisson curve with rate = median count rate of data. |
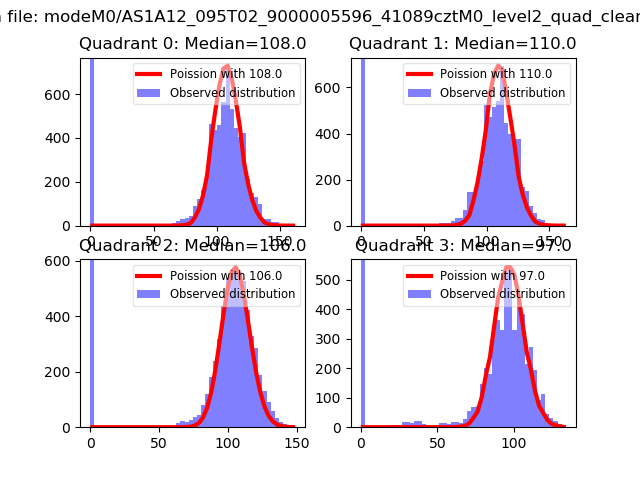 |
 |
| Quadrant-wise count rates Data is divided into 100 sec bins |
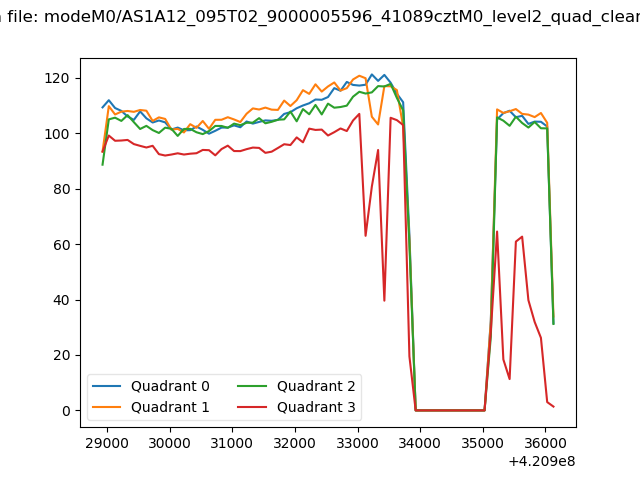 |
|
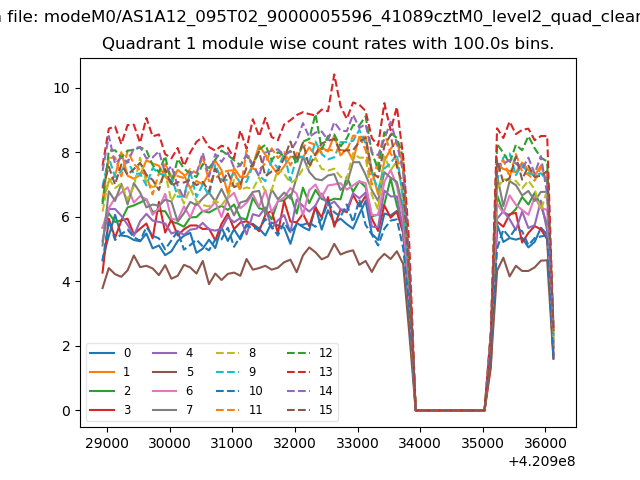
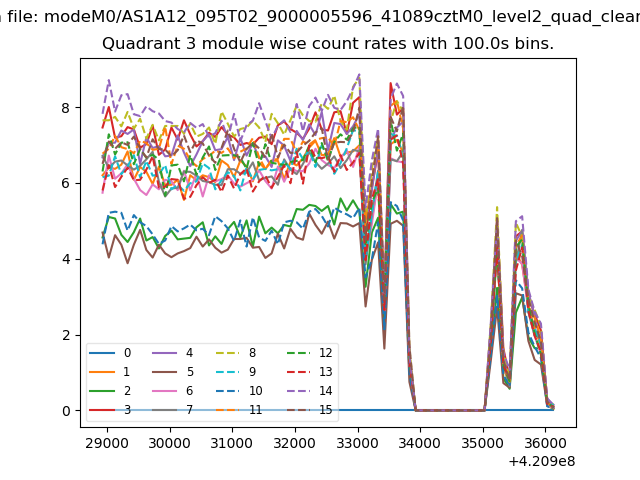
| Module-wise count rates for Quadrant A Data is divided into 100 sec bins |
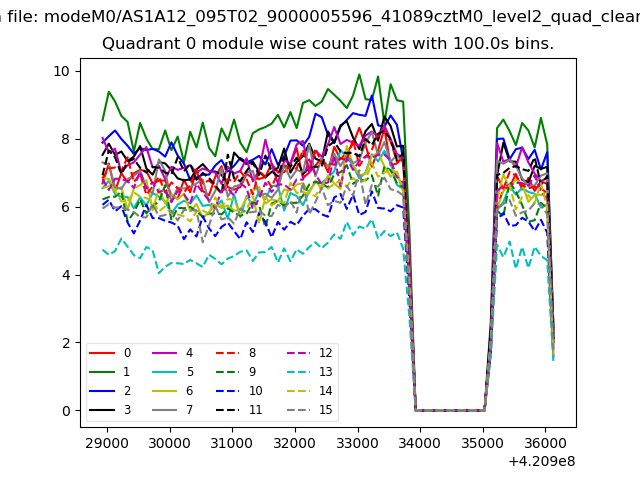 |
 |
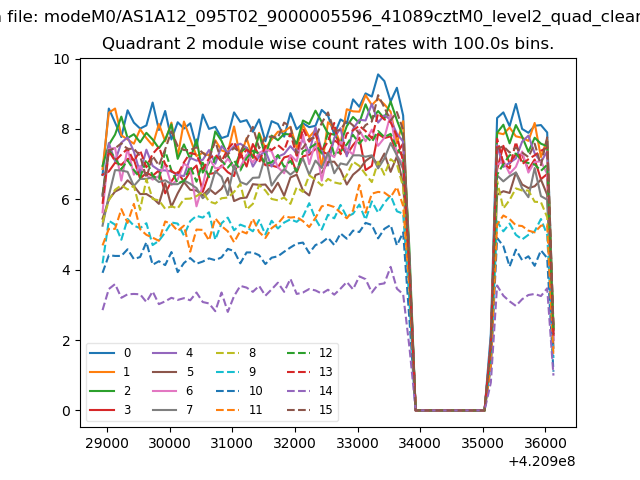
| Module-wise count rates for Quadrant B Data is divided into 100 sec bins |
 |
 |
| Module-wise count rates for Quadrant C Data is divided into 100 sec bins |
 |
 |
| Module-wise count rates for Quadrant D Data is divided into 100 sec bins |
 |
 |
| Parameter | Plot |
|---|---|
| CZT HV Monitor | 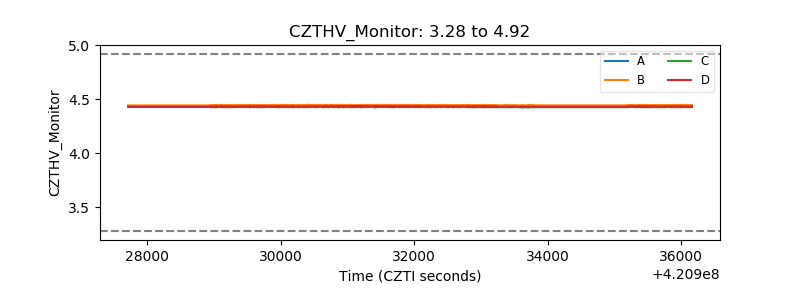 |
| D_VDD | 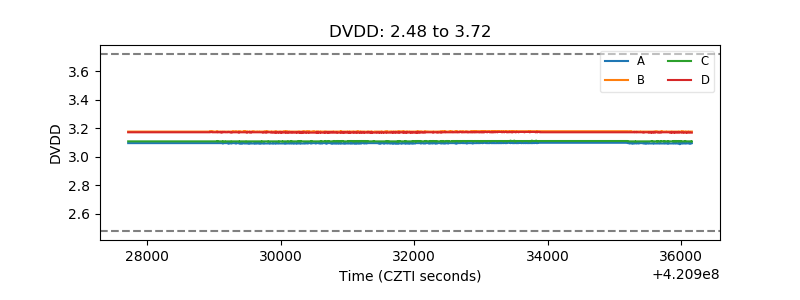 |
| Temperature 1 | 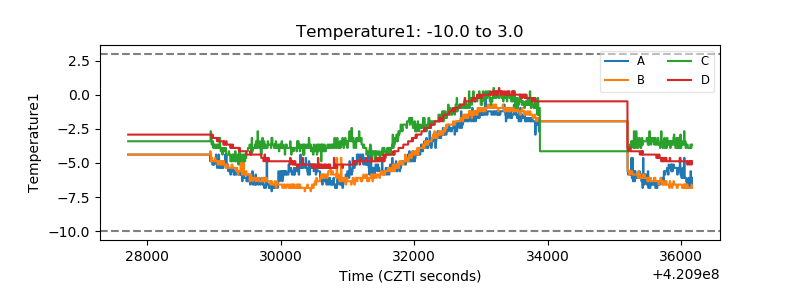 |
| Veto HV Monitor | 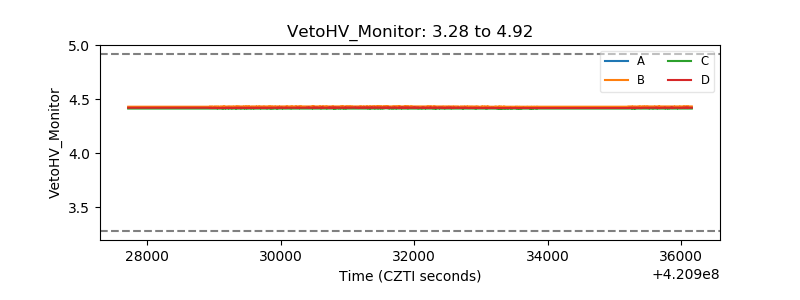 |
| Veto LLD | 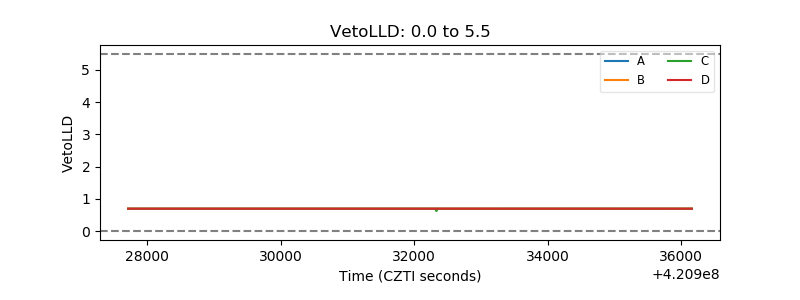 |
| Alpha Counter | 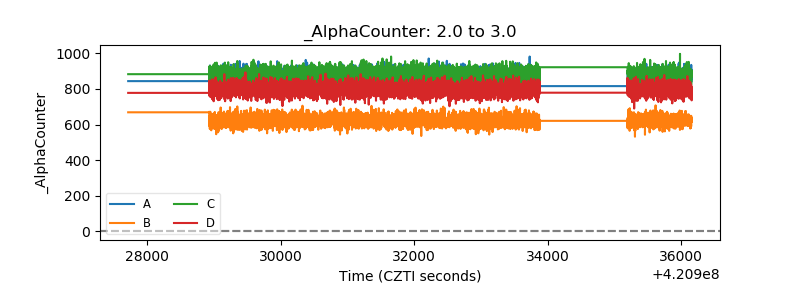 |
| _CPM_Rate | 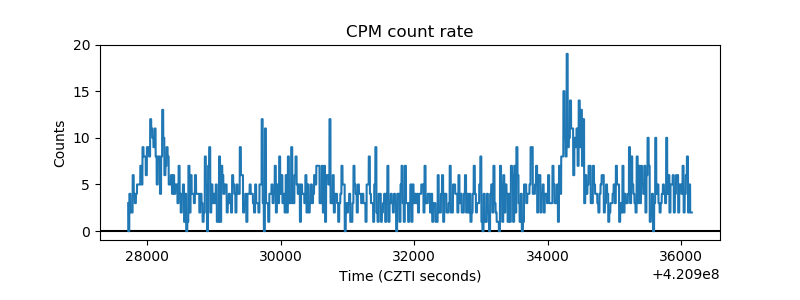 |
| CZT Counter | 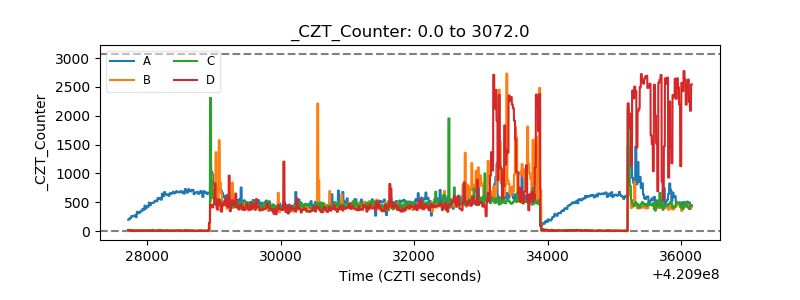 |
| +2.5 Volts monitor |  |
| +5 Volts monitor | 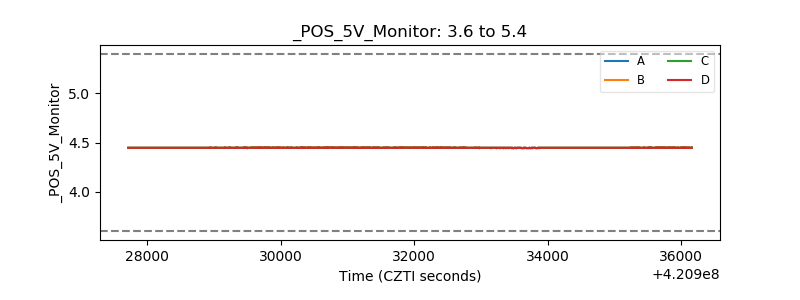 |
| _ROLL_ROT | 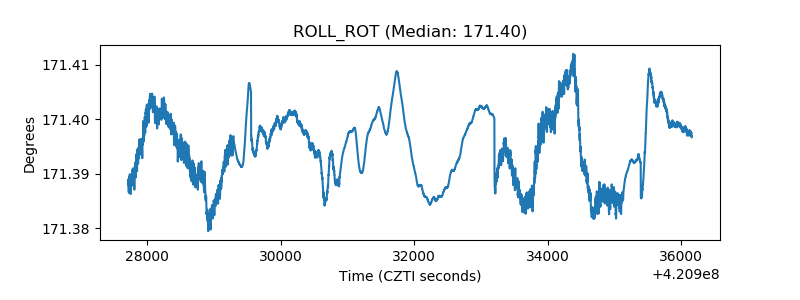 |
| _Roll_DEC | 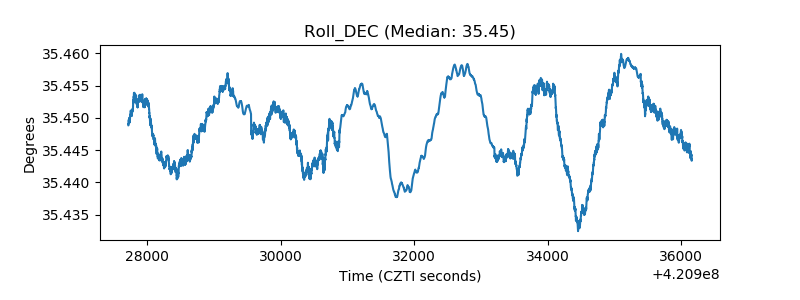 |
| _Roll_RA | 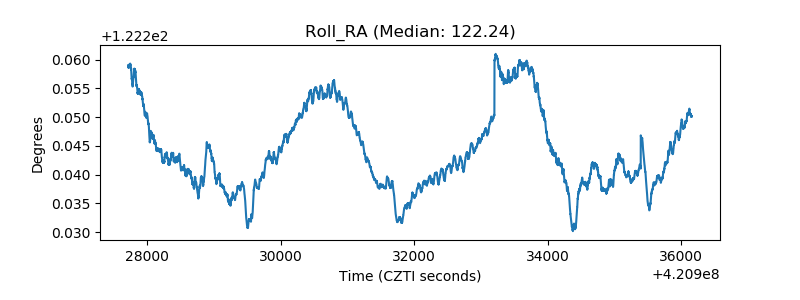 |
| Veto Counter | 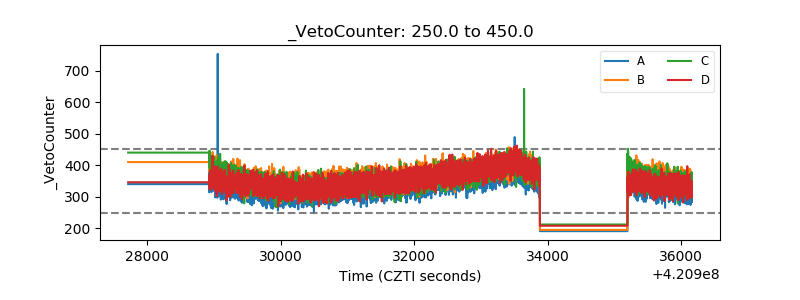 |