| Param | Original file | Final file |
|---|---|---|
| Filename | modeM0/AS1A12_095T02_9000005596_41092cztM0_level2.fits | modeM0/AS1A12_095T02_9000005596_41092cztM0_level2_quad_clean.evt |
| Size (bytes) | 983,459,520 | 238,345,920 |
| Size | 937.9 MB | 227.3 MB |
| Events in quadrant A | 8,537,860 | 1,621,069 |
| Events in quadrant B | 8,504,659 | 1,642,578 |
| Events in quadrant C | 7,580,027 | 1,576,975 |
| Events in quadrant D | 10,594,462 | 1,317,583 |
| Mode M0 | |||
|---|---|---|---|
| Quadrant | BADHDUFLAG | Total packets | Discarded packets |
| A | 0 | 34322 | 5 |
| B | 0 | 35904 | 4 |
| C | 0 | 31975 | 4 |
| D | 0 | 42386 | 4 |
| Mode SS | |||
|---|---|---|---|
| Quadrant | BADHDUFLAG | Total packets | Discarded packets |
| A | 0 | 314 | 0 |
| B | 0 | 314 | 0 |
| C | 0 | 314 | 0 |
| D | 0 | 314 | 0 |
| Mode M9 | |||
|---|---|---|---|
| Quadrant | BADHDUFLAG | Total packets | Discarded packets |
| A | 0 | 43 | 0 |
| B | 0 | 43 | 0 |
| C | 0 | 43 | 0 |
| D | 0 | 43 | 0 |
| Quadrant | Total seconds | Saturated seconds | Saturation percentage |
|---|---|---|---|
| A | 15324 | 26 | 0.169668% |
| B | 15324 | 265 | 1.729313% |
| C | 15324 | 88 | 0.574263% |
| D | 15325 | 1419 | 9.259380% |
Noise dominated data is calculated using 1-second bins in cleaned event files. If a bin has >2000 counts, and if more than 50% of those come from <1% of pixels, then it is considered to be noise-dominated and hence unusable.
| Quadrant | # 1 sec bins | Bins with >0 counts | Bins with >2000 counts | High rate bins dominated by noise | Noise dominated (total time) | Noise dominated (detector-on time) | Marked lightcurve |
|---|---|---|---|---|---|---|---|
| A | 19621 | 15327 | 8 | 8 | 0.04% | 0.05% | 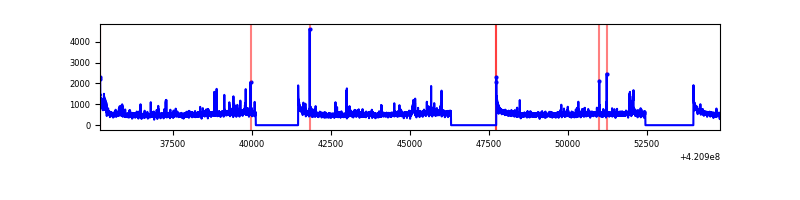 |
| B | 19621 | 15327 | 157 | 157 | 0.80% | 1.02% | 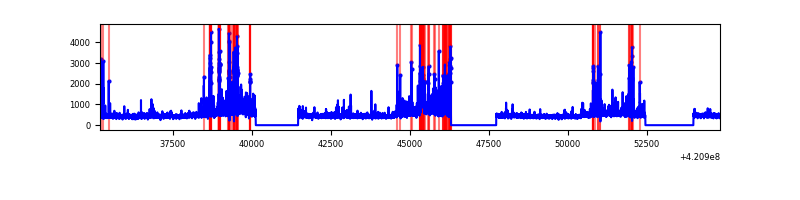 |
| C | 19621 | 15327 | 64 | 64 | 0.33% | 0.42% | 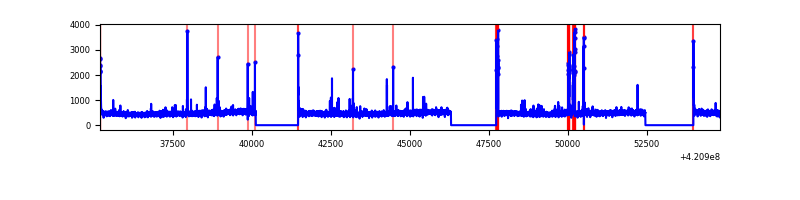 |
| D | 19622 | 15328 | 1196 | 1196 | 6.10% | 7.80% | 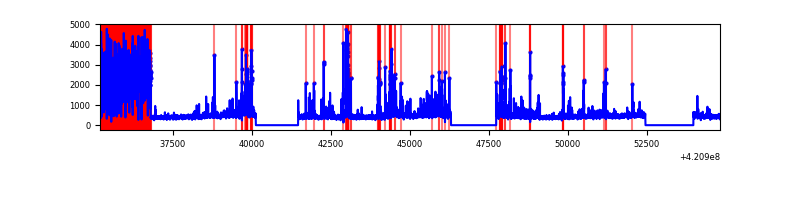 |
Top three noisy pixels from each quadrant. If the there are fewer than three noisy pixels in the level2.evt file, extra rows are filled as -1
| Pixel properties | Quadrant properties | ||||||
|---|---|---|---|---|---|---|---|
| Quadrant | DetID | PixID | Counts | Sigma | Mean | Median | Sigma |
| A | 10 | 83 | 1378917 | 3942.57 | 1713 | 1678 | 349.3 |
| A | 12 | 189 | 329003 | 937.02 | 1713 | 1678 | 349.3 |
| A | 2 | 79 | 102298 | 288.04 | 1713 | 1678 | 349.3 |
| B | 0 | 186 | 819884 | 2498.14 | 1691 | 1644 | 327.5 |
| B | 5 | 255 | 631049 | 1921.62 | 1691 | 1644 | 327.5 |
| B | 0 | 190 | 111658 | 335.88 | 1691 | 1644 | 327.5 |
| C | 15 | 214 | 653917 | 1685.43 | 1666 | 1674 | 387.0 |
| C | 14 | 254 | 254847 | 654.21 | 1666 | 1674 | 387.0 |
| C | 0 | 10 | 100085 | 254.3 | 1666 | 1674 | 387.0 |
| D | 2 | 249 | 3859853 | 9759.89 | 1601 | 1552 | 395.3 |
| D | 13 | 249 | 254316 | 639.39 | 1601 | 1552 | 395.3 |
| D | 9 | 19 | 95479 | 237.6 | 1601 | 1552 | 395.3 |
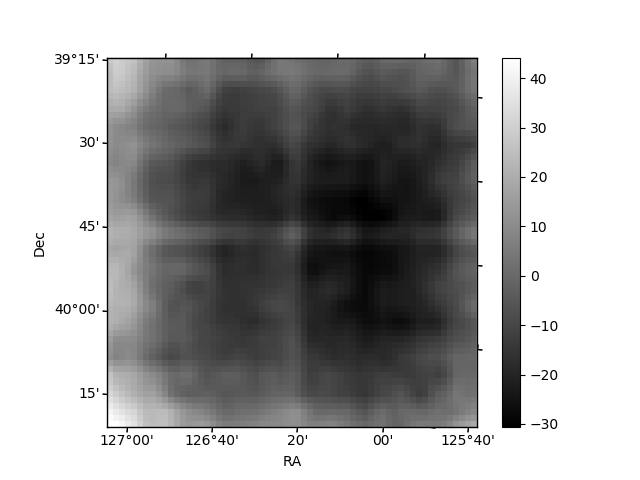
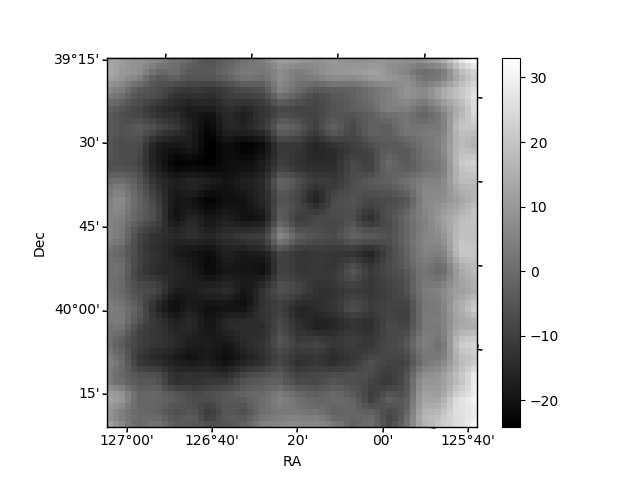
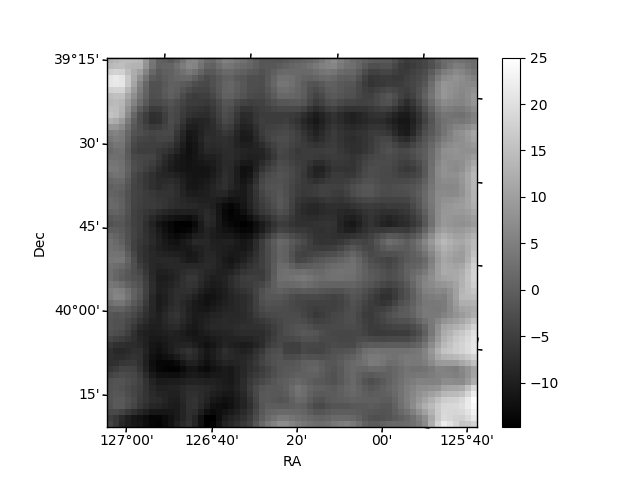
Histogram calculated using DETX and DETY for each event in the final _common_clean file
| Quadrant A | 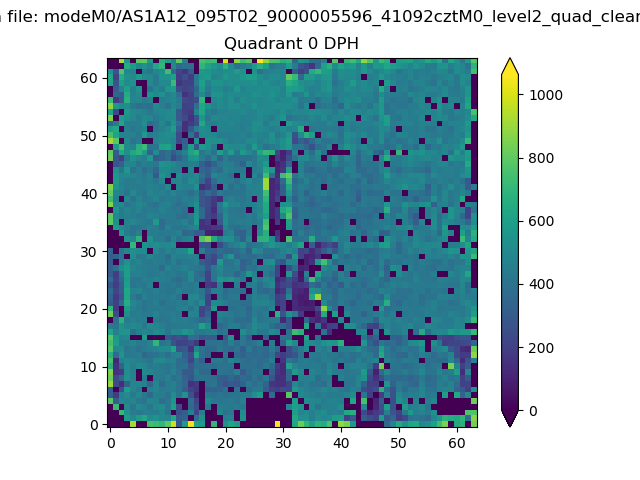 |
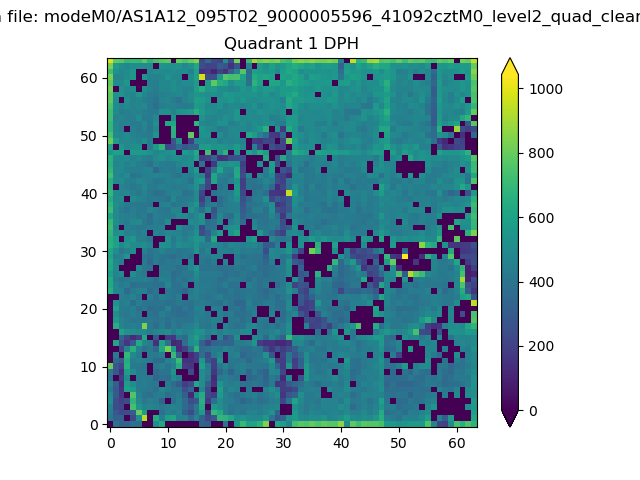 |
Quadrant B |
|---|---|---|---|
| Quadrant D | 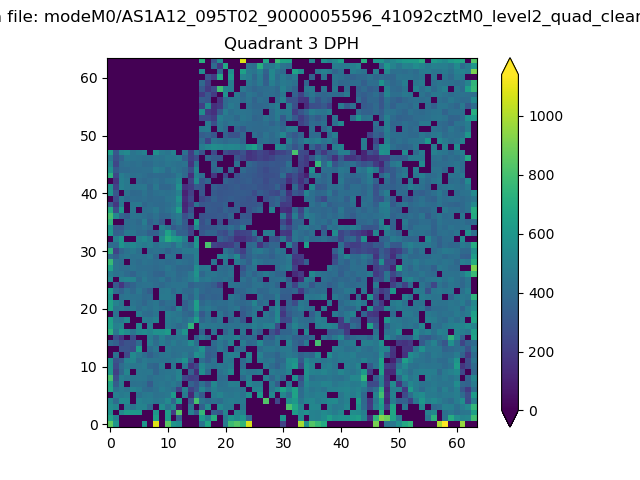 |
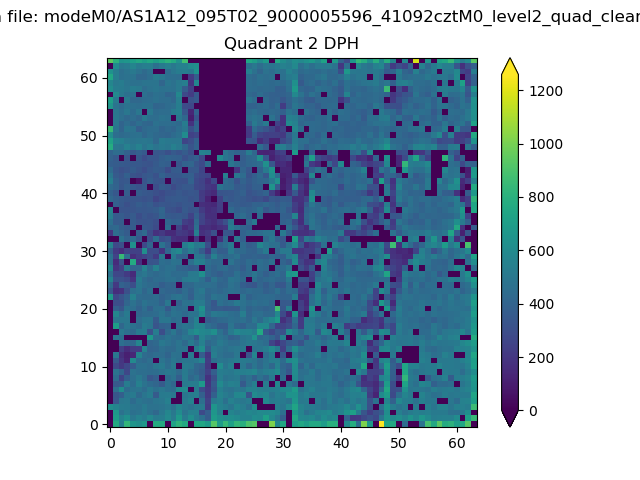 |
Quadrant C |
| Plot type | Count rate plots | Images |
|---|---|---|
| Comparison with Poisson distribution Blue bars denote a histogram of data divided into 1 sec bins. Red curve is a Poisson curve with rate = median count rate of data. |
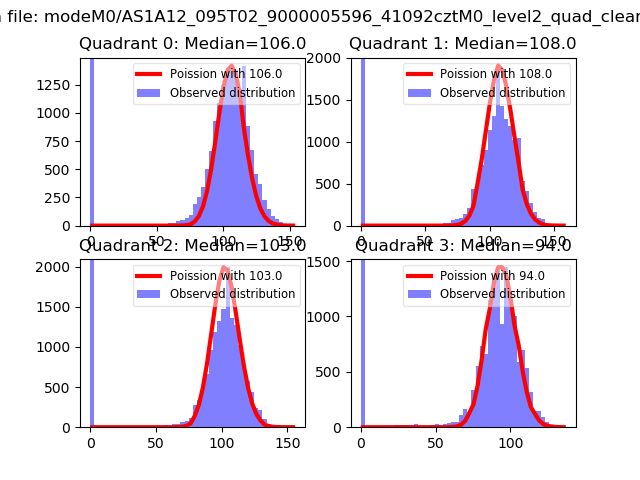 |
 |
| Quadrant-wise count rates Data is divided into 100 sec bins |
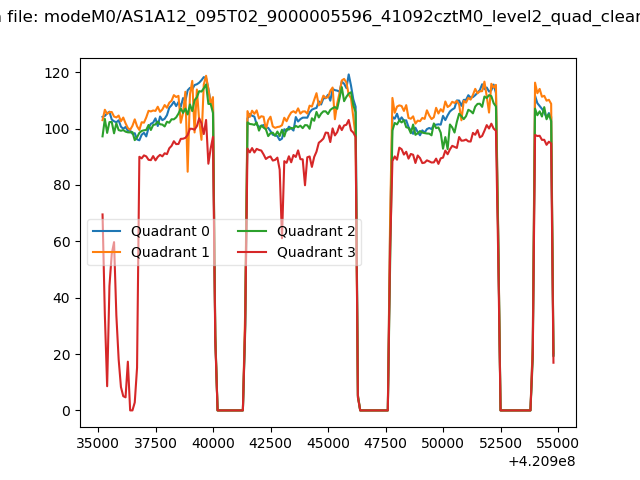 |
|
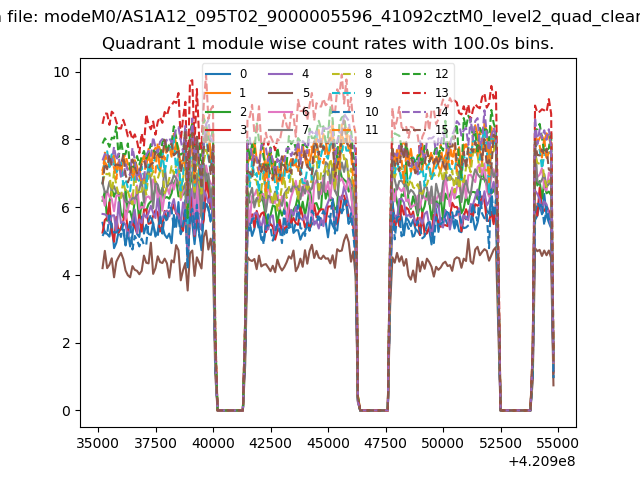
| Module-wise count rates for Quadrant A Data is divided into 100 sec bins |
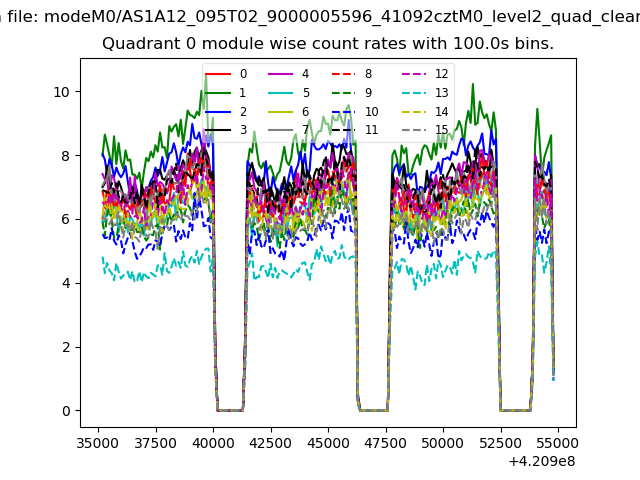 |
 |
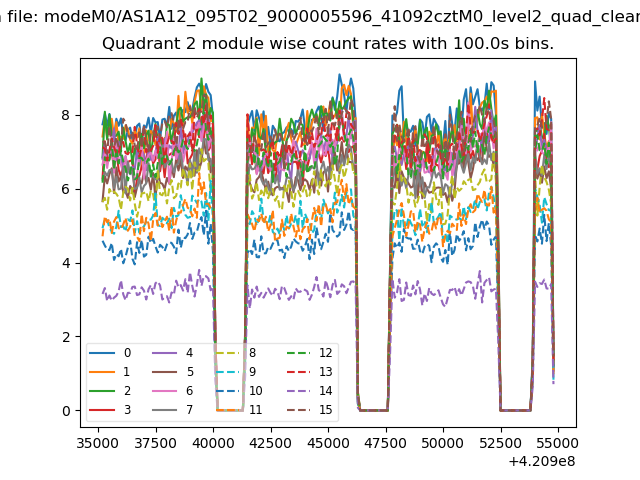
| Module-wise count rates for Quadrant B Data is divided into 100 sec bins |
 |
 |
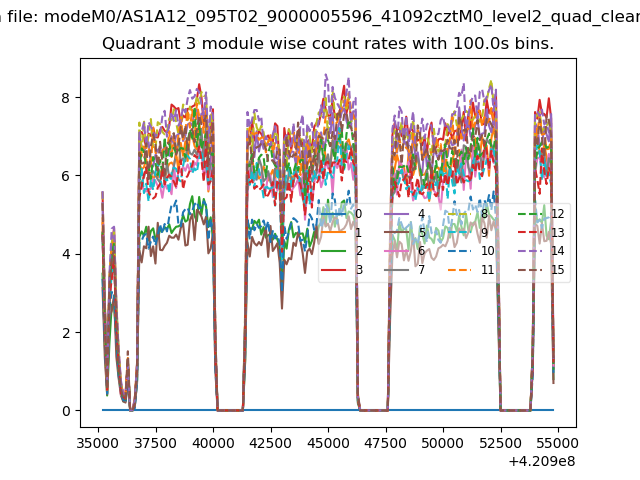
| Module-wise count rates for Quadrant C Data is divided into 100 sec bins |
 |
 |
| Module-wise count rates for Quadrant D Data is divided into 100 sec bins |
 |
 |
| Parameter | Plot |
|---|---|
| CZT HV Monitor | 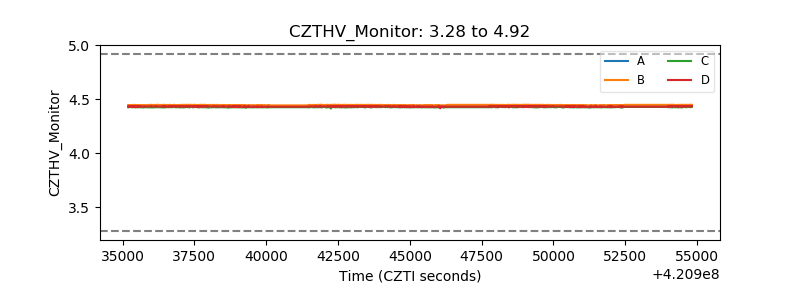 |
| D_VDD | 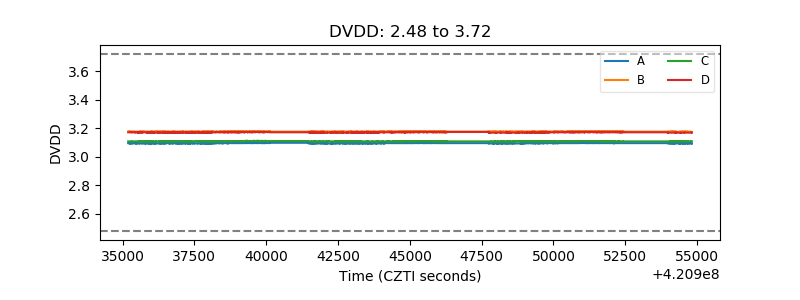 |
| Temperature 1 | 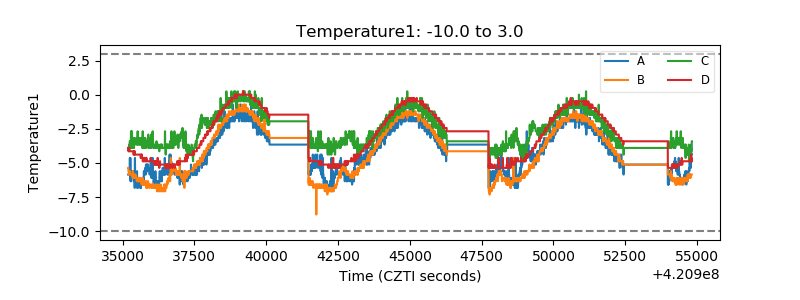 |
| Veto HV Monitor | 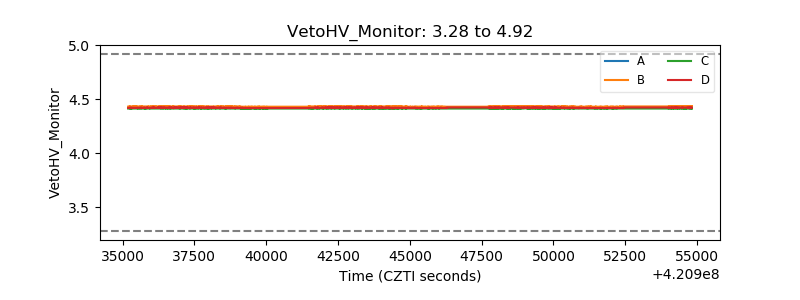 |
| Veto LLD | 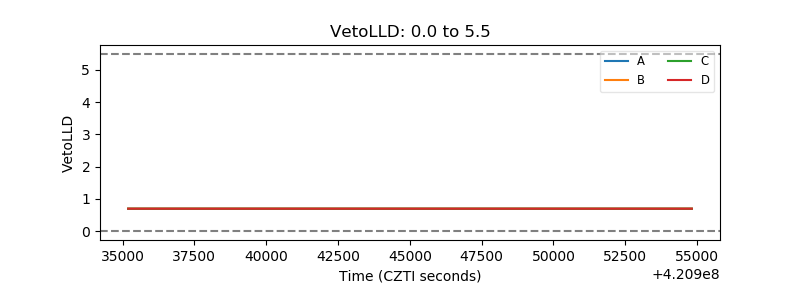 |
| Alpha Counter | 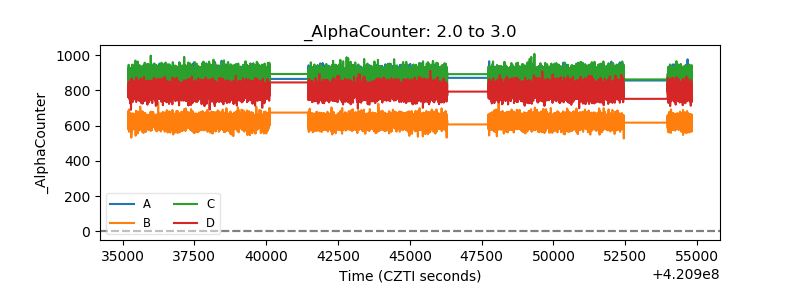 |
| _CPM_Rate | 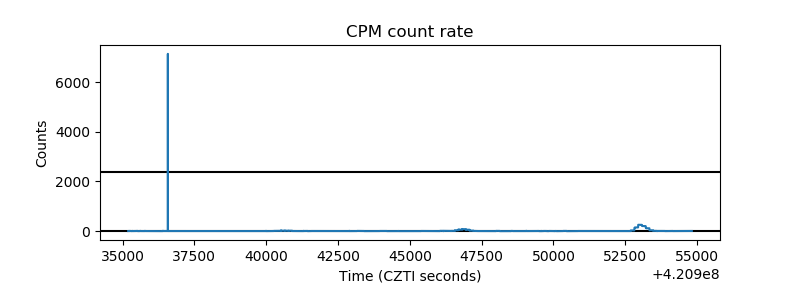 |
| CZT Counter | 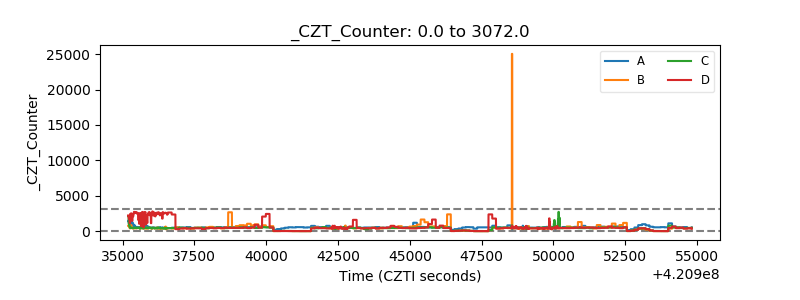 |
| +2.5 Volts monitor | 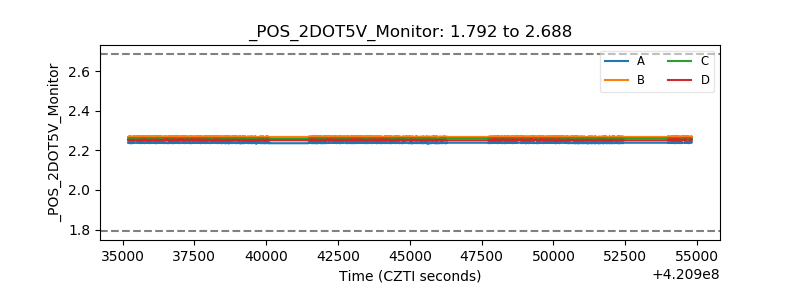 |
| +5 Volts monitor | 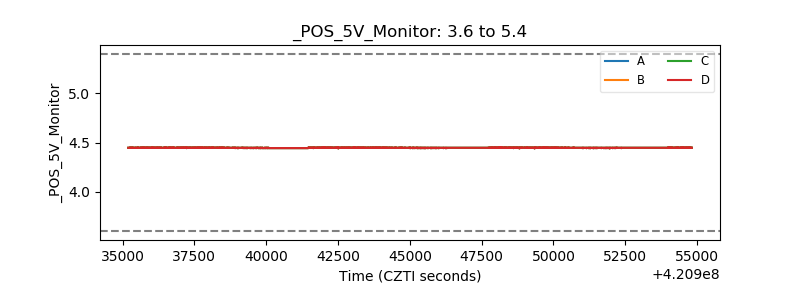 |
| _ROLL_ROT | 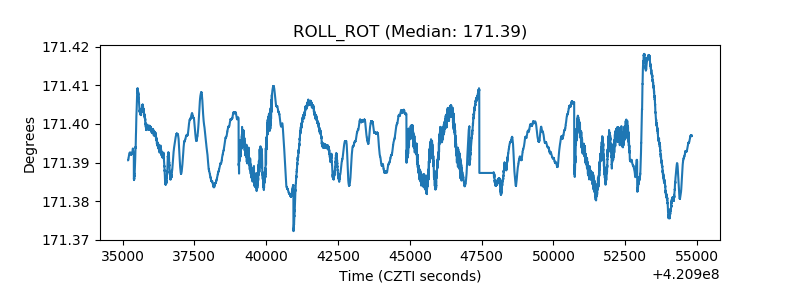 |
| _Roll_DEC |  |
| _Roll_RA | 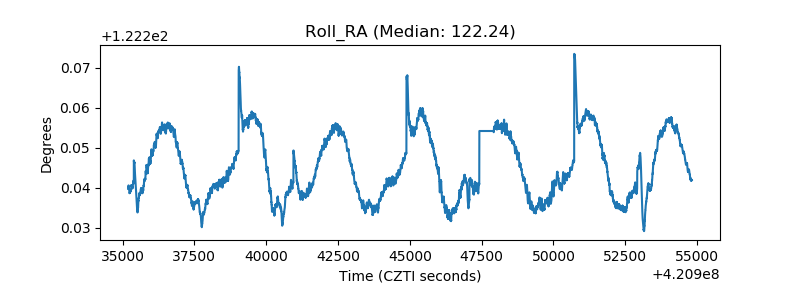 |
| Veto Counter | 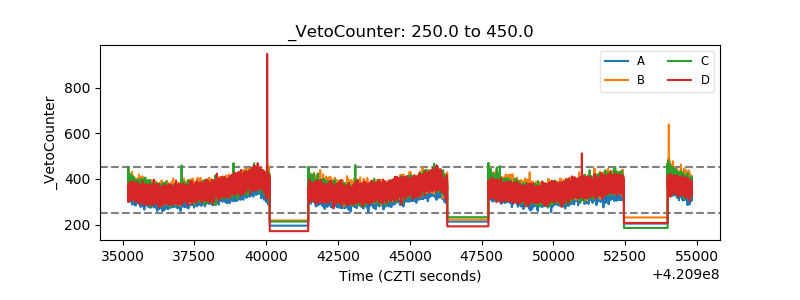 |