| Param | Original file | Final file |
|---|---|---|
| Filename | modeM0/AS1A12_095T02_9000005596_41093cztM0_level2.fits | modeM0/AS1A12_095T02_9000005596_41093cztM0_level2_quad_clean.evt |
| Size (bytes) | 327,133,440 | 92,289,600 |
| Size | 312.0 MB | 88.0 MB |
| Events in quadrant A | 3,108,851 | 614,627 |
| Events in quadrant B | 3,022,691 | 633,151 |
| Events in quadrant C | 2,690,682 | 602,940 |
| Events in quadrant D | 2,852,446 | 553,713 |
| Mode M0 | |||
|---|---|---|---|
| Quadrant | BADHDUFLAG | Total packets | Discarded packets |
| A | 0 | 12471 | 3 |
| B | 0 | 12600 | 2 |
| C | 0 | 11374 | 2 |
| D | 0 | 12407 | 2 |
| Mode SS | |||
|---|---|---|---|
| Quadrant | BADHDUFLAG | Total packets | Discarded packets |
| A | 0 | 112 | 0 |
| B | 0 | 112 | 0 |
| C | 0 | 112 | 0 |
| D | 0 | 112 | 0 |
| Mode M9 | |||
|---|---|---|---|
| Quadrant | BADHDUFLAG | Total packets | Discarded packets |
| A | 0 | 19 | 0 |
| B | 0 | 19 | 0 |
| C | 0 | 19 | 0 |
| D | 0 | 20 | 0 |
| Quadrant | Total seconds | Saturated seconds | Saturation percentage |
|---|---|---|---|
| A | 5580 | 18 | 0.322581% |
| B | 5580 | 70 | 1.254480% |
| C | 5580 | 11 | 0.197133% |
| D | 5580 | 43 | 0.770609% |
Noise dominated data is calculated using 1-second bins in cleaned event files. If a bin has >2000 counts, and if more than 50% of those come from <1% of pixels, then it is considered to be noise-dominated and hence unusable.
| Quadrant | # 1 sec bins | Bins with >0 counts | Bins with >2000 counts | High rate bins dominated by noise | Noise dominated (total time) | Noise dominated (detector-on time) | Marked lightcurve |
|---|---|---|---|---|---|---|---|
| A | 7223 | 5581 | 2 | 2 | 0.03% | 0.04% | 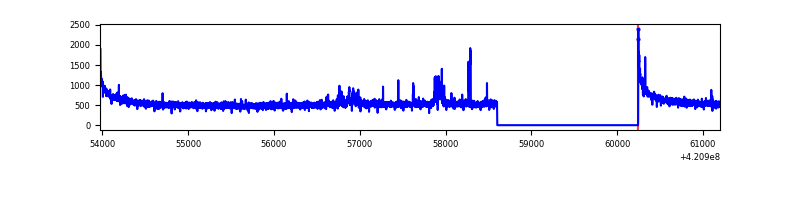 |
| B | 7223 | 5581 | 37 | 37 | 0.51% | 0.66% | 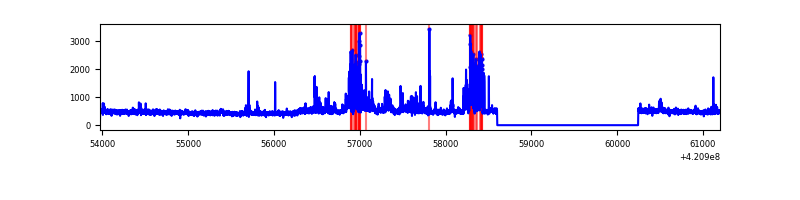 |
| C | 7223 | 5581 | 4 | 4 | 0.06% | 0.07% | 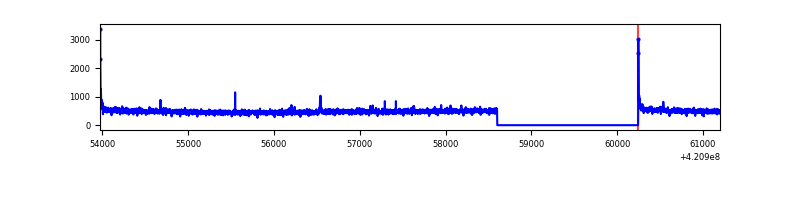 |
| D | 7223 | 5581 | 31 | 31 | 0.43% | 0.56% | 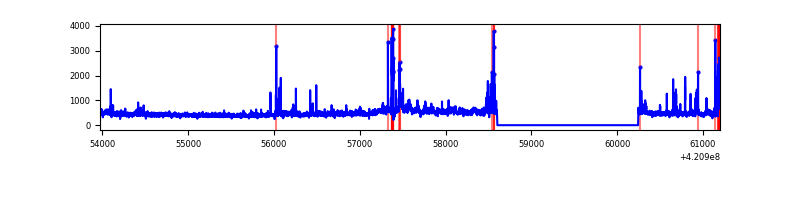 |
Top three noisy pixels from each quadrant. If the there are fewer than three noisy pixels in the level2.evt file, extra rows are filled as -1
| Pixel properties | Quadrant properties | ||||||
|---|---|---|---|---|---|---|---|
| Quadrant | DetID | PixID | Counts | Sigma | Mean | Median | Sigma |
| A | 10 | 83 | 552687 | 4213.64 | 634 | 621 | 131.0 |
| A | 12 | 189 | 81262 | 615.49 | 634 | 621 | 131.0 |
| A | 2 | 79 | 18955 | 139.93 | 634 | 621 | 131.0 |
| B | 0 | 245 | 234266 | 1904.59 | 629 | 611 | 122.7 |
| B | 0 | 186 | 127662 | 1035.63 | 629 | 611 | 122.7 |
| B | 5 | 255 | 74477 | 602.1 | 629 | 611 | 122.7 |
| C | 15 | 214 | 241620 | 1676.4 | 614 | 619 | 143.8 |
| C | 0 | 10 | 35309 | 241.3 | 614 | 619 | 143.8 |
| C | 14 | 254 | 9767 | 63.63 | 614 | 619 | 143.8 |
| D | 1 | 52 | 161219 | 1074.93 | 613 | 595 | 149.4 |
| D | 13 | 249 | 150872 | 1005.68 | 613 | 595 | 149.4 |
| D | 5 | 32 | 79051 | 525.04 | 613 | 595 | 149.4 |
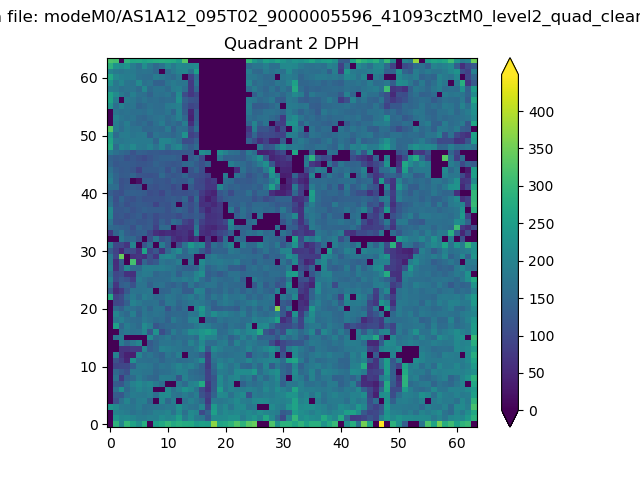
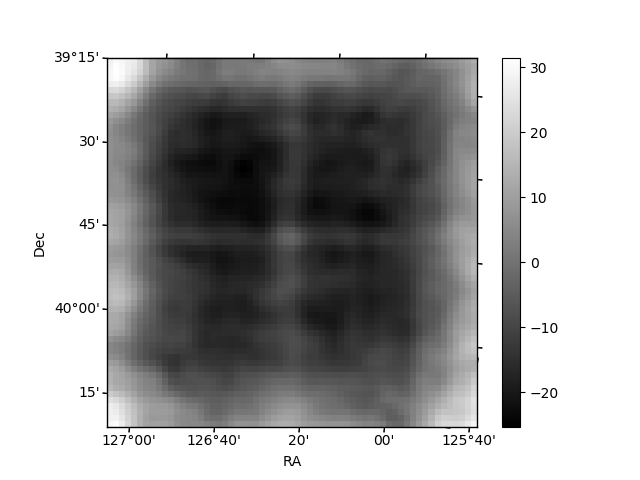
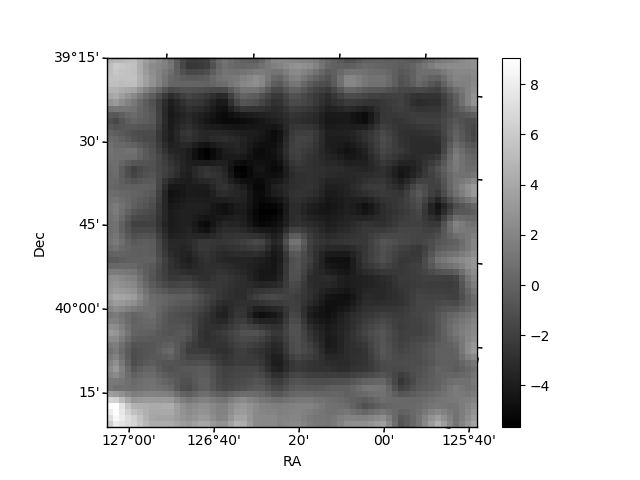
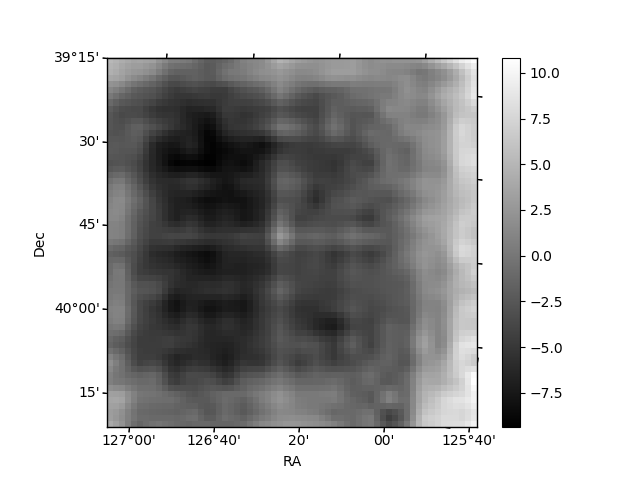
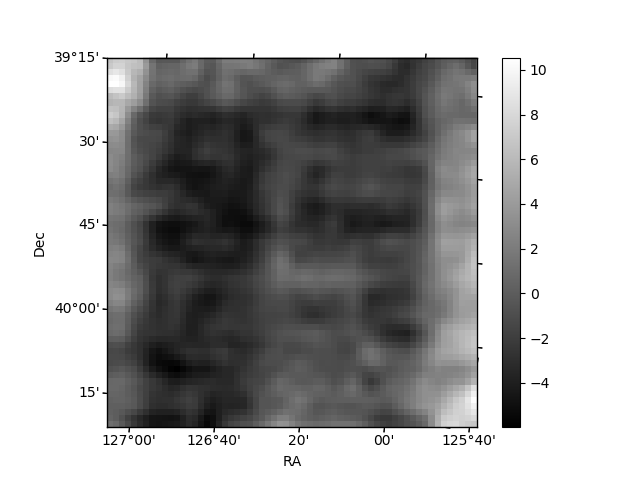
Histogram calculated using DETX and DETY for each event in the final _common_clean file
| Quadrant A | 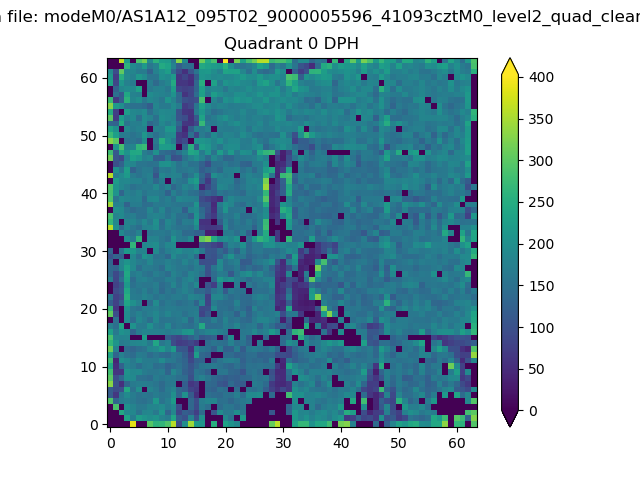 |
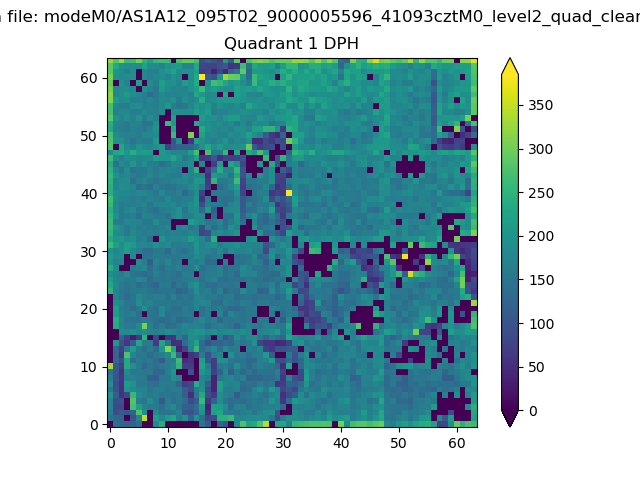 |
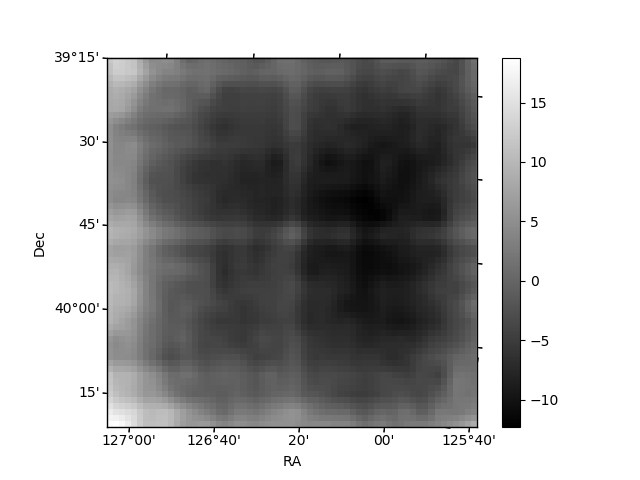
Quadrant B |
|---|---|---|---|
| Quadrant D | 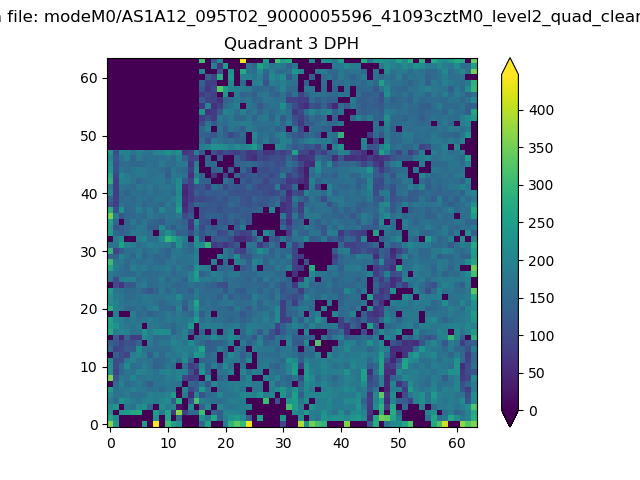 |
 |
Quadrant C |
| Plot type | Count rate plots | Images |
|---|---|---|
| Comparison with Poisson distribution Blue bars denote a histogram of data divided into 1 sec bins. Red curve is a Poisson curve with rate = median count rate of data. |
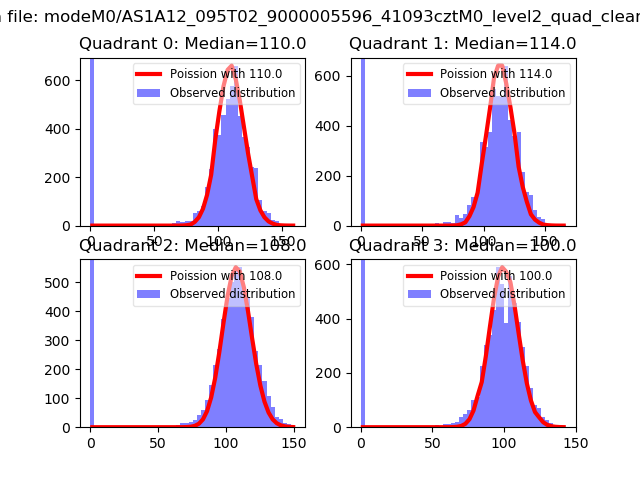 |
 |
| Quadrant-wise count rates Data is divided into 100 sec bins |
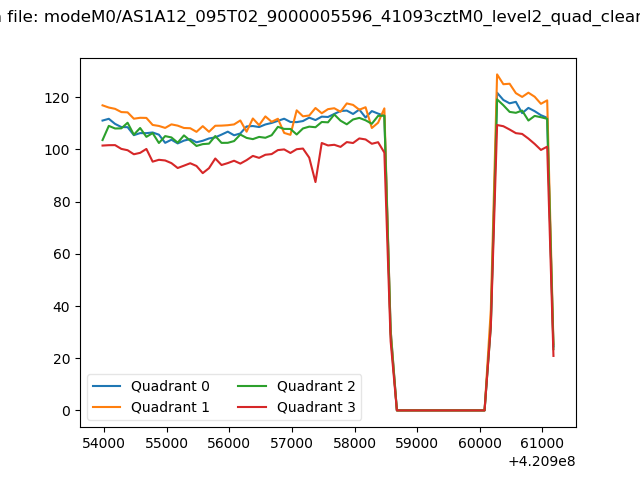 |
|
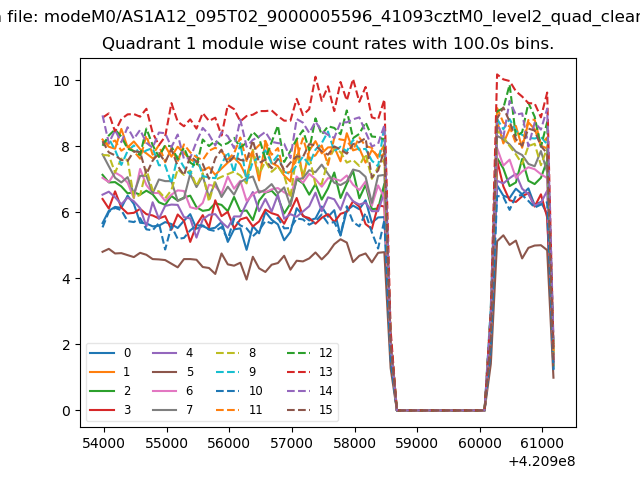
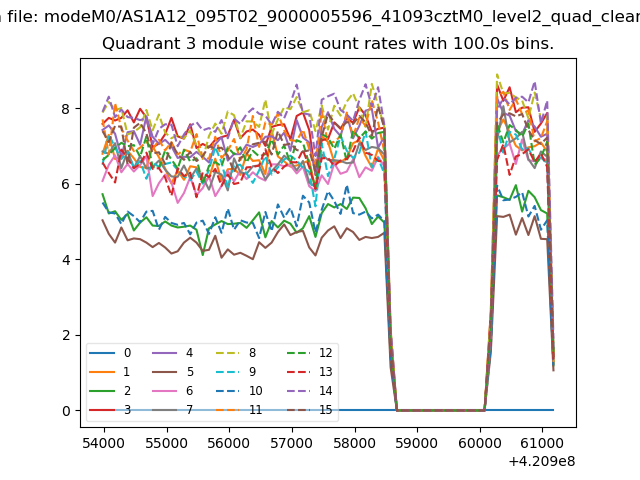
| Module-wise count rates for Quadrant A Data is divided into 100 sec bins |
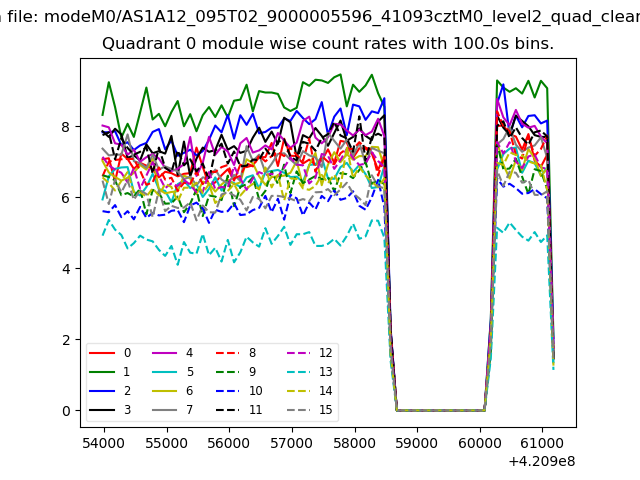 |
 |
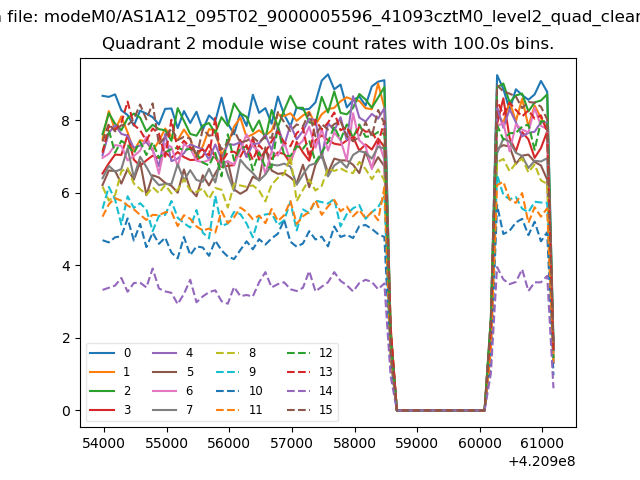
| Module-wise count rates for Quadrant B Data is divided into 100 sec bins |
 |
 |
| Module-wise count rates for Quadrant C Data is divided into 100 sec bins |
 |
 |
| Module-wise count rates for Quadrant D Data is divided into 100 sec bins |
 |
 |
| Parameter | Plot |
|---|---|
| CZT HV Monitor | 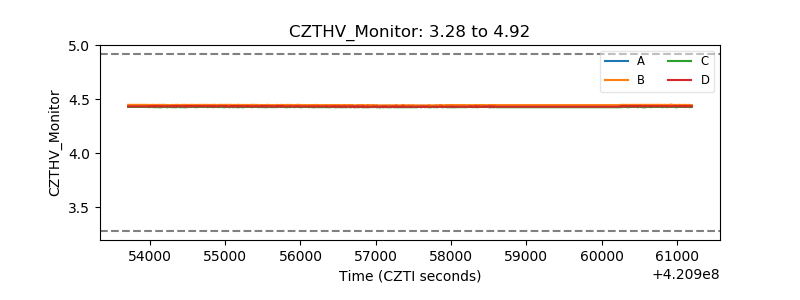 |
| D_VDD | 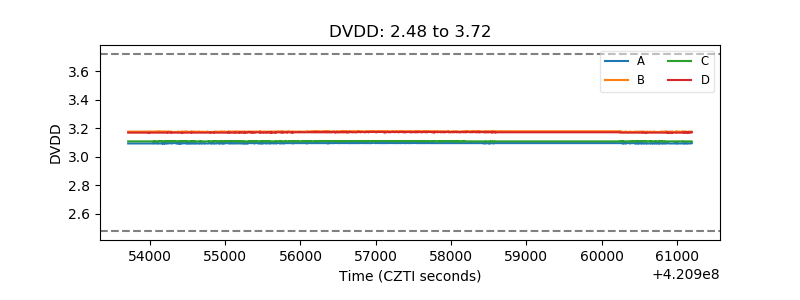 |
| Temperature 1 | 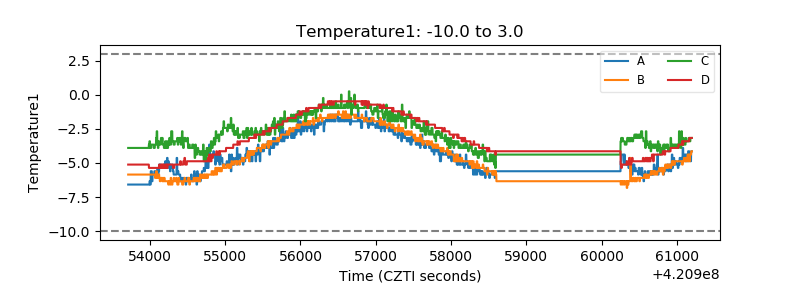 |
| Veto HV Monitor | 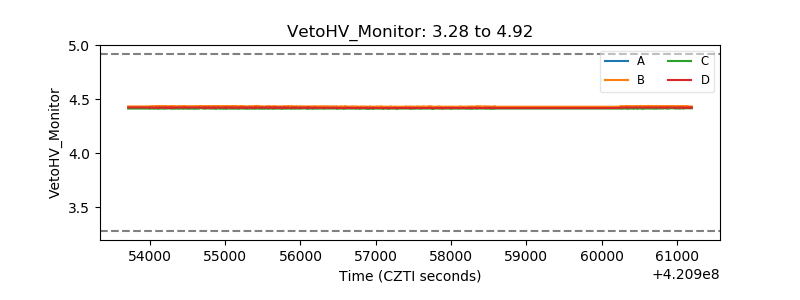 |
| Veto LLD | 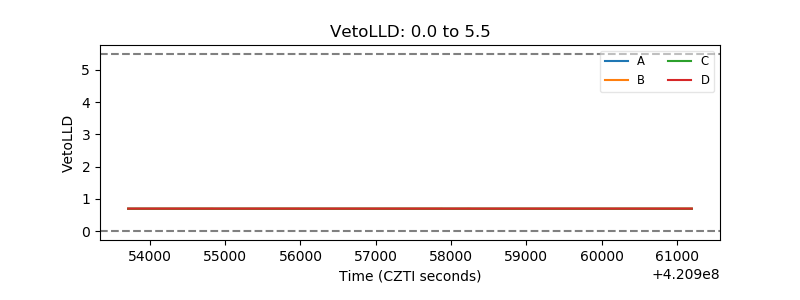 |
| Alpha Counter | 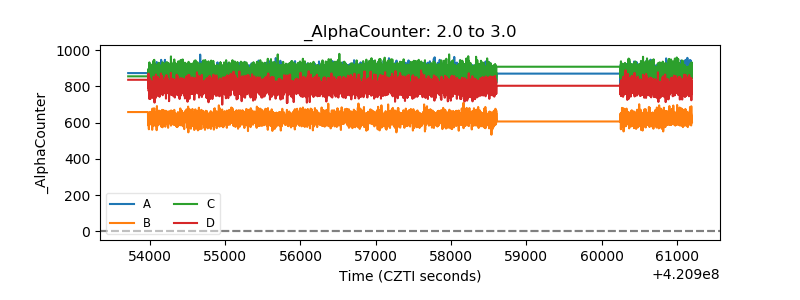 |
| _CPM_Rate | 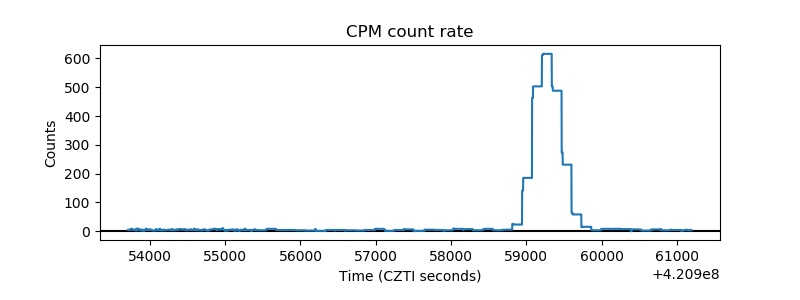 |
| CZT Counter | 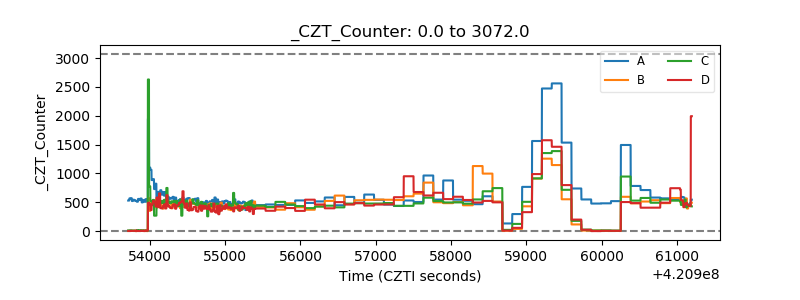 |
| +2.5 Volts monitor | 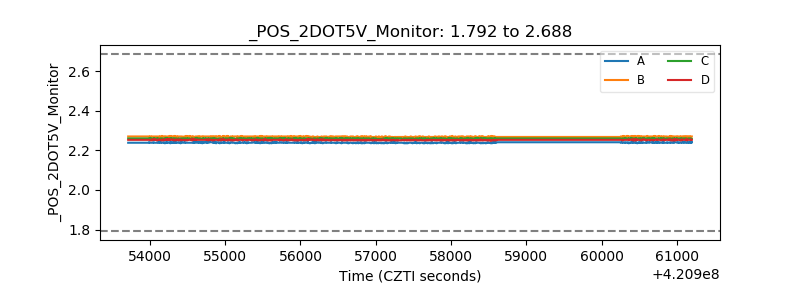 |
| +5 Volts monitor | 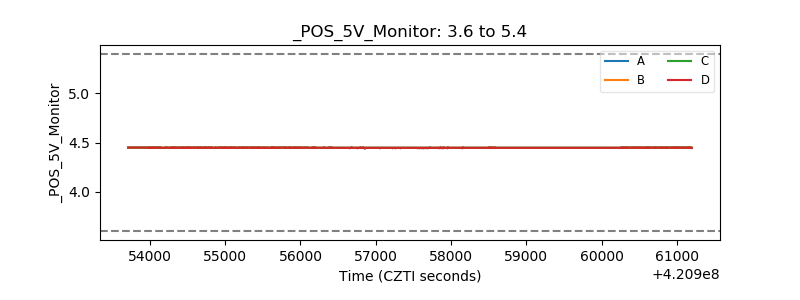 |
| _ROLL_ROT | 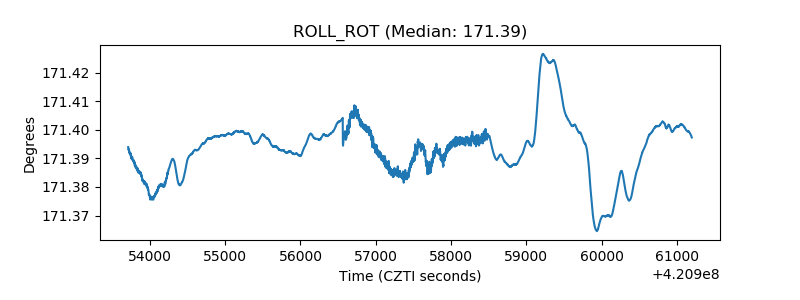 |
| _Roll_DEC | 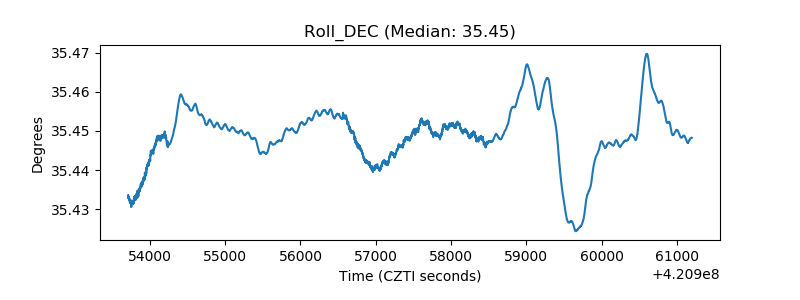 |
| _Roll_RA | 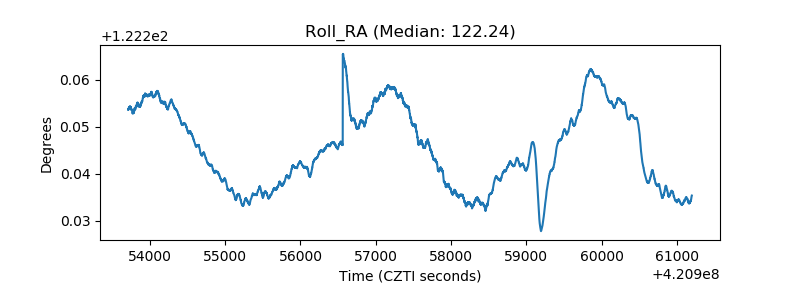 |
| Veto Counter | 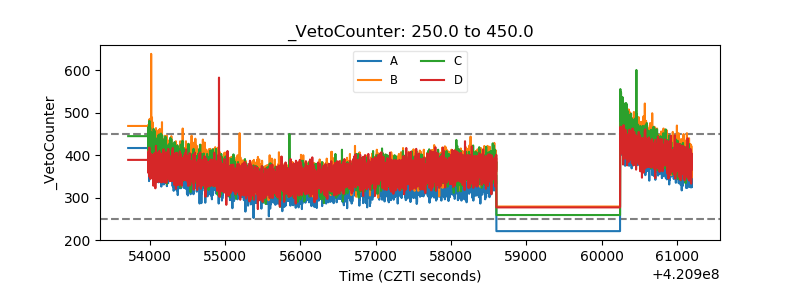 |