| Param | Original file | Final file |
|---|---|---|
| Filename | modeM0/AS1A12_095T02_9000005596_41095cztM0_level2.fits | modeM0/AS1A12_095T02_9000005596_41095cztM0_level2_quad_clean.evt |
| Size (bytes) | 328,864,320 | 93,916,800 |
| Size | 313.6 MB | 89.6 MB |
| Events in quadrant A | 3,057,718 | 635,339 |
| Events in quadrant B | 3,066,399 | 648,948 |
| Events in quadrant C | 2,698,971 | 613,216 |
| Events in quadrant D | 2,924,661 | 564,275 |
| Mode M0 | |||
|---|---|---|---|
| Quadrant | BADHDUFLAG | Total packets | Discarded packets |
| A | 0 | 12265 | 3 |
| B | 0 | 12620 | 2 |
| C | 0 | 11284 | 2 |
| D | 0 | 12356 | 2 |
| Mode SS | |||
|---|---|---|---|
| Quadrant | BADHDUFLAG | Total packets | Discarded packets |
| A | 0 | 112 | 0 |
| B | 0 | 112 | 0 |
| C | 0 | 112 | 0 |
| D | 0 | 112 | 0 |
| Mode M9 | |||
|---|---|---|---|
| Quadrant | BADHDUFLAG | Total packets | Discarded packets |
| A | 0 | 35 | 0 |
| B | 0 | 35 | 0 |
| C | 0 | 35 | 0 |
| D | 0 | 35 | 0 |
| Quadrant | Total seconds | Saturated seconds | Saturation percentage |
|---|---|---|---|
| A | 5465 | 20 | 0.365965% |
| B | 5465 | 82 | 1.500457% |
| C | 5465 | 25 | 0.457457% |
| D | 5465 | 62 | 1.134492% |
Noise dominated data is calculated using 1-second bins in cleaned event files. If a bin has >2000 counts, and if more than 50% of those come from <1% of pixels, then it is considered to be noise-dominated and hence unusable.
| Quadrant | # 1 sec bins | Bins with >0 counts | Bins with >2000 counts | High rate bins dominated by noise | Noise dominated (total time) | Noise dominated (detector-on time) | Marked lightcurve |
|---|---|---|---|---|---|---|---|
| A | 8901 | 5467 | 5 | 5 | 0.06% | 0.09% | 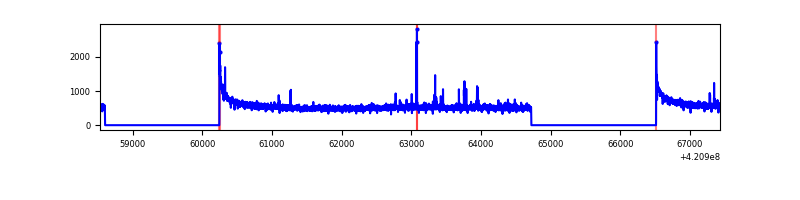 |
| B | 8901 | 5467 | 54 | 54 | 0.61% | 0.99% | 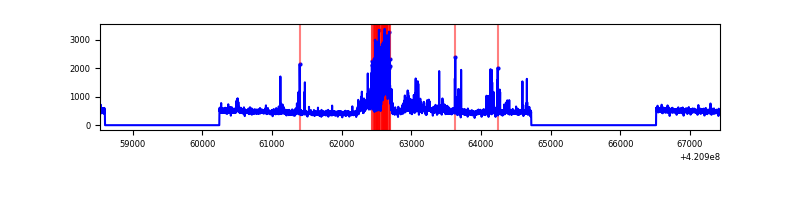 |
| C | 8901 | 5467 | 16 | 16 | 0.18% | 0.29% | 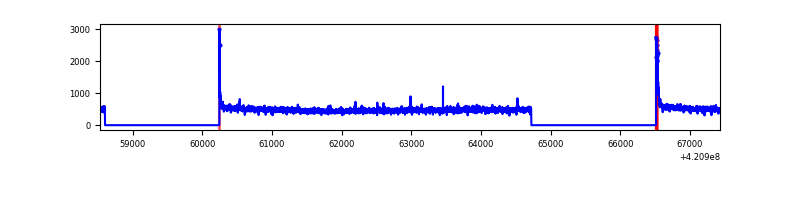 |
| D | 8901 | 5467 | 45 | 45 | 0.51% | 0.82% | 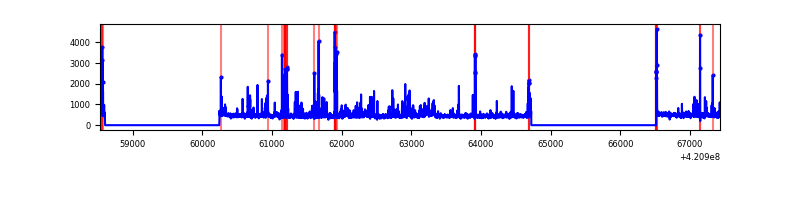 |
Top three noisy pixels from each quadrant. If the there are fewer than three noisy pixels in the level2.evt file, extra rows are filled as -1
| Pixel properties | Quadrant properties | ||||||
|---|---|---|---|---|---|---|---|
| Quadrant | DetID | PixID | Counts | Sigma | Mean | Median | Sigma |
| A | 10 | 83 | 538912 | 4132.4 | 636 | 623 | 130.3 |
| A | 2 | 79 | 40798 | 308.42 | 636 | 623 | 130.3 |
| A | 12 | 189 | 11161 | 80.9 | 636 | 623 | 130.3 |
| B | 0 | 245 | 309313 | 2552.51 | 625 | 608 | 120.9 |
| B | 0 | 186 | 191351 | 1577.15 | 625 | 608 | 120.9 |
| B | 5 | 255 | 55946 | 457.56 | 625 | 608 | 120.9 |
| C | 15 | 214 | 235307 | 1646.08 | 611 | 617 | 142.6 |
| C | 0 | 10 | 70801 | 492.26 | 611 | 617 | 142.6 |
| C | 14 | 254 | 8927 | 58.28 | 611 | 617 | 142.6 |
| D | 13 | 249 | 171089 | 1142.36 | 612 | 596 | 149.2 |
| D | 2 | 249 | 168684 | 1126.24 | 612 | 596 | 149.2 |
| D | 12 | 233 | 90035 | 599.27 | 612 | 596 | 149.2 |
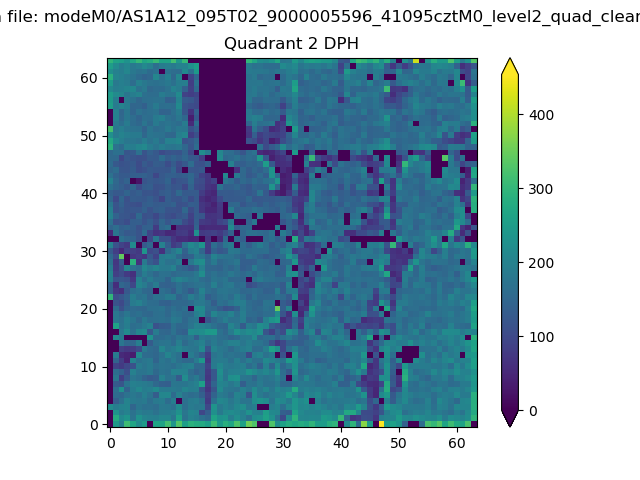
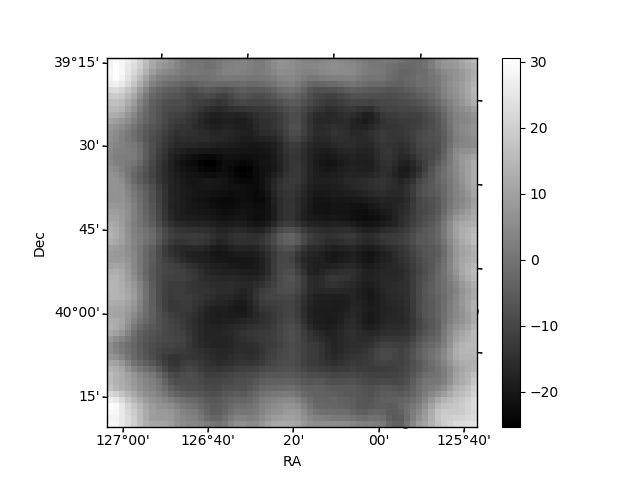
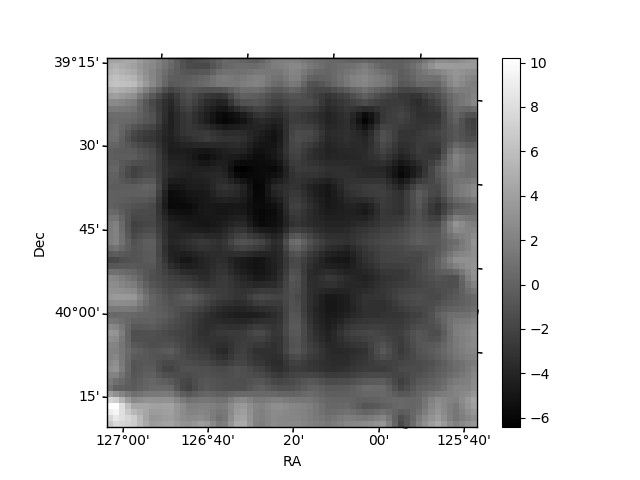
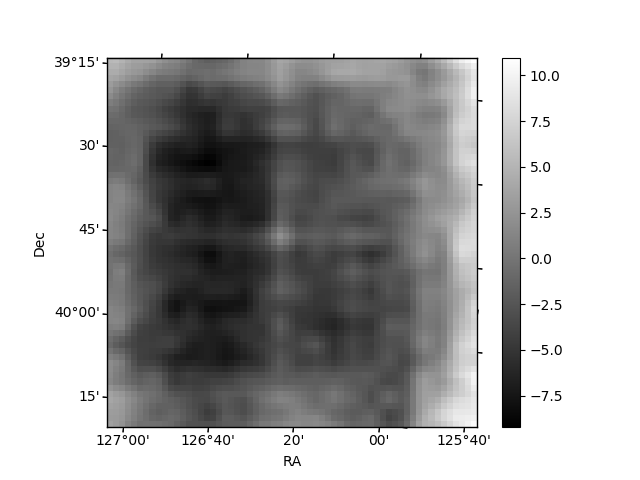
Histogram calculated using DETX and DETY for each event in the final _common_clean file
| Quadrant A | 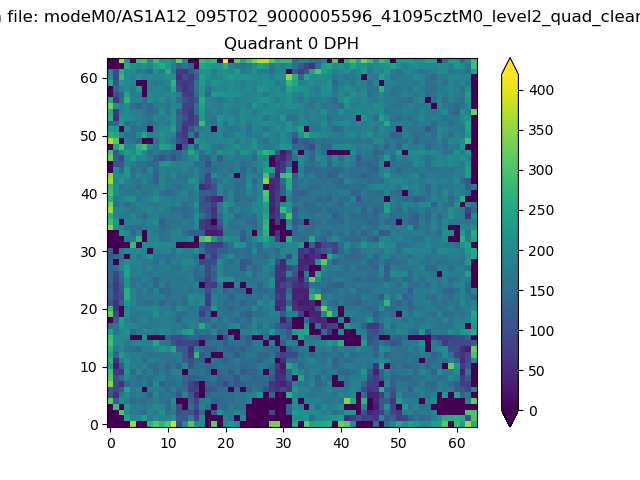 |
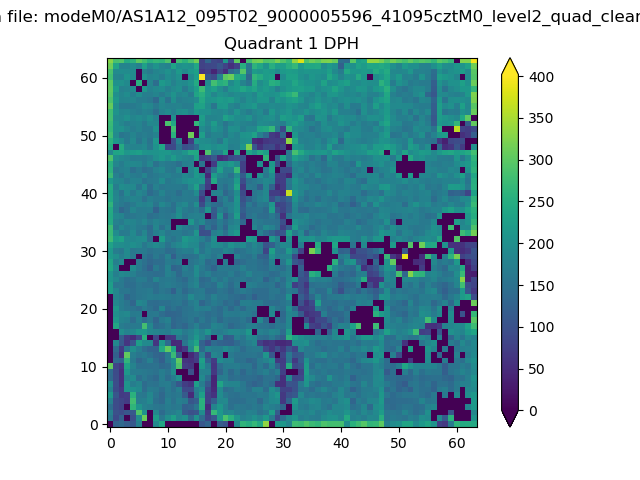 |
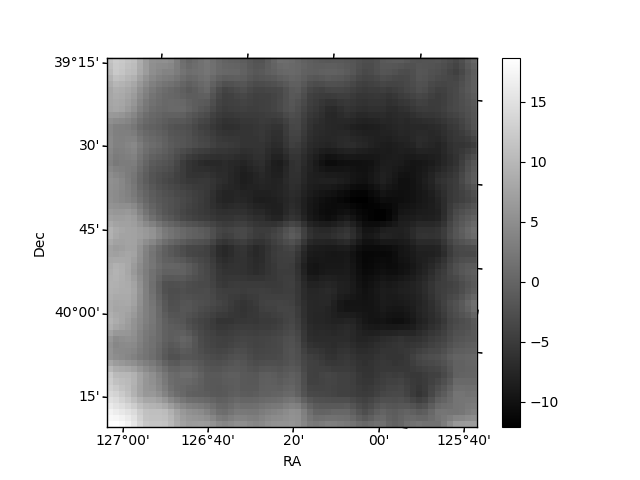
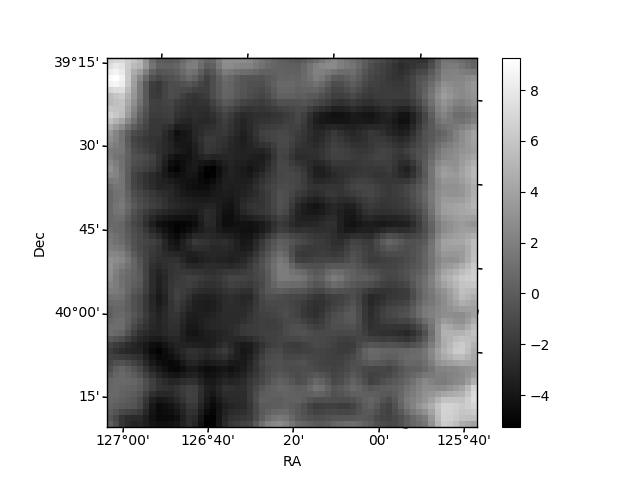
Quadrant B |
|---|---|---|---|
| Quadrant D | 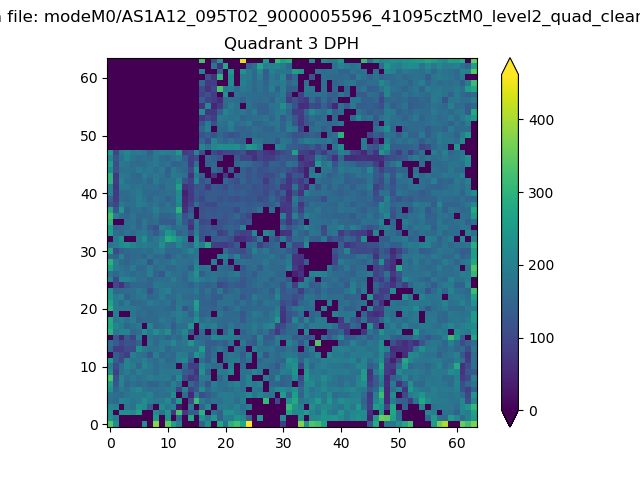 |
 |
Quadrant C |
| Plot type | Count rate plots | Images |
|---|---|---|
| Comparison with Poisson distribution Blue bars denote a histogram of data divided into 1 sec bins. Red curve is a Poisson curve with rate = median count rate of data. |
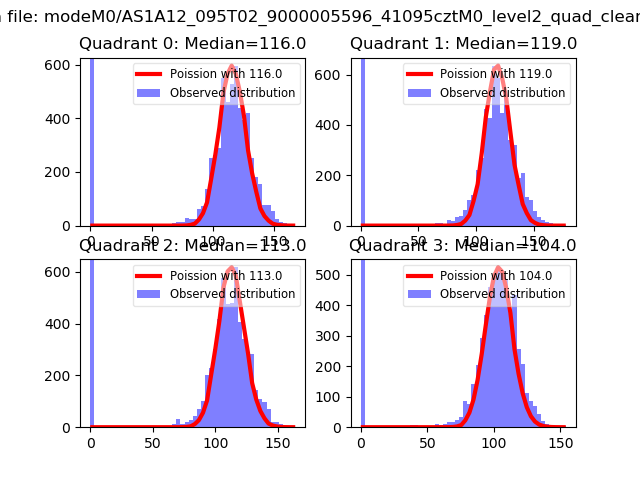 |
 |
| Quadrant-wise count rates Data is divided into 100 sec bins |
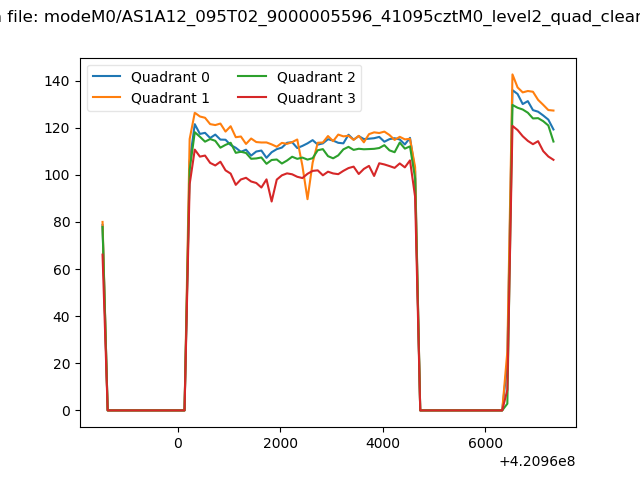 |
|
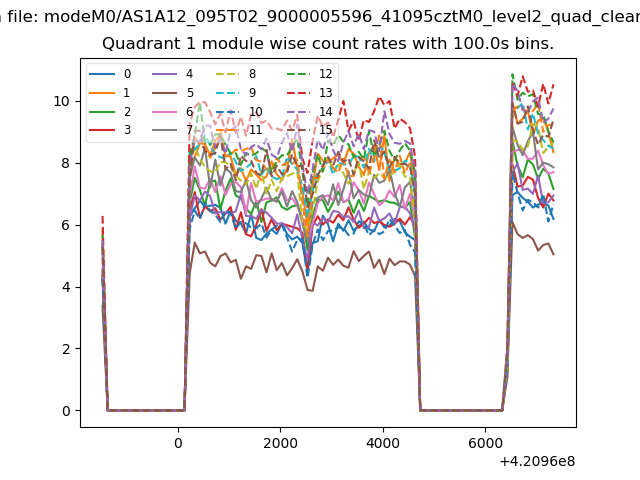
| Module-wise count rates for Quadrant A Data is divided into 100 sec bins |
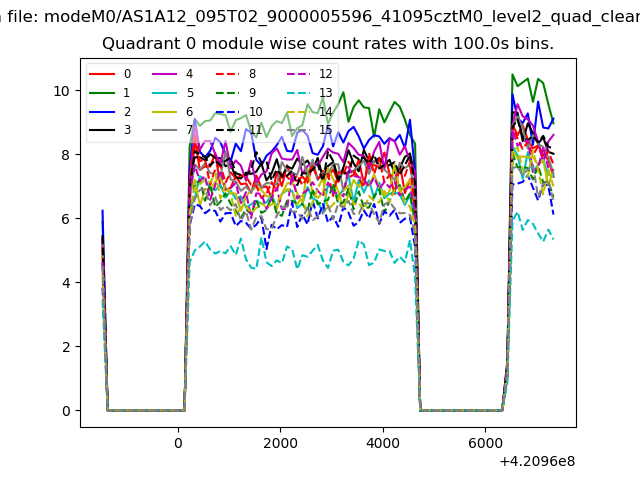 |
 |
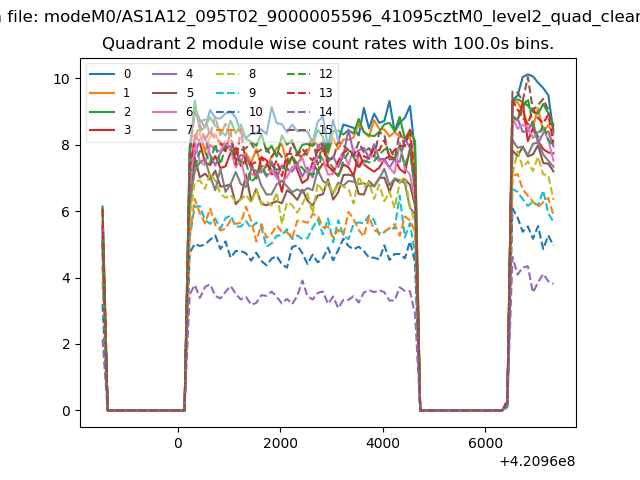
| Module-wise count rates for Quadrant B Data is divided into 100 sec bins |
 |
 |
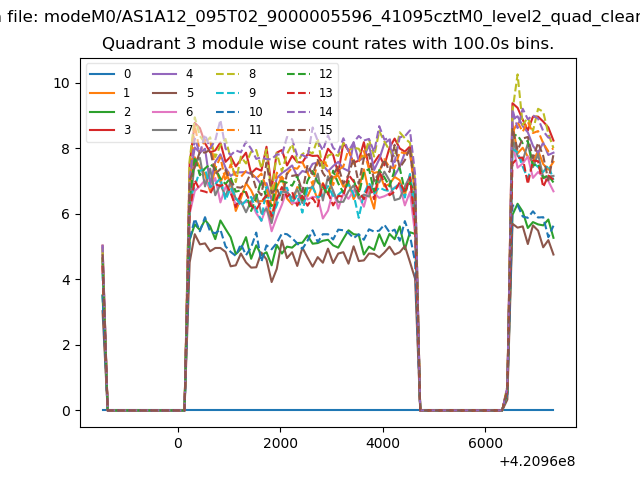
| Module-wise count rates for Quadrant C Data is divided into 100 sec bins |
 |
 |
| Module-wise count rates for Quadrant D Data is divided into 100 sec bins |
 |
 |
| Parameter | Plot |
|---|---|
| CZT HV Monitor | 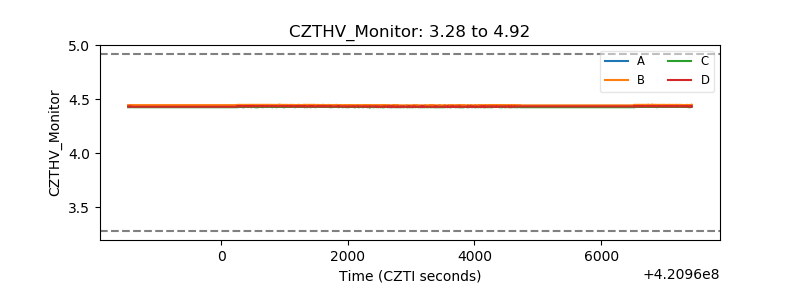 |
| D_VDD | 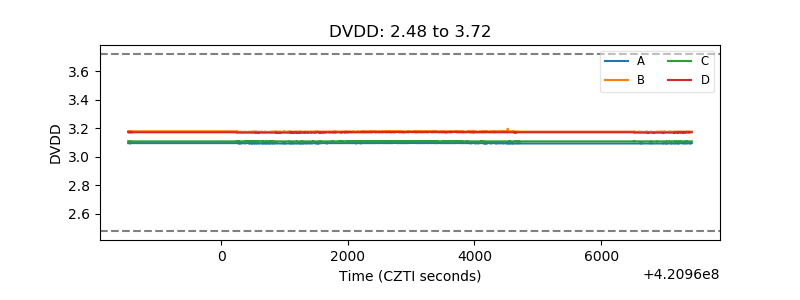 |
| Temperature 1 | 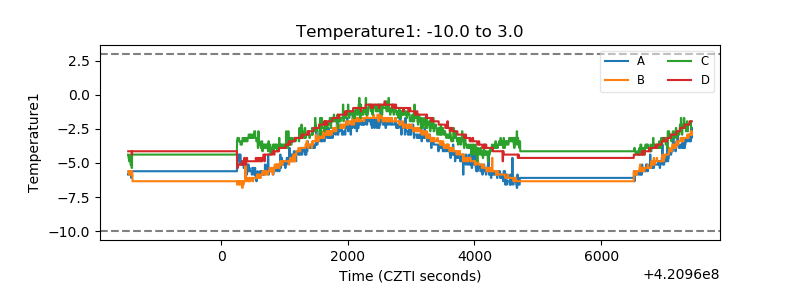 |
| Veto HV Monitor | 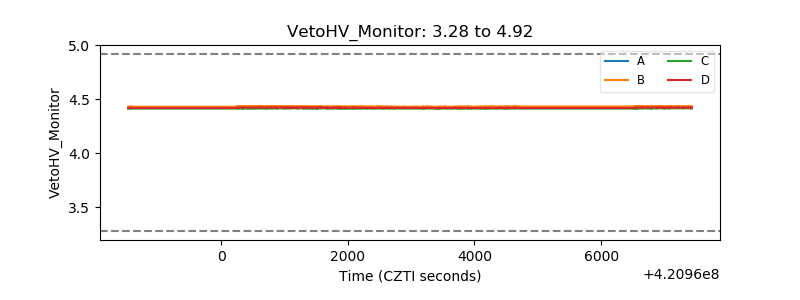 |
| Veto LLD | 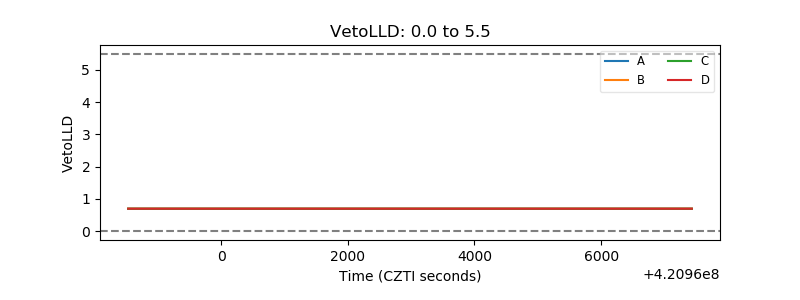 |
| Alpha Counter | 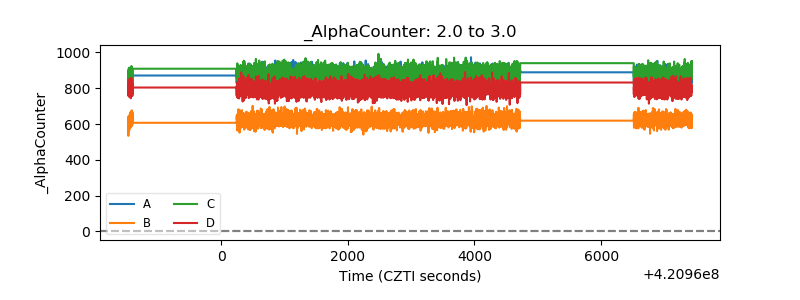 |
| _CPM_Rate | 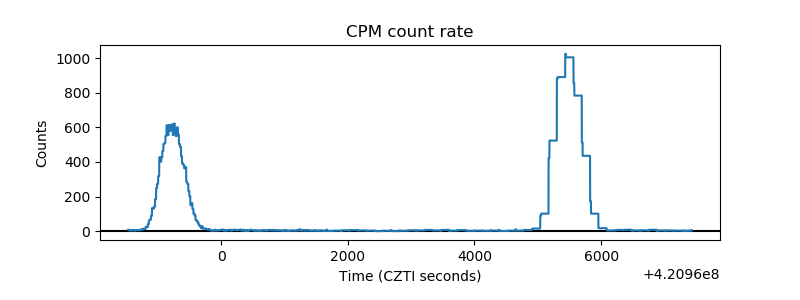 |
| CZT Counter | 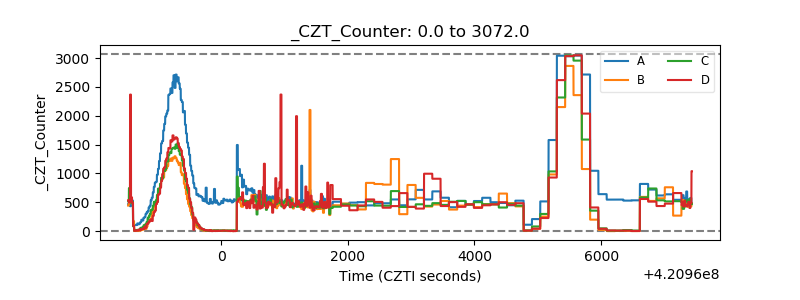 |
| +2.5 Volts monitor | 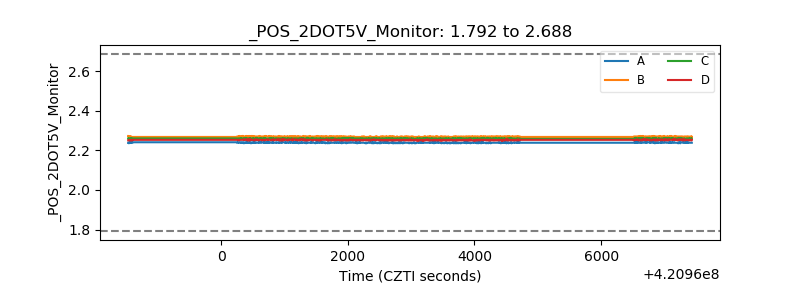 |
| +5 Volts monitor | 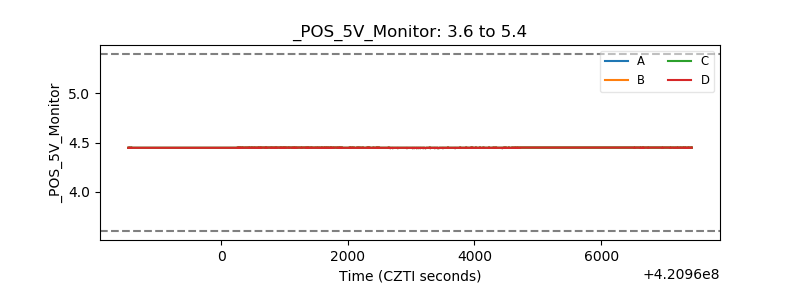 |
| _ROLL_ROT | 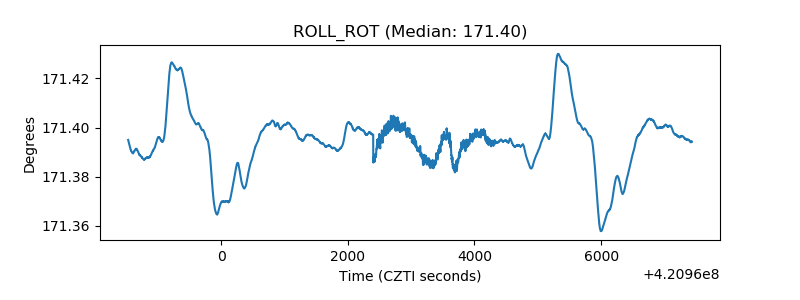 |
| _Roll_DEC | 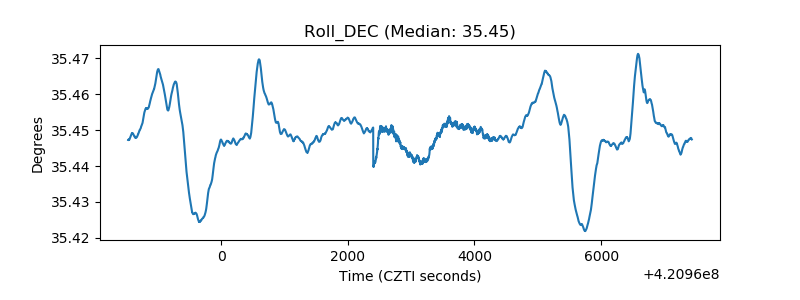 |
| _Roll_RA | 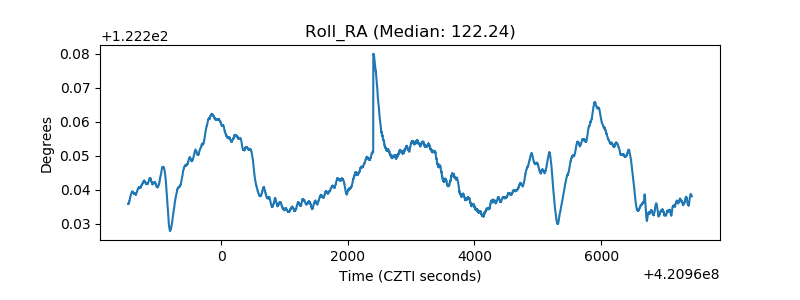 |
| Veto Counter | 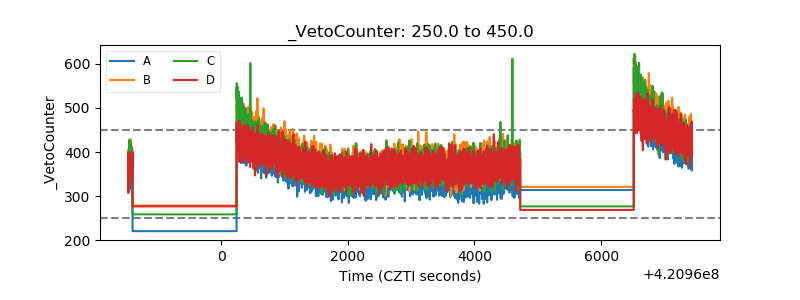 |