| Param | Original file | Final file |
|---|---|---|
| Filename | modeM0/AS1A12_032T01_9000005598_41096cztM0_level2.fits | modeM0/AS1A12_032T01_9000005598_41096cztM0_level2_quad_clean.evt |
| Size (bytes) | 60,471,360 | 18,803,520 |
| Size | 57.7 MB | 17.9 MB |
| Events in quadrant A | 639,354 | 129,010 |
| Events in quadrant B | 467,522 | 131,286 |
| Events in quadrant C | 516,324 | 122,456 |
| Events in quadrant D | 538,817 | 113,887 |
| Mode M9 | |||
|---|---|---|---|
| Quadrant | BADHDUFLAG | Total packets | Discarded packets |
| A | 0 | 13 | 0 |
| B | 0 | 13 | 0 |
| C | 0 | 13 | 0 |
| D | 0 | 13 | 0 |
| Mode SS | |||
|---|---|---|---|
| Quadrant | BADHDUFLAG | Total packets | Discarded packets |
| A | 0 | 20 | 0 |
| B | 0 | 20 | 0 |
| C | 0 | 20 | 0 |
| D | 0 | 20 | 0 |
| Mode M0 | |||
|---|---|---|---|
| Quadrant | BADHDUFLAG | Total packets | Discarded packets |
| A | 0 | 2573 | 2 |
| B | 0 | 1897 | 1 |
| C | 0 | 2018 | 1 |
| D | 0 | 2166 | 1 |
| Quadrant | Total seconds | Saturated seconds | Saturation percentage |
|---|---|---|---|
| A | 940 | 4 | 0.425532% |
| B | 940 | 1 | 0.106383% |
| C | 940 | 6 | 0.638298% |
| D | 940 | 2 | 0.212766% |
Noise dominated data is calculated using 1-second bins in cleaned event files. If a bin has >2000 counts, and if more than 50% of those come from <1% of pixels, then it is considered to be noise-dominated and hence unusable.
| Quadrant | # 1 sec bins | Bins with >0 counts | Bins with >2000 counts | High rate bins dominated by noise | Noise dominated (total time) | Noise dominated (detector-on time) | Marked lightcurve |
|---|---|---|---|---|---|---|---|
| A | 940 | 940 | 2 | 2 | 0.21% | 0.21% | 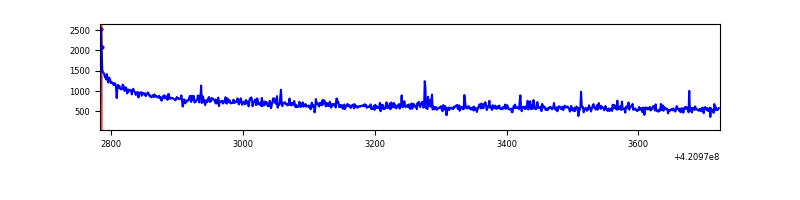 |
| B | 940 | 940 | 0 | 0 | 0.00% | 0.00% | 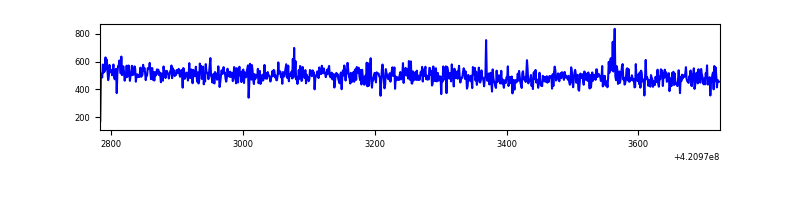 |
| C | 940 | 940 | 2 | 2 | 0.21% | 0.21% | 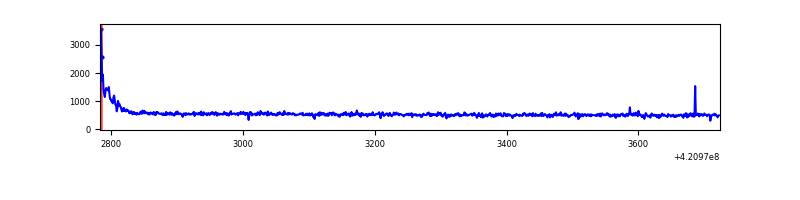 |
| D | 940 | 940 | 1 | 1 | 0.11% | 0.11% | 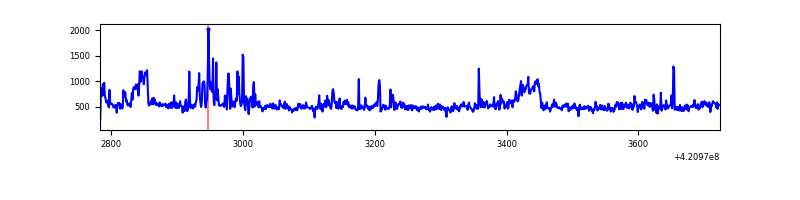 |
Top three noisy pixels from each quadrant. If the there are fewer than three noisy pixels in the level2.evt file, extra rows are filled as -1
| Pixel properties | Quadrant properties | ||||||
|---|---|---|---|---|---|---|---|
| Quadrant | DetID | PixID | Counts | Sigma | Mean | Median | Sigma |
| A | 10 | 83 | 149437 | 5678.32 | 121 | 119 | 26.3 |
| A | 2 | 79 | 19687 | 744.14 | 121 | 119 | 26.3 |
| A | 13 | 254 | 1589 | 55.9 | 121 | 119 | 26.3 |
| B | 12 | 111 | 2754 | 107.08 | 118 | 116 | 24.6 |
| B | 11 | 111 | 2547 | 98.67 | 118 | 116 | 24.6 |
| B | 14 | 111 | 2431 | 93.97 | 118 | 116 | 24.6 |
| C | 15 | 214 | 44615 | 1574.26 | 113 | 114 | 28.3 |
| C | 0 | 10 | 26425 | 930.77 | 113 | 114 | 28.3 |
| C | 12 | 249 | 1295 | 41.78 | 113 | 114 | 28.3 |
| D | 2 | 249 | 42916 | 1443.57 | 116 | 113 | 29.7 |
| D | 13 | 249 | 36661 | 1232.62 | 116 | 113 | 29.7 |
| D | 1 | 52 | 8033 | 267.11 | 116 | 113 | 29.7 |
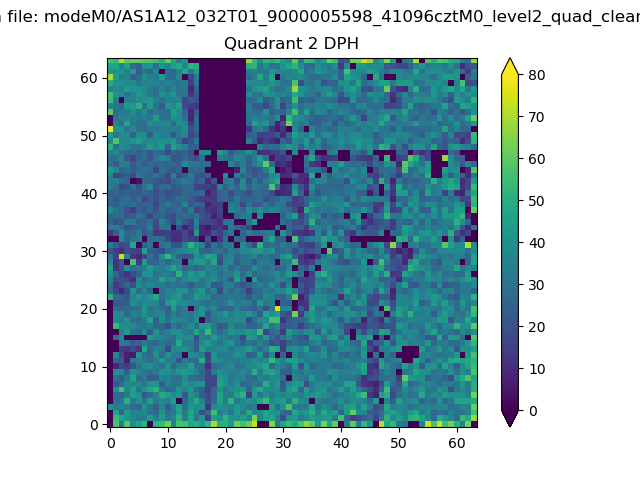
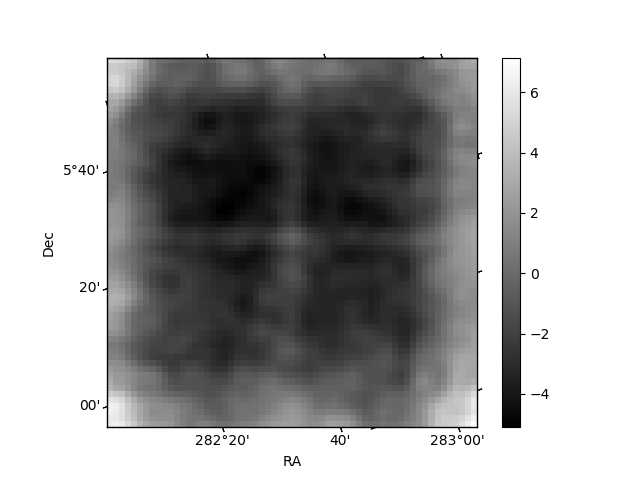
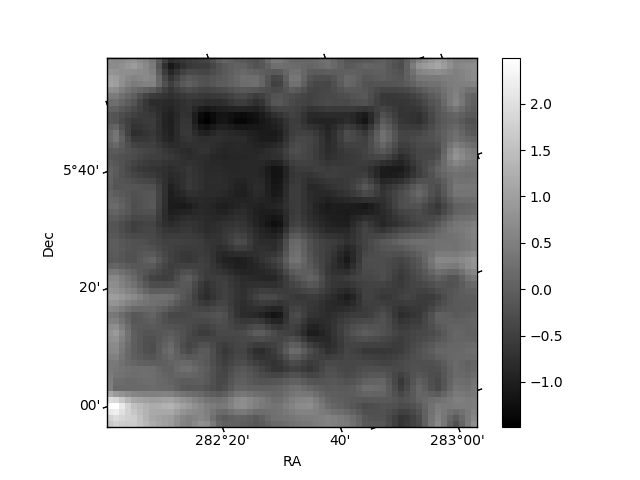
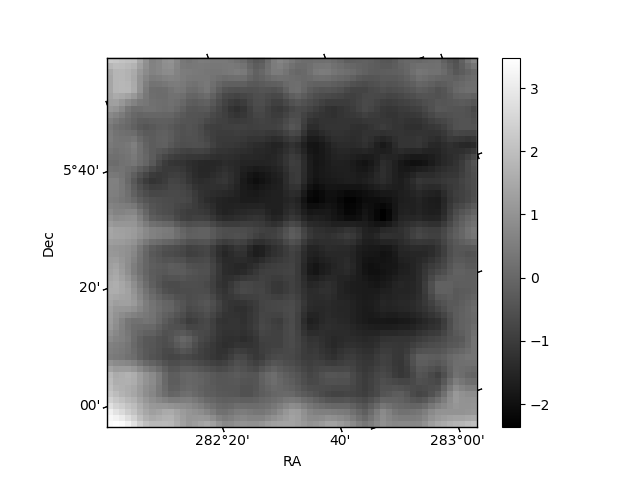
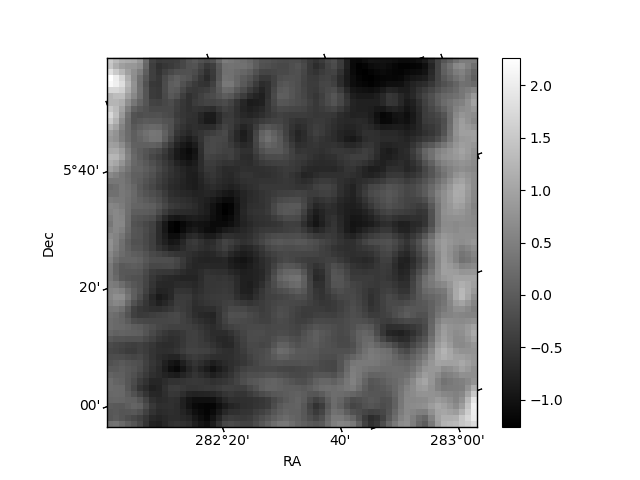
Histogram calculated using DETX and DETY for each event in the final _common_clean file
| Quadrant A | 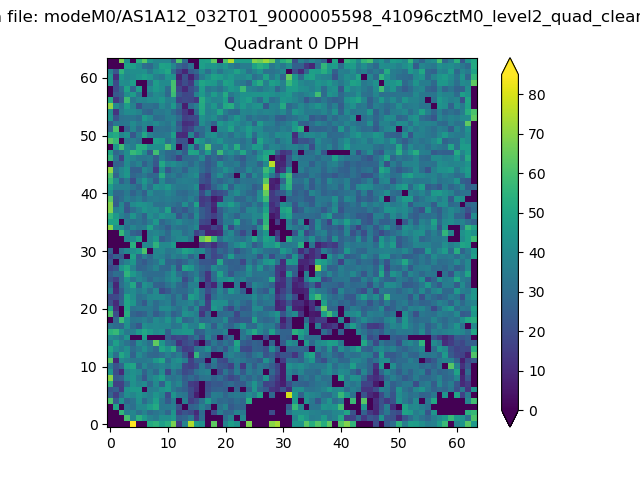 |
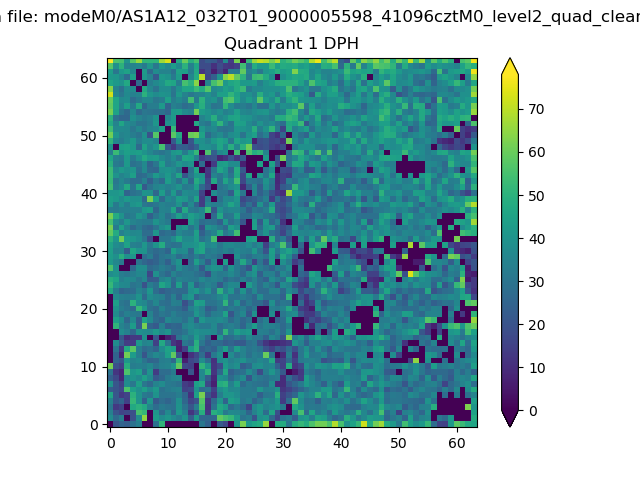 |
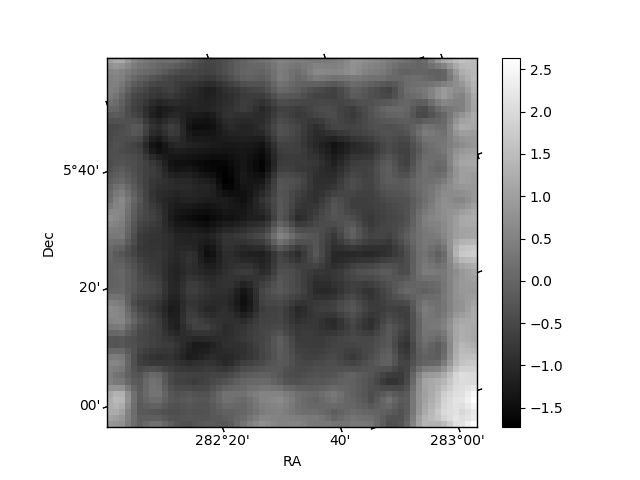
Quadrant B |
|---|---|---|---|
| Quadrant D | 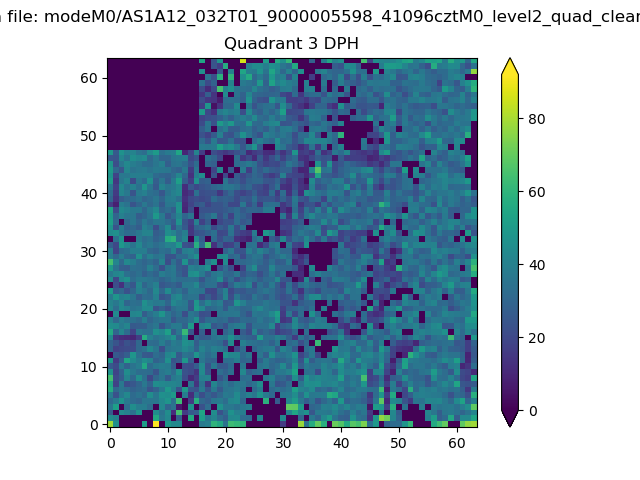 |
 |
Quadrant C |
| Plot type | Count rate plots | Images |
|---|---|---|
| Comparison with Poisson distribution Blue bars denote a histogram of data divided into 1 sec bins. Red curve is a Poisson curve with rate = median count rate of data. |
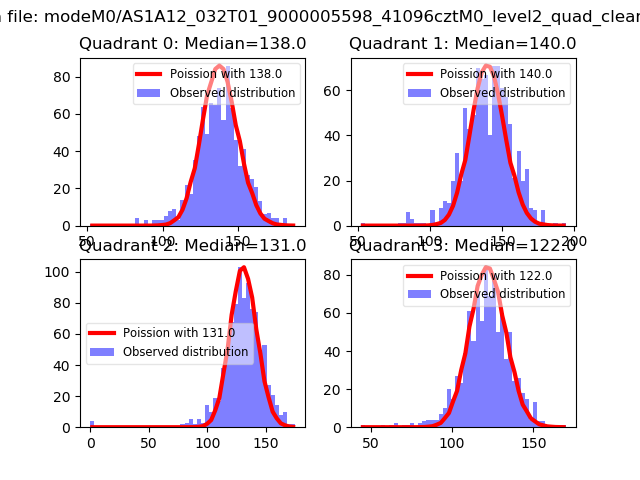 |
 |
| Quadrant-wise count rates Data is divided into 100 sec bins |
 |
|
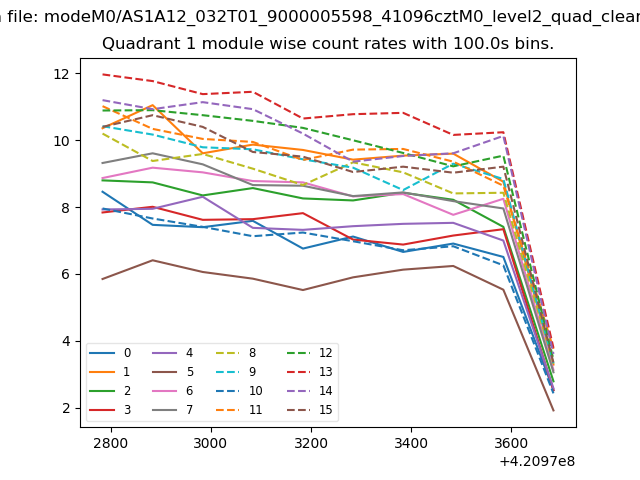
| Module-wise count rates for Quadrant A Data is divided into 100 sec bins |
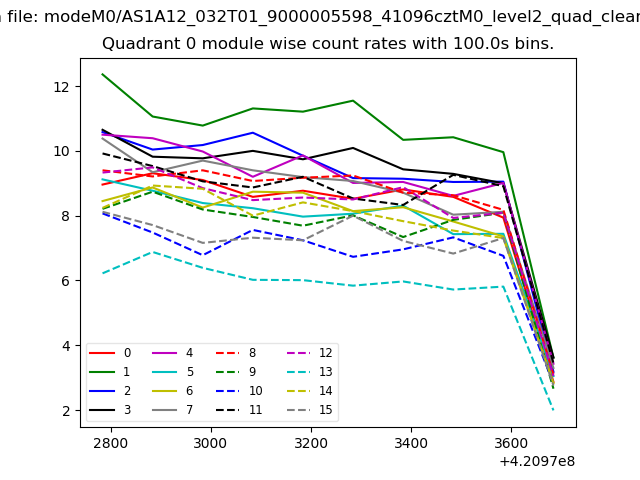 |
 |
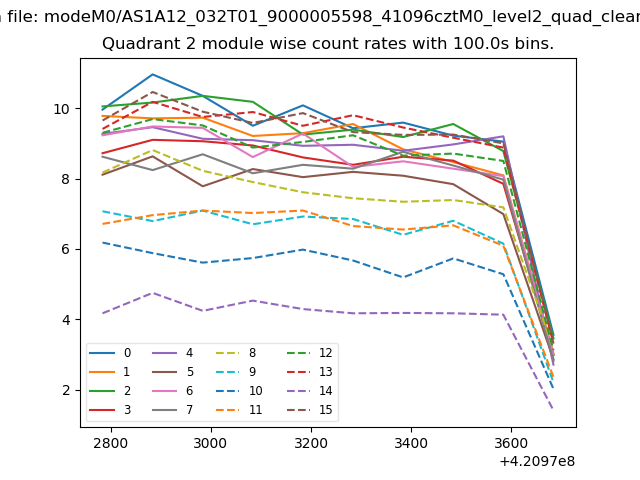
| Module-wise count rates for Quadrant B Data is divided into 100 sec bins |
 |
 |
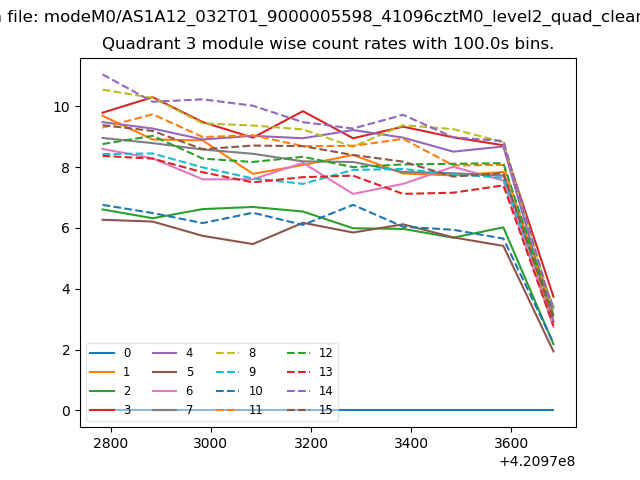
| Module-wise count rates for Quadrant C Data is divided into 100 sec bins |
 |
 |
| Module-wise count rates for Quadrant D Data is divided into 100 sec bins |
 |
 |
| Parameter | Plot |
|---|---|
| CZT HV Monitor | 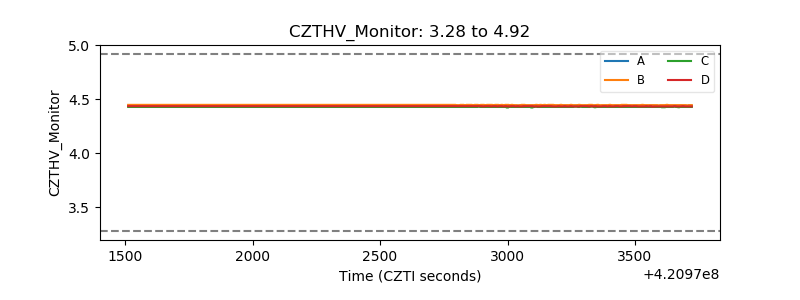 |
| D_VDD | 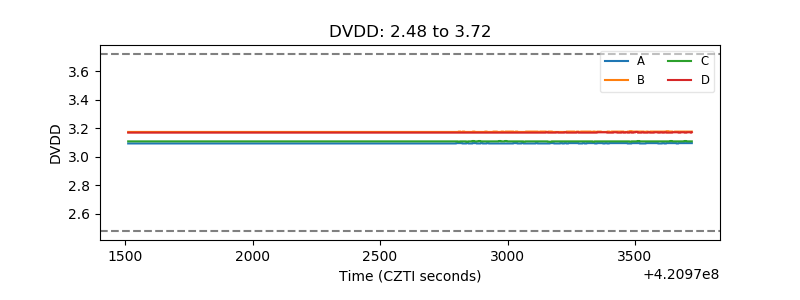 |
| Temperature 1 | 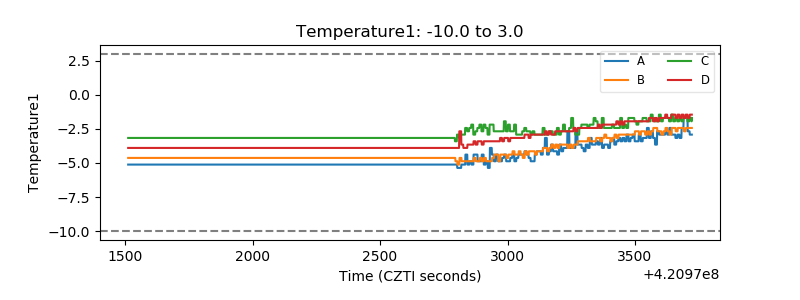 |
| Veto HV Monitor | 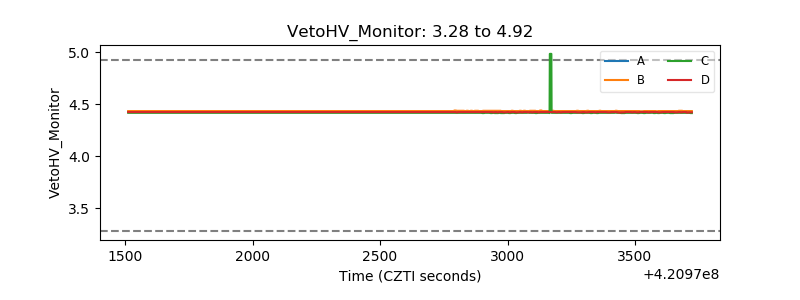 |
| Veto LLD | 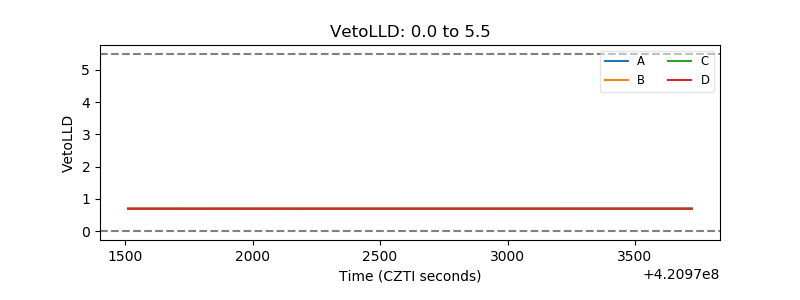 |
| Alpha Counter | 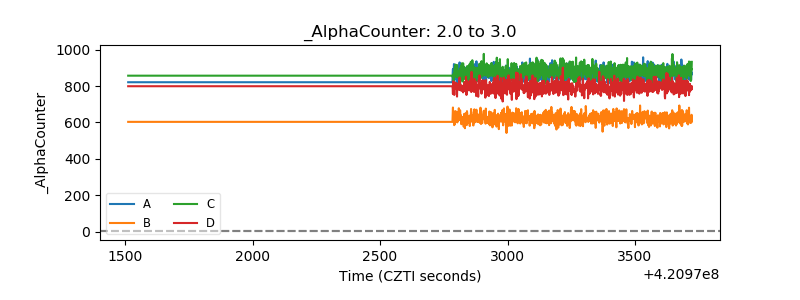 |
| _CPM_Rate | 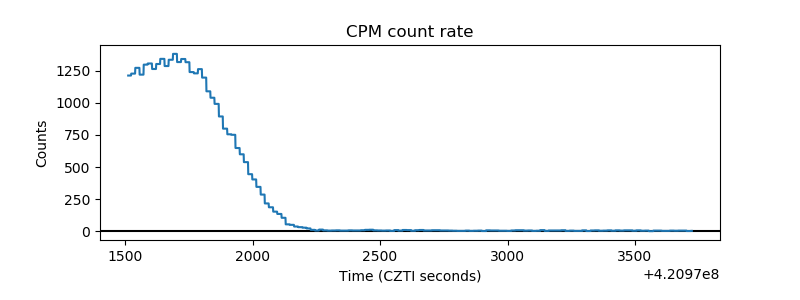 |
| CZT Counter | 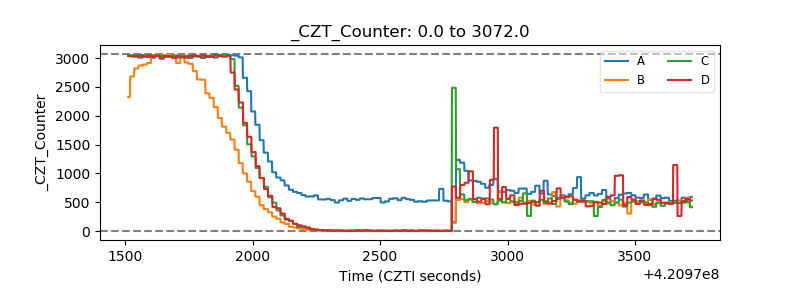 |
| +2.5 Volts monitor |  |
| +5 Volts monitor | 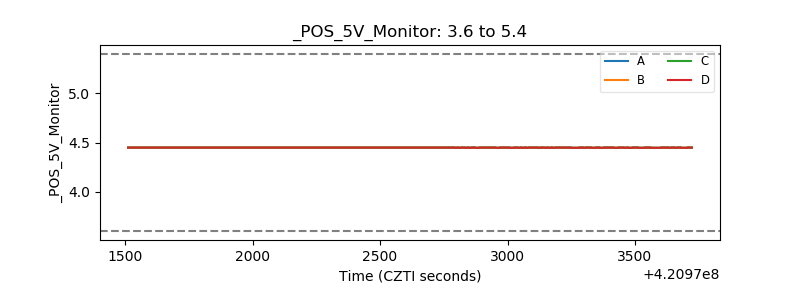 |
| _ROLL_ROT | 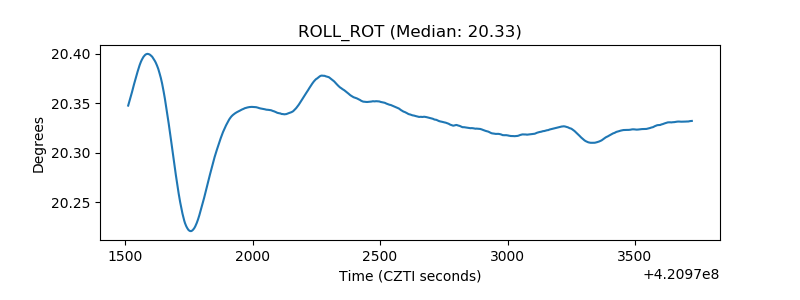 |
| _Roll_DEC | 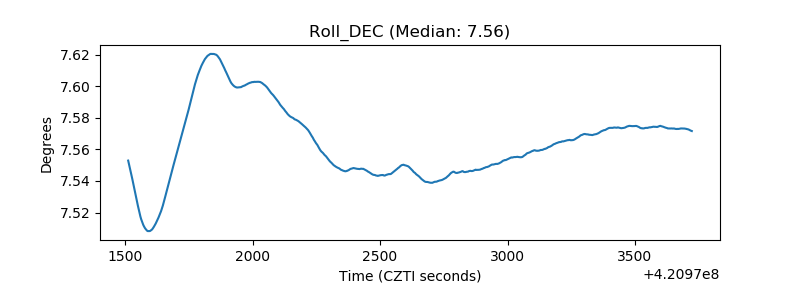 |
| _Roll_RA | 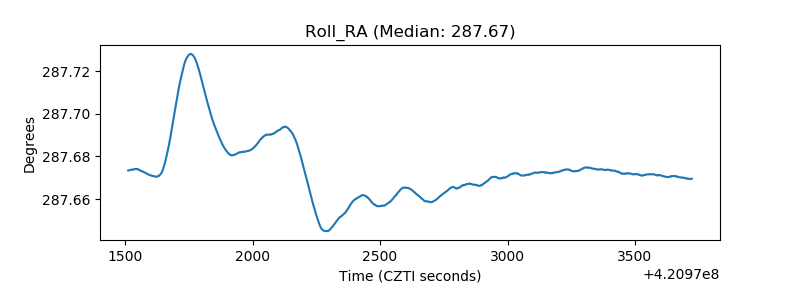 |
| Veto Counter | 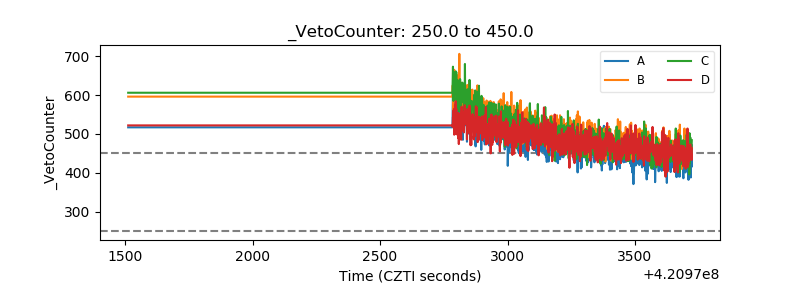 |