| Param | Original file | Final file |
|---|---|---|
| Filename | modeM0/AS1A12_032T01_9000005598_41097cztM0_level2.fits | modeM0/AS1A12_032T01_9000005598_41097cztM0_level2_quad_clean.evt |
| Size (bytes) | 329,016,960 | 97,079,040 |
| Size | 313.8 MB | 92.6 MB |
| Events in quadrant A | 3,091,153 | 671,182 |
| Events in quadrant B | 3,027,284 | 675,473 |
| Events in quadrant C | 2,732,776 | 638,750 |
| Events in quadrant D | 2,922,477 | 589,315 |
| Mode M9 | |||
|---|---|---|---|
| Quadrant | BADHDUFLAG | Total packets | Discarded packets |
| A | 0 | 20 | 0 |
| B | 0 | 20 | 0 |
| C | 0 | 20 | 0 |
| D | 0 | 20 | 0 |
| Mode SS | |||
|---|---|---|---|
| Quadrant | BADHDUFLAG | Total packets | Discarded packets |
| A | 0 | 108 | 0 |
| B | 0 | 108 | 0 |
| C | 0 | 108 | 0 |
| D | 0 | 108 | 0 |
| Mode M0 | |||
|---|---|---|---|
| Quadrant | BADHDUFLAG | Total packets | Discarded packets |
| A | 0 | 12208 | 3 |
| B | 0 | 11984 | 2 |
| C | 0 | 10891 | 2 |
| D | 0 | 11844 | 2 |
| Quadrant | Total seconds | Saturated seconds | Saturation percentage |
|---|---|---|---|
| A | 5207 | 11 | 0.211254% |
| B | 5207 | 96 | 1.843672% |
| C | 5207 | 16 | 0.307279% |
| D | 5208 | 72 | 1.382488% |
Noise dominated data is calculated using 1-second bins in cleaned event files. If a bin has >2000 counts, and if more than 50% of those come from <1% of pixels, then it is considered to be noise-dominated and hence unusable.
| Quadrant | # 1 sec bins | Bins with >0 counts | Bins with >2000 counts | High rate bins dominated by noise | Noise dominated (total time) | Noise dominated (detector-on time) | Marked lightcurve |
|---|---|---|---|---|---|---|---|
| A | 7239 | 5208 | 4 | 4 | 0.06% | 0.08% | 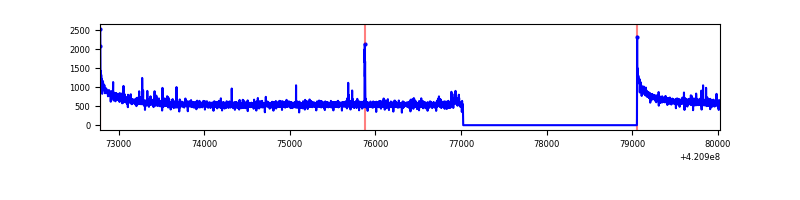 |
| B | 7239 | 5208 | 68 | 68 | 0.94% | 1.31% | 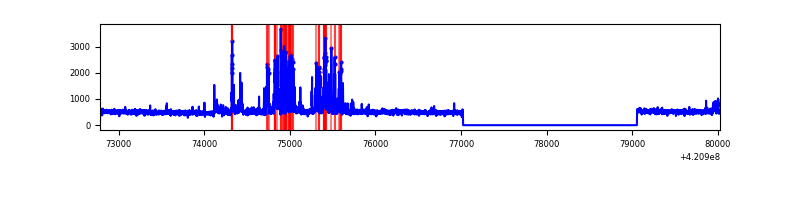 |
| C | 7239 | 5208 | 10 | 10 | 0.14% | 0.19% | 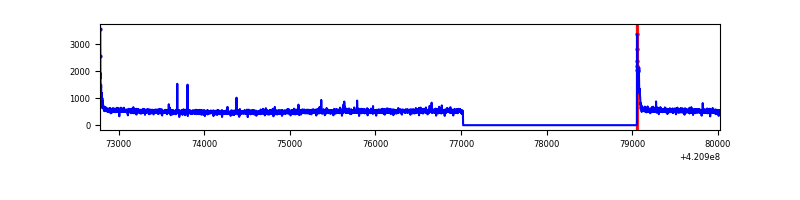 |
| D | 7240 | 5209 | 50 | 50 | 0.69% | 0.96% | 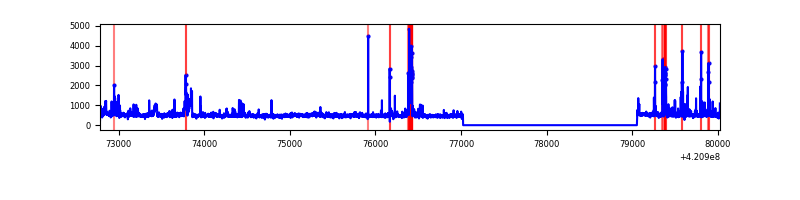 |
Top three noisy pixels from each quadrant. If the there are fewer than three noisy pixels in the level2.evt file, extra rows are filled as -1
| Pixel properties | Quadrant properties | ||||||
|---|---|---|---|---|---|---|---|
| Quadrant | DetID | PixID | Counts | Sigma | Mean | Median | Sigma |
| A | 10 | 83 | 514807 | 3886.44 | 650 | 639 | 132.3 |
| A | 2 | 79 | 40144 | 298.61 | 650 | 639 | 132.3 |
| A | 14 | 235 | 16948 | 123.27 | 650 | 639 | 132.3 |
| B | 0 | 245 | 382071 | 3113.41 | 638 | 621 | 122.5 |
| B | 0 | 186 | 111223 | 902.74 | 638 | 621 | 122.5 |
| B | 5 | 255 | 24226 | 192.67 | 638 | 621 | 122.5 |
| C | 15 | 214 | 222551 | 1542.44 | 621 | 626 | 143.9 |
| C | 0 | 10 | 77151 | 531.87 | 621 | 626 | 143.9 |
| C | 14 | 254 | 8029 | 51.45 | 621 | 626 | 143.9 |
| D | 13 | 249 | 219559 | 1432.01 | 625 | 607 | 152.9 |
| D | 2 | 249 | 152170 | 991.27 | 625 | 607 | 152.9 |
| D | 1 | 52 | 89976 | 584.5 | 625 | 607 | 152.9 |
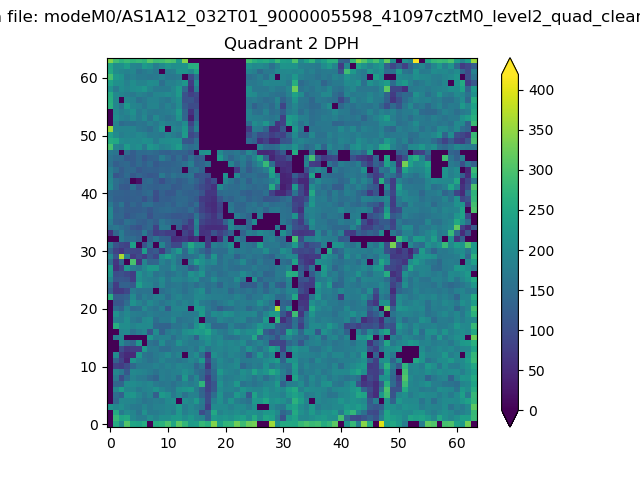
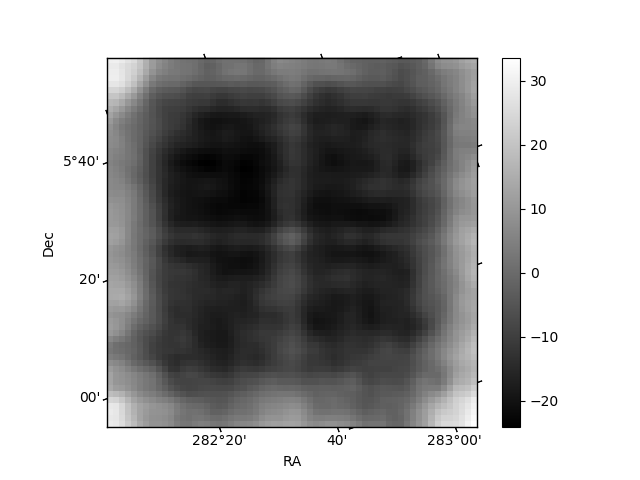
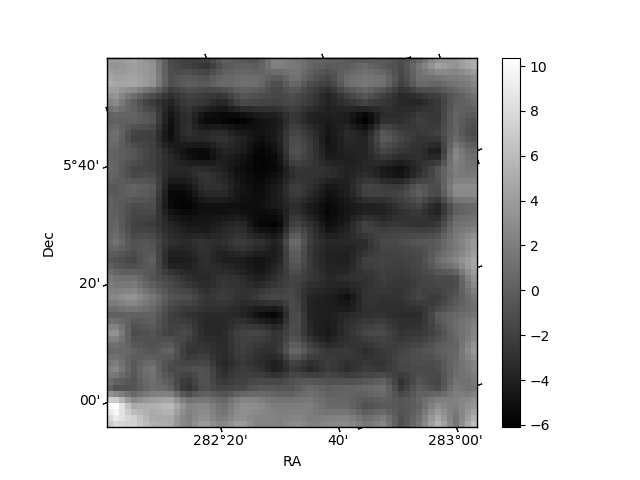
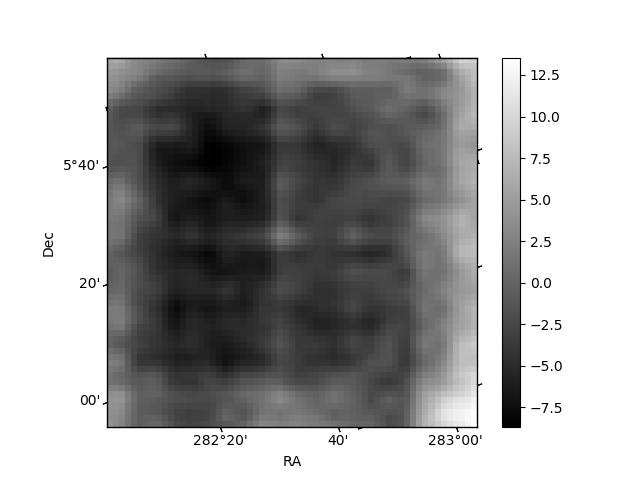
Histogram calculated using DETX and DETY for each event in the final _common_clean file
| Quadrant A | 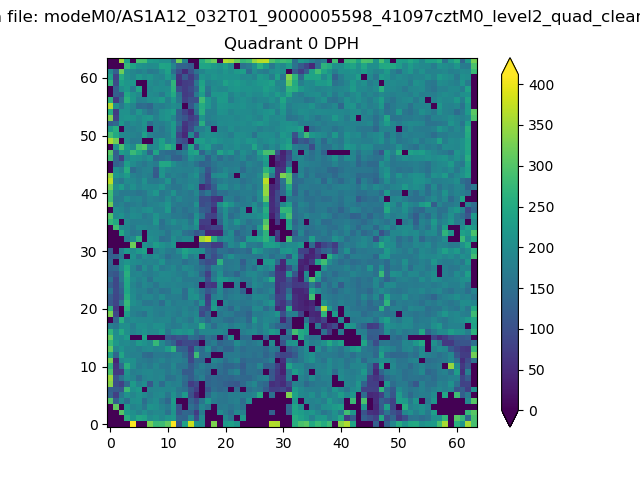 |
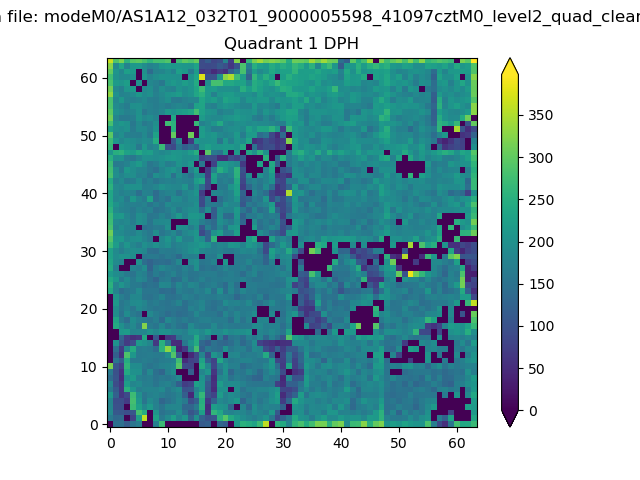 |
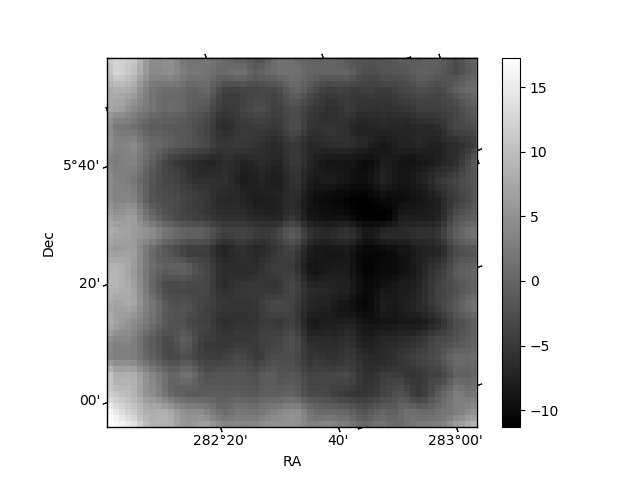
Quadrant B |
|---|---|---|---|
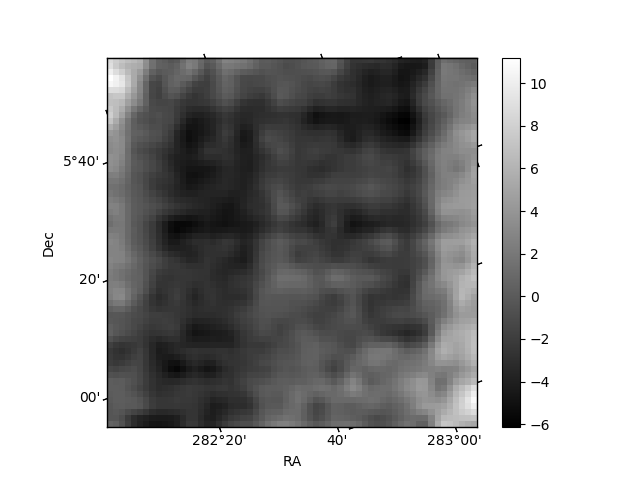
| Quadrant D | 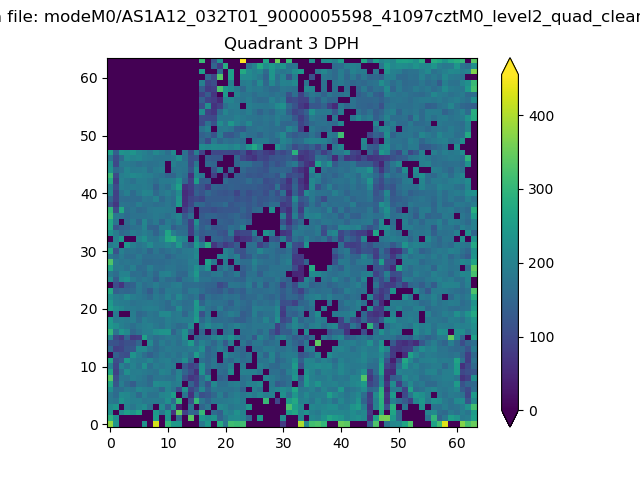 |
 |
Quadrant C |
| Plot type | Count rate plots | Images |
|---|---|---|
| Comparison with Poisson distribution Blue bars denote a histogram of data divided into 1 sec bins. Red curve is a Poisson curve with rate = median count rate of data. |
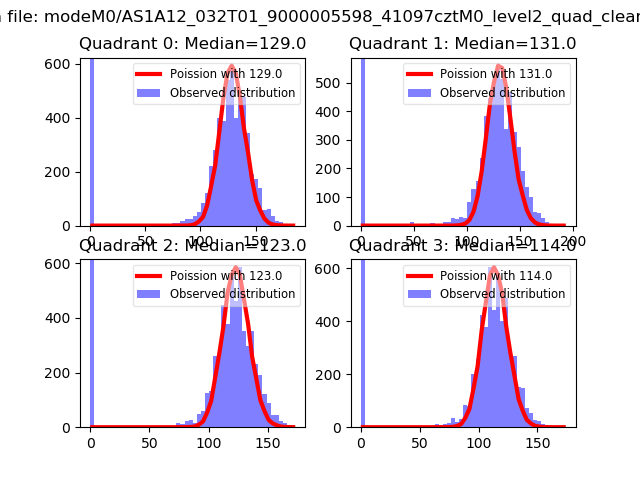 |
 |
| Quadrant-wise count rates Data is divided into 100 sec bins |
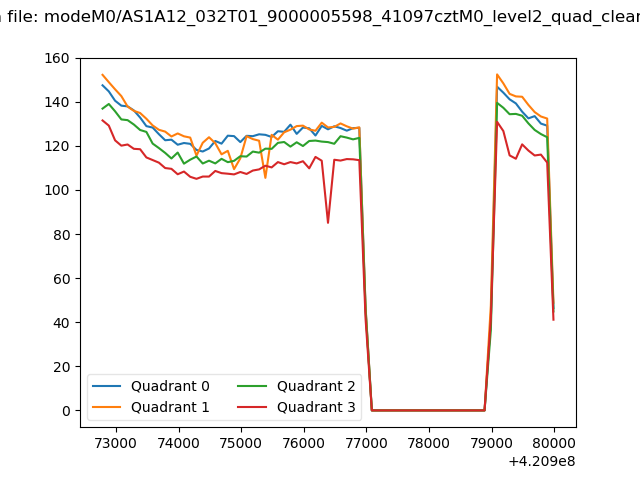 |
|
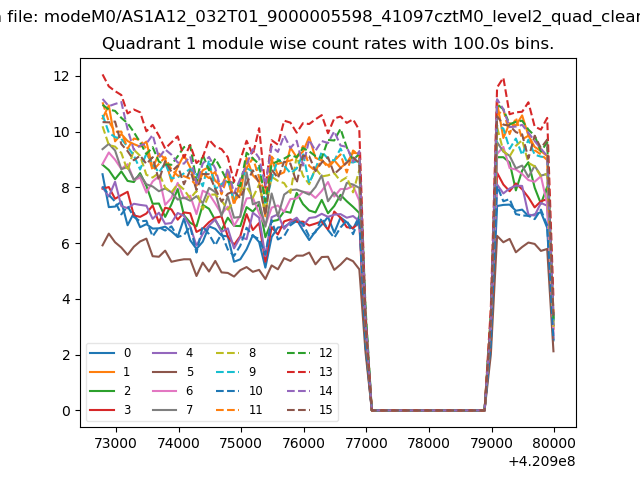
| Module-wise count rates for Quadrant A Data is divided into 100 sec bins |
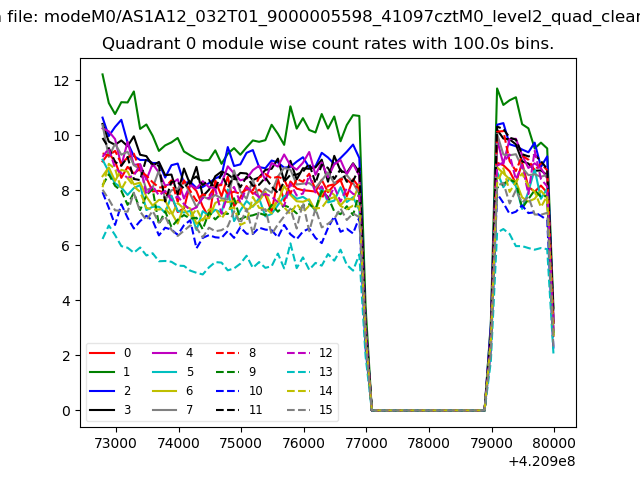 |
 |
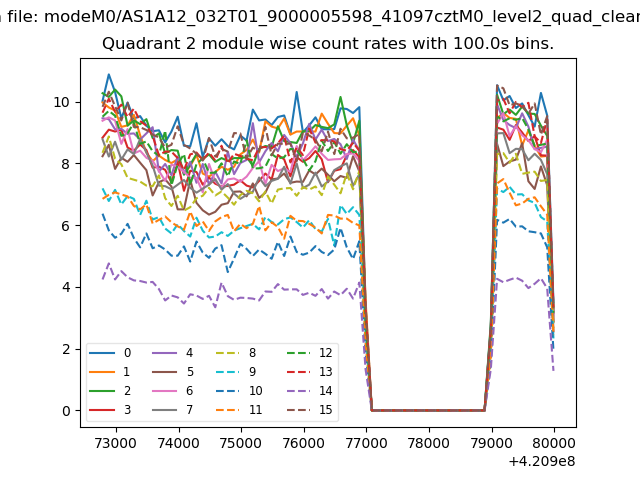
| Module-wise count rates for Quadrant B Data is divided into 100 sec bins |
 |
 |
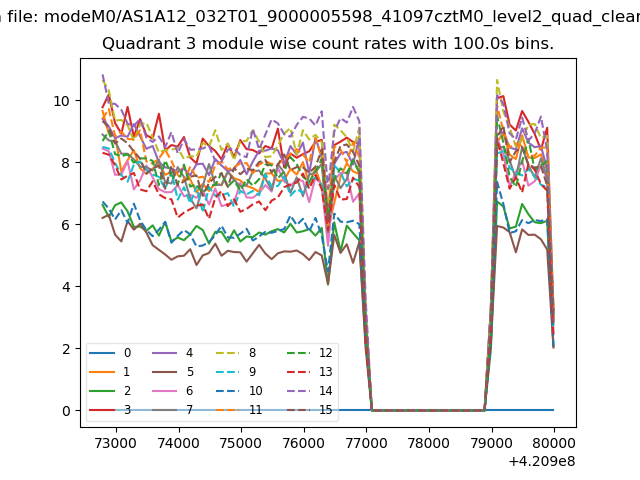
| Module-wise count rates for Quadrant C Data is divided into 100 sec bins |
 |
 |
| Module-wise count rates for Quadrant D Data is divided into 100 sec bins |
 |
 |
| Parameter | Plot |
|---|---|
| CZT HV Monitor | 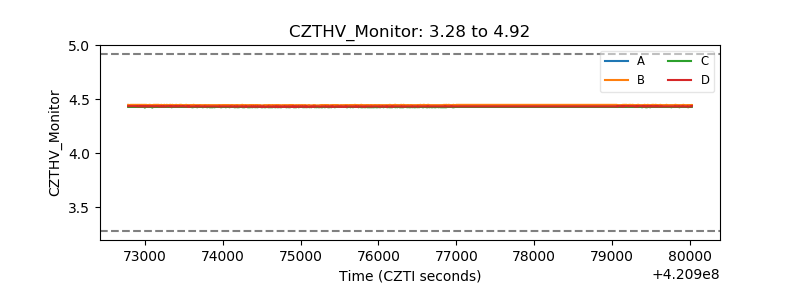 |
| D_VDD | 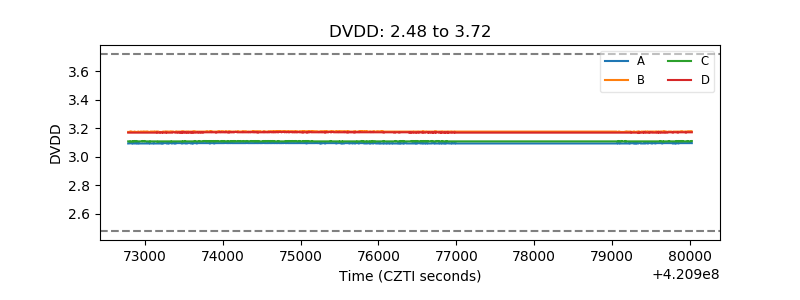 |
| Temperature 1 | 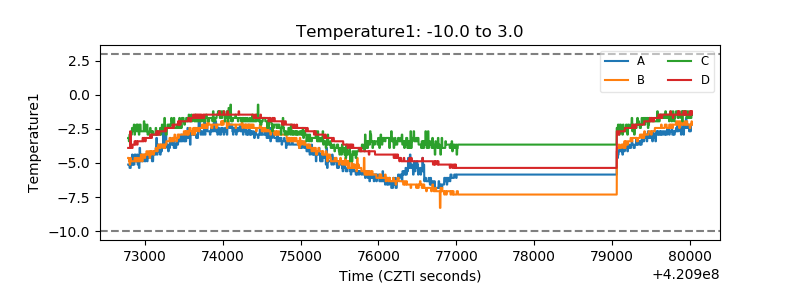 |
| Veto HV Monitor | 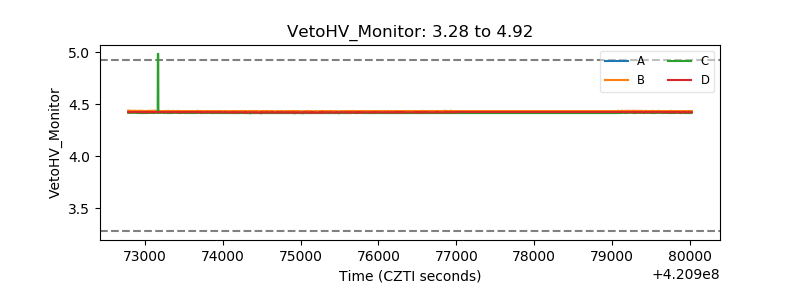 |
| Veto LLD | 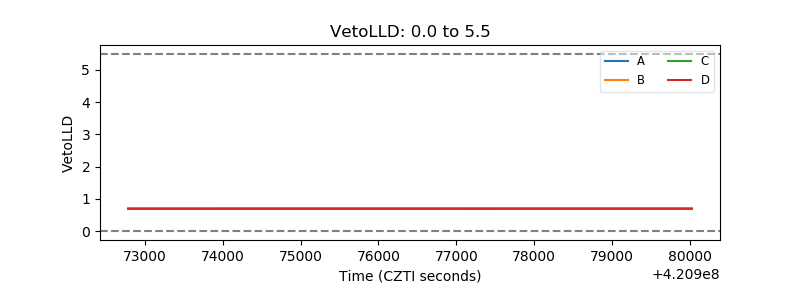 |
| Alpha Counter | 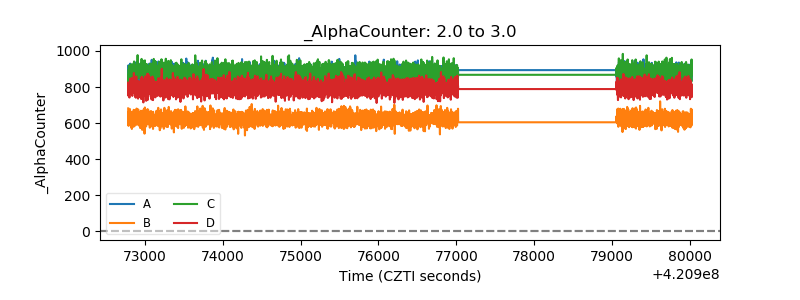 |
| _CPM_Rate | 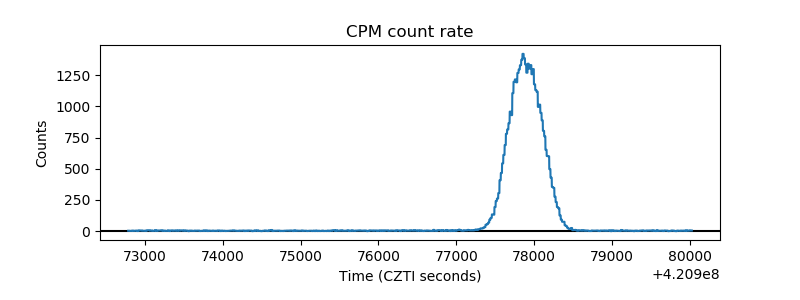 |
| CZT Counter | 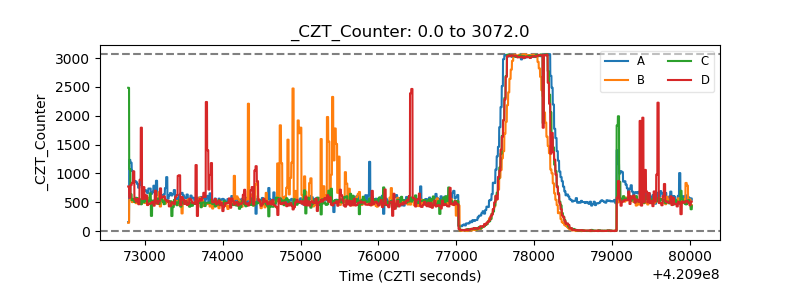 |
| +2.5 Volts monitor | 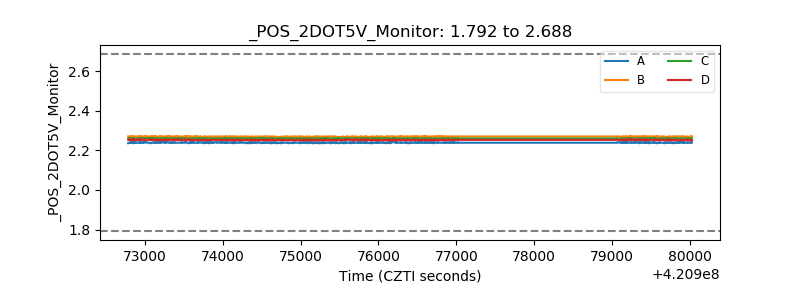 |
| +5 Volts monitor | 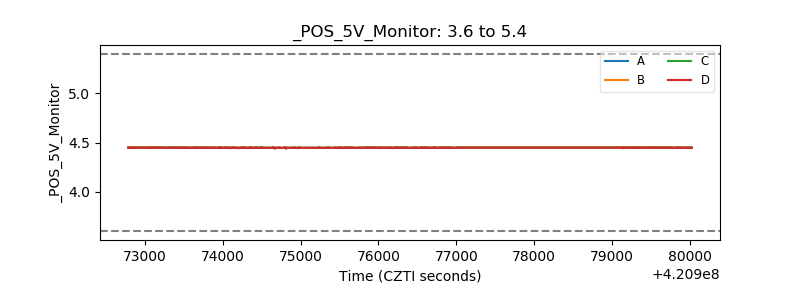 |
| _ROLL_ROT | 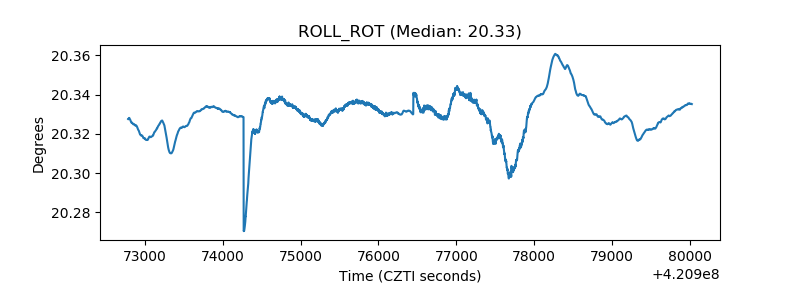 |
| _Roll_DEC | 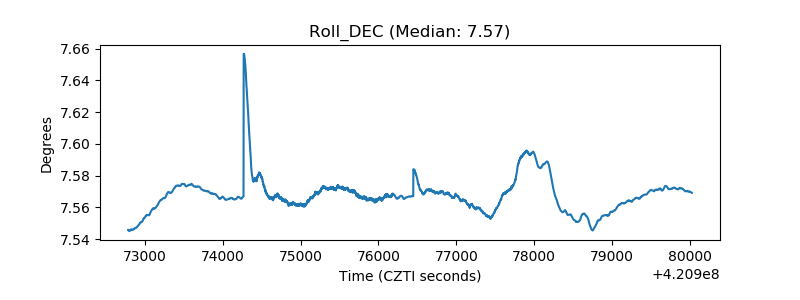 |
| _Roll_RA | 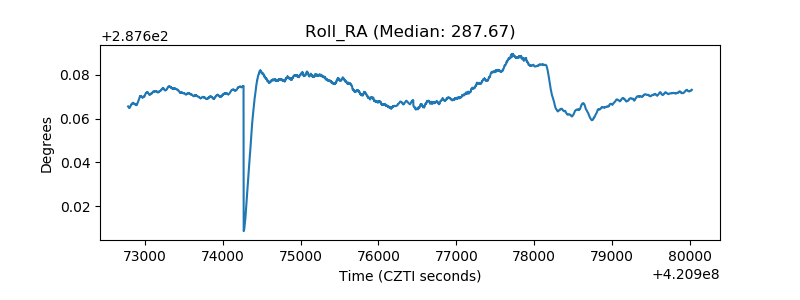 |
| Veto Counter | 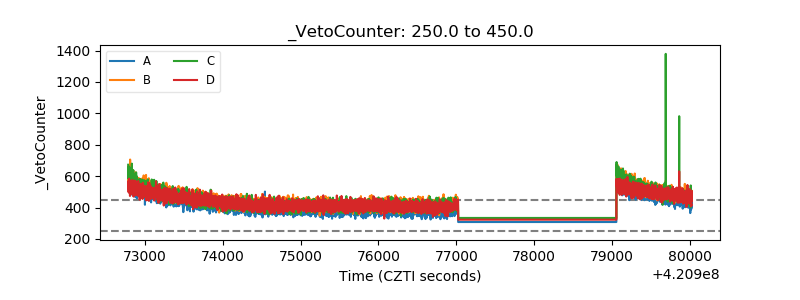 |