| Param | Original file | Final file |
|---|---|---|
| Filename | modeM0/AS1A12_032T01_9000005598_41098cztM0_level2.fits | modeM0/AS1A12_032T01_9000005598_41098cztM0_level2_quad_clean.evt |
| Size (bytes) | 324,610,560 | 97,122,240 |
| Size | 309.6 MB | 92.6 MB |
| Events in quadrant A | 3,085,967 | 672,133 |
| Events in quadrant B | 2,782,814 | 675,009 |
| Events in quadrant C | 2,805,654 | 638,017 |
| Events in quadrant D | 2,937,584 | 592,495 |
| Mode M9 | |||
|---|---|---|---|
| Quadrant | BADHDUFLAG | Total packets | Discarded packets |
| A | 0 | 33 | 0 |
| B | 0 | 33 | 0 |
| C | 0 | 33 | 0 |
| D | 0 | 34 | 0 |
| Mode SS | |||
|---|---|---|---|
| Quadrant | BADHDUFLAG | Total packets | Discarded packets |
| A | 0 | 106 | 0 |
| B | 0 | 106 | 0 |
| C | 0 | 106 | 0 |
| D | 0 | 106 | 0 |
| Mode M0 | |||
|---|---|---|---|
| Quadrant | BADHDUFLAG | Total packets | Discarded packets |
| A | 0 | 12261 | 3 |
| B | 0 | 11274 | 2 |
| C | 0 | 11070 | 2 |
| D | 0 | 11923 | 2 |
| Quadrant | Total seconds | Saturated seconds | Saturation percentage |
|---|---|---|---|
| A | 5187 | 17 | 0.327742% |
| B | 5187 | 99 | 1.908618% |
| C | 5187 | 42 | 0.809717% |
| D | 5187 | 82 | 1.580875% |
Noise dominated data is calculated using 1-second bins in cleaned event files. If a bin has >2000 counts, and if more than 50% of those come from <1% of pixels, then it is considered to be noise-dominated and hence unusable.
| Quadrant | # 1 sec bins | Bins with >0 counts | Bins with >2000 counts | High rate bins dominated by noise | Noise dominated (total time) | Noise dominated (detector-on time) | Marked lightcurve |
|---|---|---|---|---|---|---|---|
| A | 7279 | 5188 | 4 | 4 | 0.05% | 0.08% | 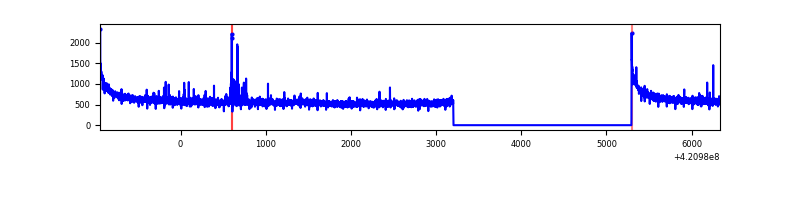 |
| B | 7279 | 5188 | 42 | 42 | 0.58% | 0.81% |  |
| C | 7279 | 5188 | 38 | 38 | 0.52% | 0.73% | 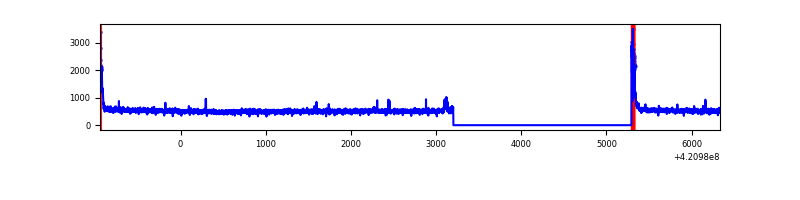 |
| D | 7279 | 5188 | 54 | 54 | 0.74% | 1.04% | 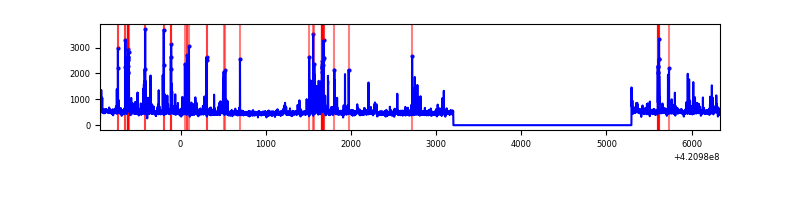 |
Top three noisy pixels from each quadrant. If the there are fewer than three noisy pixels in the level2.evt file, extra rows are filled as -1
| Pixel properties | Quadrant properties | ||||||
|---|---|---|---|---|---|---|---|
| Quadrant | DetID | PixID | Counts | Sigma | Mean | Median | Sigma |
| A | 10 | 83 | 518331 | 3884.75 | 649 | 639 | 133.3 |
| A | 2 | 79 | 51082 | 378.52 | 649 | 639 | 133.3 |
| A | 13 | 254 | 9556 | 66.91 | 649 | 639 | 133.3 |
| B | 0 | 186 | 253245 | 2059.1 | 635 | 621 | 122.7 |
| B | 5 | 255 | 31151 | 248.84 | 635 | 621 | 122.7 |
| B | 12 | 111 | 14993 | 117.14 | 635 | 621 | 122.7 |
| C | 15 | 214 | 220545 | 1528.36 | 619 | 624 | 143.9 |
| C | 0 | 10 | 141788 | 981.03 | 619 | 624 | 143.9 |
| C | 14 | 254 | 25978 | 176.2 | 619 | 624 | 143.9 |
| D | 2 | 249 | 237749 | 1559.86 | 626 | 607 | 152.0 |
| D | 13 | 249 | 118512 | 775.55 | 626 | 607 | 152.0 |
| D | 9 | 19 | 64287 | 418.87 | 626 | 607 | 152.0 |
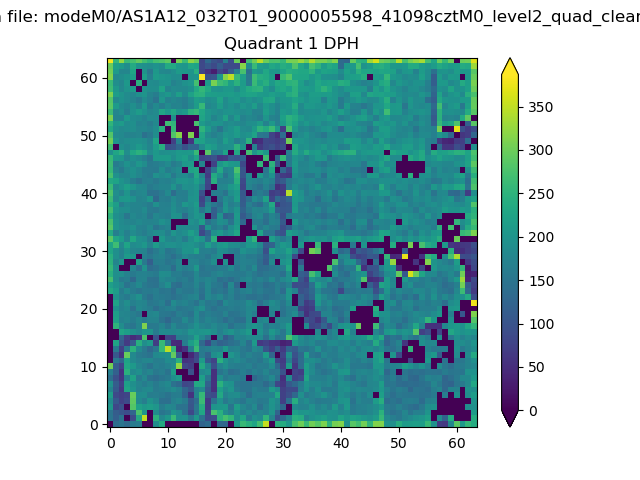
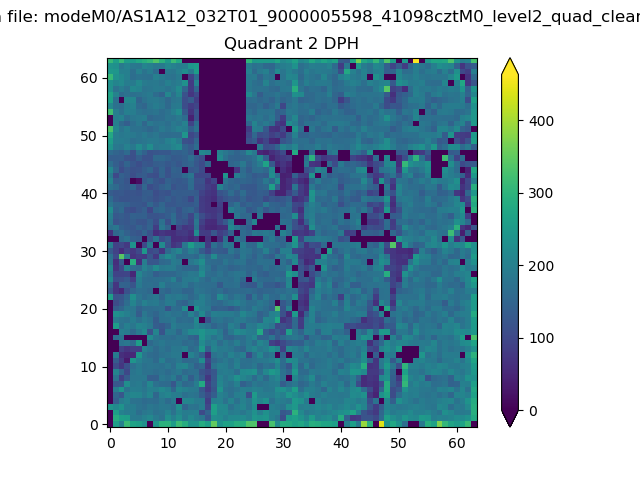
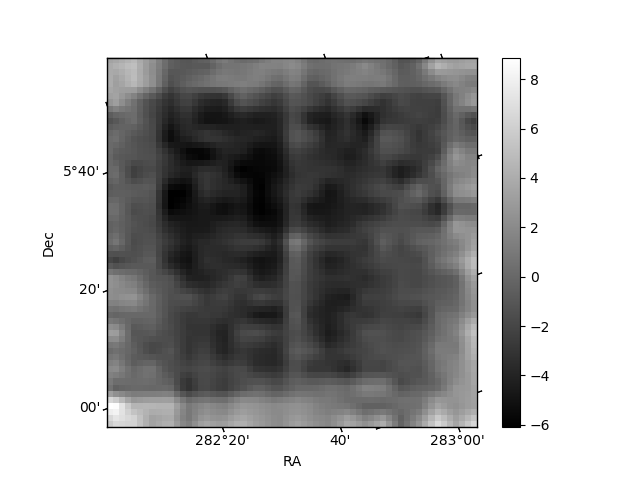
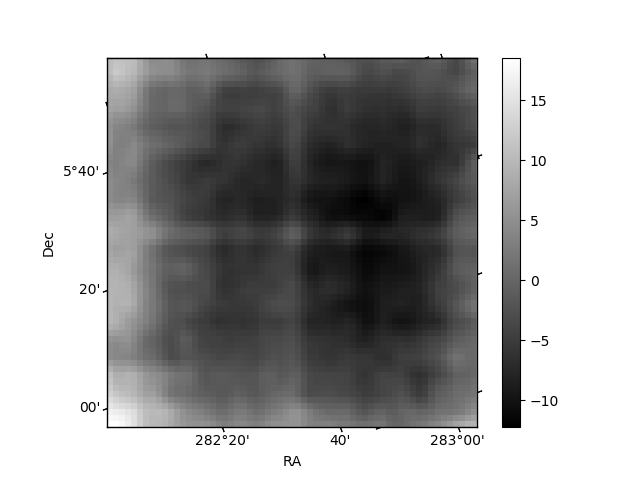
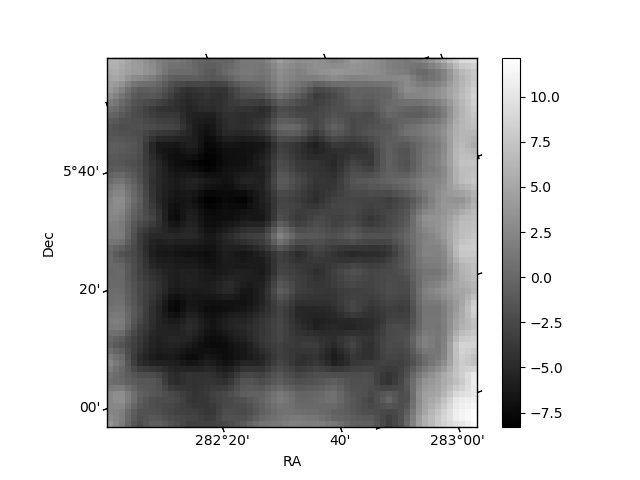
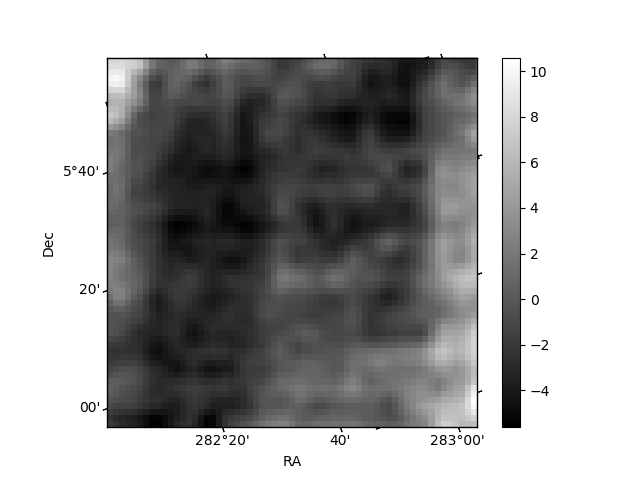
Histogram calculated using DETX and DETY for each event in the final _common_clean file
| Quadrant A | 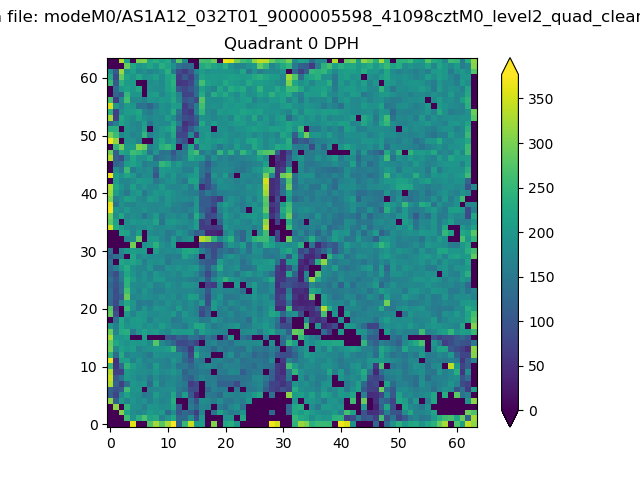 |
 |
Quadrant B |
|---|---|---|---|
| Quadrant D | 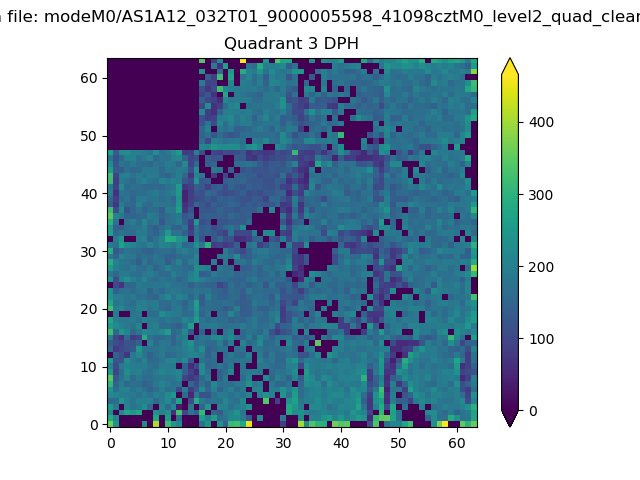 |
 |
Quadrant C |
| Plot type | Count rate plots | Images |
|---|---|---|
| Comparison with Poisson distribution Blue bars denote a histogram of data divided into 1 sec bins. Red curve is a Poisson curve with rate = median count rate of data. |
 |
 |
| Quadrant-wise count rates Data is divided into 100 sec bins |
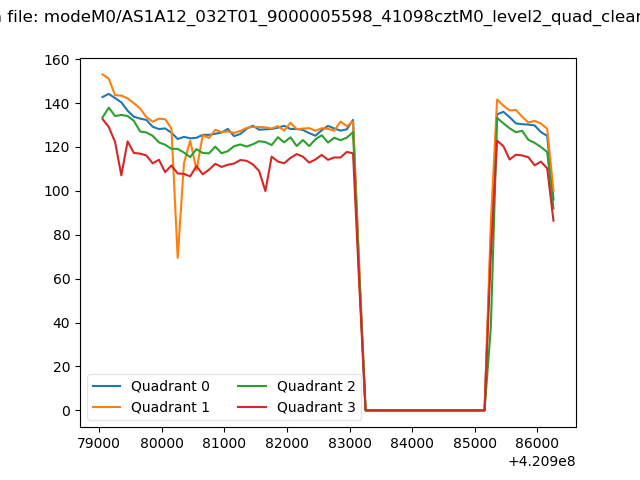 |
|
| Module-wise count rates for Quadrant A Data is divided into 100 sec bins |
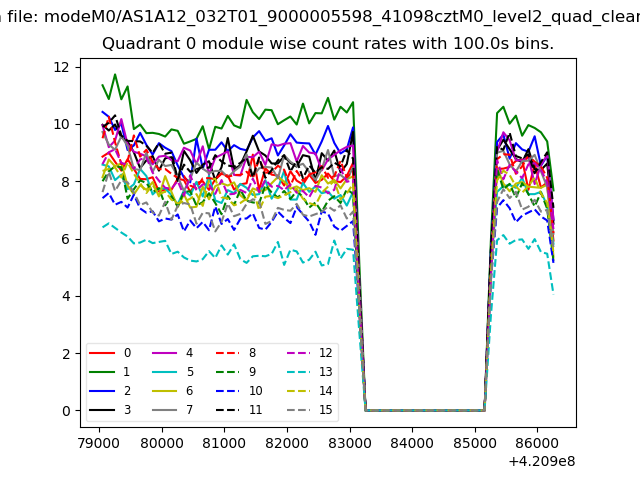 |
 |
| Module-wise count rates for Quadrant B Data is divided into 100 sec bins |
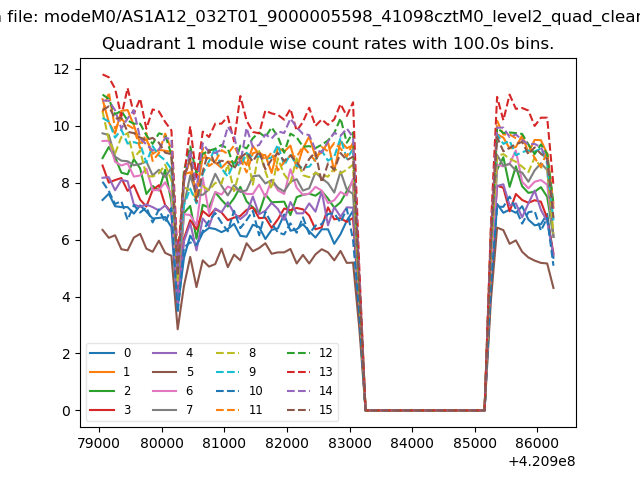 |
 |
| Module-wise count rates for Quadrant C Data is divided into 100 sec bins |
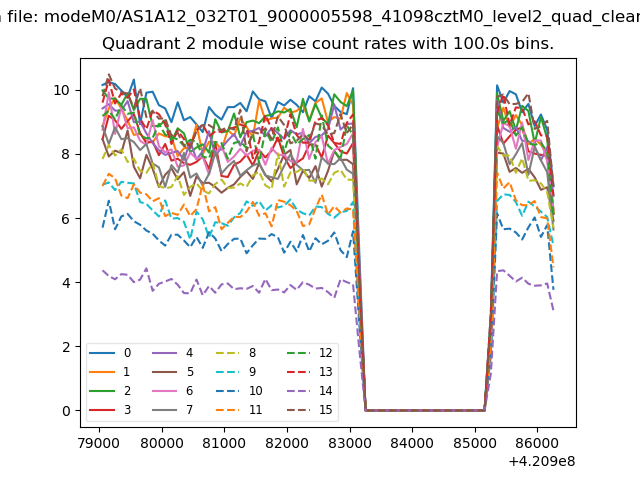 |
 |
| Module-wise count rates for Quadrant D Data is divided into 100 sec bins |
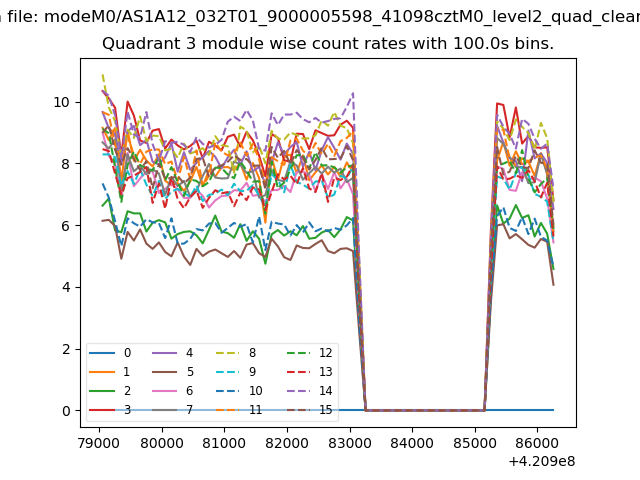 |
 |
| Parameter | Plot |
|---|---|
| CZT HV Monitor | 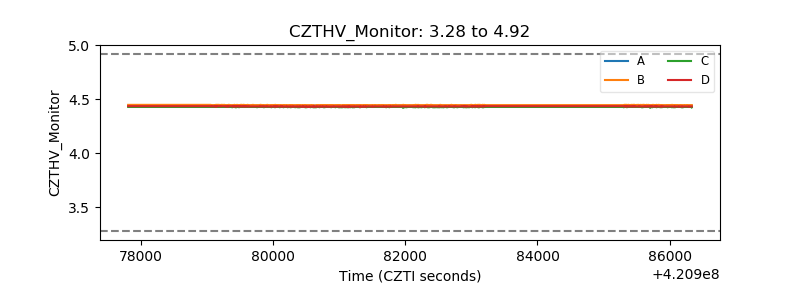 |
| D_VDD | 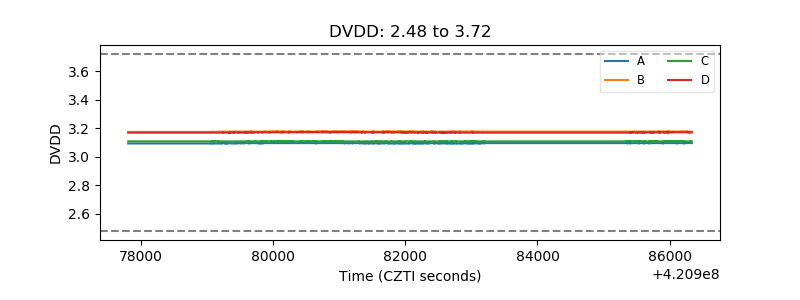 |
| Temperature 1 | 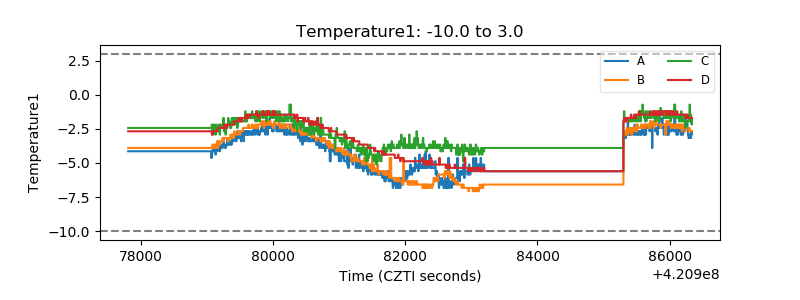 |
| Veto HV Monitor | 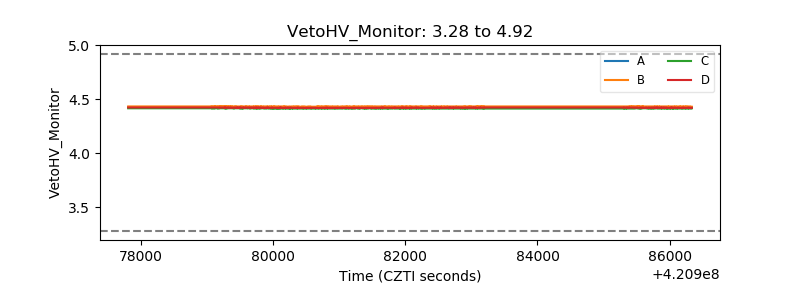 |
| Veto LLD | 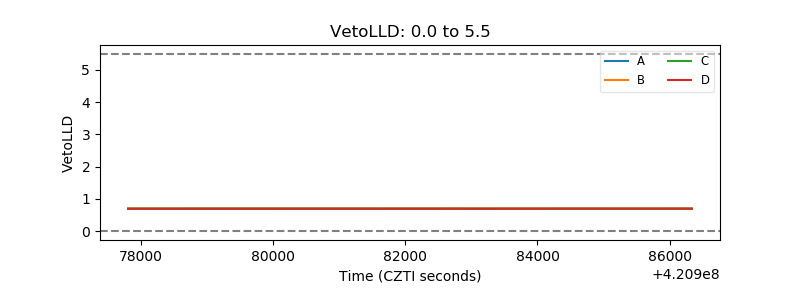 |
| Alpha Counter | 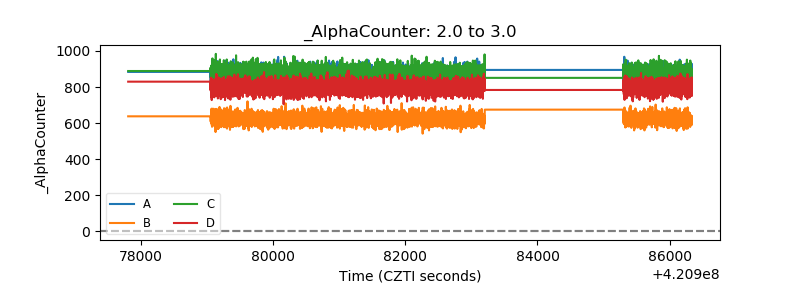 |
| _CPM_Rate | 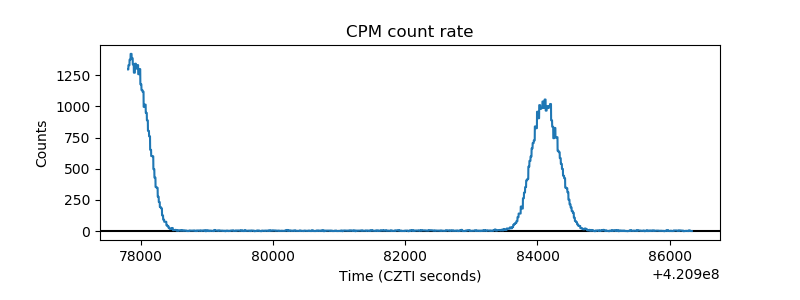 |
| CZT Counter | 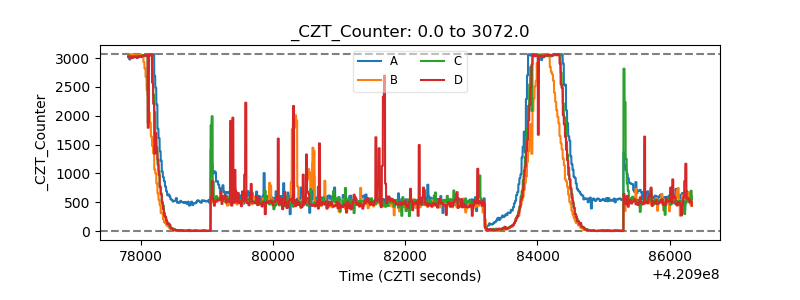 |
| +2.5 Volts monitor | 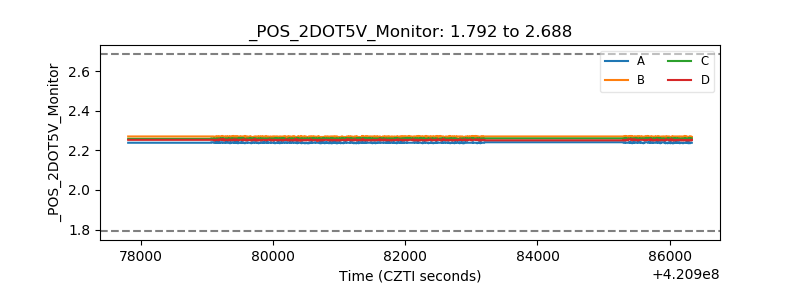 |
| +5 Volts monitor | 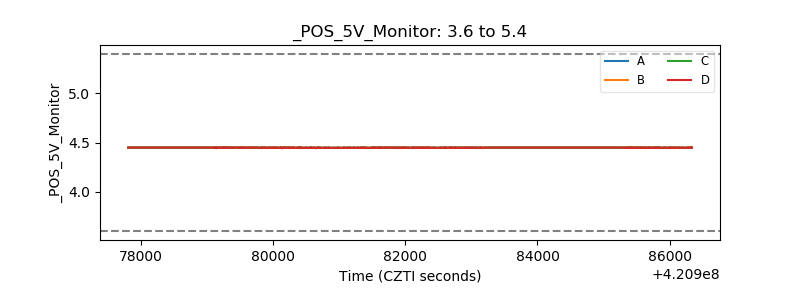 |
| _ROLL_ROT | 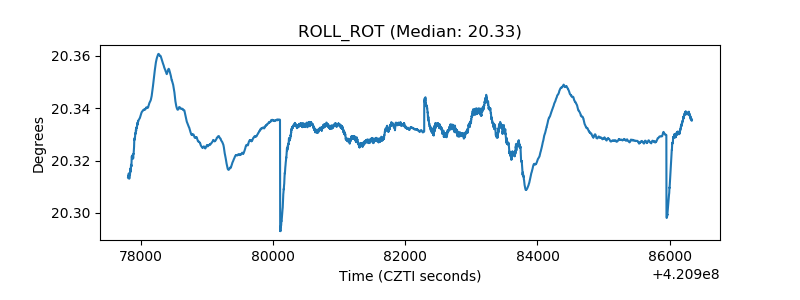 |
| _Roll_DEC | 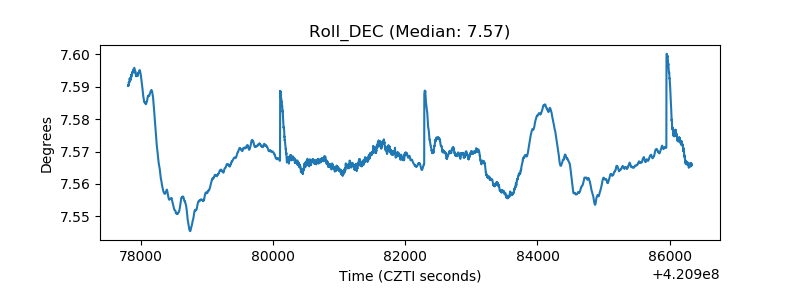 |
| _Roll_RA | 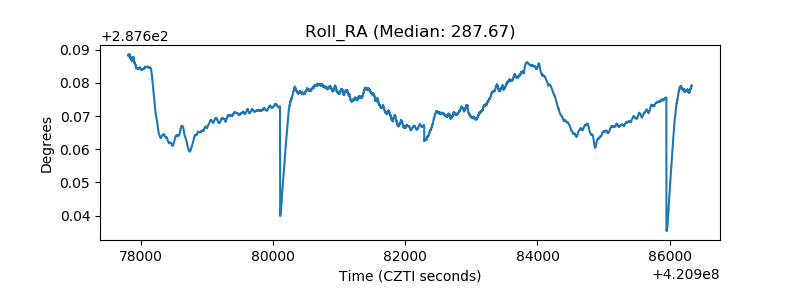 |
| Veto Counter | 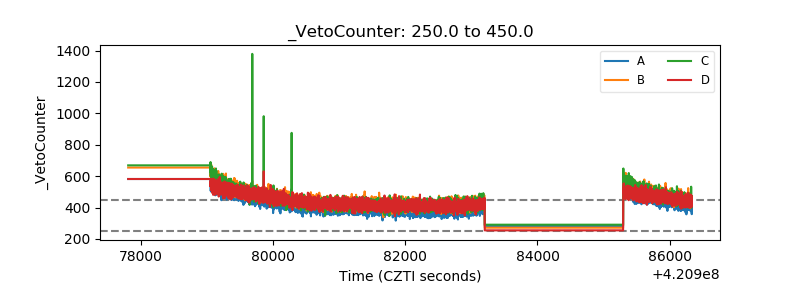 |