| Param | Original file | Final file |
|---|---|---|
| Filename | modeM0/AS1A12_032T01_9000005598_41099cztM0_level2.fits | modeM0/AS1A12_032T01_9000005598_41099cztM0_level2_quad_clean.evt |
| Size (bytes) | 195,347,520 | 59,057,280 |
| Size | 186.3 MB | 56.3 MB |
| Events in quadrant A | 1,860,963 | 406,342 |
| Events in quadrant B | 1,574,685 | 413,046 |
| Events in quadrant C | 1,804,826 | 380,719 |
| Events in quadrant D | 1,738,856 | 360,130 |
| Mode M9 | |||
|---|---|---|---|
| Quadrant | BADHDUFLAG | Total packets | Discarded packets |
| A | 0 | 10 | 0 |
| B | 0 | 10 | 0 |
| C | 0 | 10 | 0 |
| D | 0 | 11 | 0 |
| Mode SS | |||
|---|---|---|---|
| Quadrant | BADHDUFLAG | Total packets | Discarded packets |
| A | 0 | 64 | 0 |
| B | 0 | 64 | 0 |
| C | 0 | 64 | 0 |
| D | 0 | 64 | 0 |
| Mode M0 | |||
|---|---|---|---|
| Quadrant | BADHDUFLAG | Total packets | Discarded packets |
| A | 0 | 7428 | 1 |
| B | 0 | 6640 | 1 |
| C | 0 | 7132 | 1 |
| D | 0 | 7167 | 1 |
| Quadrant | Total seconds | Saturated seconds | Saturation percentage |
|---|---|---|---|
| A | 3213 | 7 | 0.217865% |
| B | 3213 | 4 | 0.124494% |
| C | 3213 | 62 | 1.929661% |
| D | 3213 | 22 | 0.684718% |
Noise dominated data is calculated using 1-second bins in cleaned event files. If a bin has >2000 counts, and if more than 50% of those come from <1% of pixels, then it is considered to be noise-dominated and hence unusable.
| Quadrant | # 1 sec bins | Bins with >0 counts | Bins with >2000 counts | High rate bins dominated by noise | Noise dominated (total time) | Noise dominated (detector-on time) | Marked lightcurve |
|---|---|---|---|---|---|---|---|
| A | 3213 | 3213 | 1 | 1 | 0.03% | 0.03% | 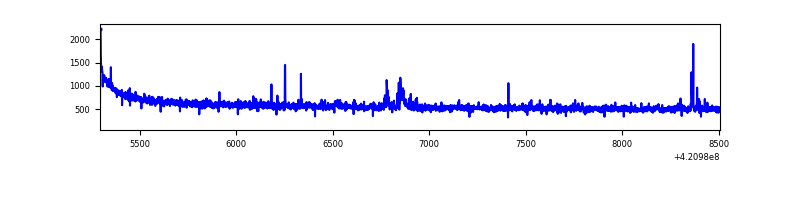 |
| B | 3213 | 3213 | 0 | 0 | 0.00% | 0.00% | 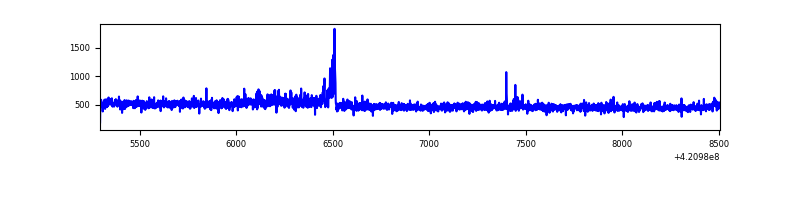 |
| C | 3213 | 3213 | 52 | 52 | 1.62% | 1.62% | 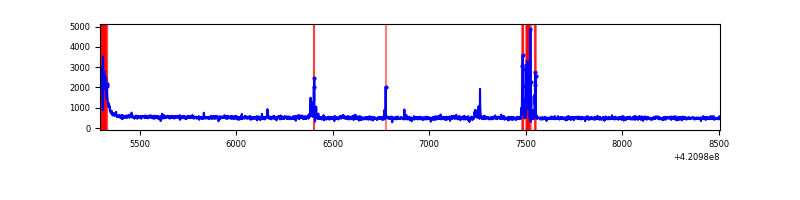 |
| D | 3213 | 3213 | 19 | 19 | 0.59% | 0.59% | 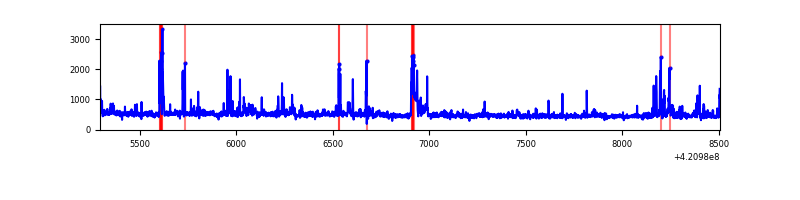 |
Top three noisy pixels from each quadrant. If the there are fewer than three noisy pixels in the level2.evt file, extra rows are filled as -1
| Pixel properties | Quadrant properties | ||||||
|---|---|---|---|---|---|---|---|
| Quadrant | DetID | PixID | Counts | Sigma | Mean | Median | Sigma |
| A | 10 | 83 | 304806 | 3765.39 | 390 | 382 | 80.8 |
| A | 13 | 248 | 31768 | 388.21 | 390 | 382 | 80.8 |
| A | 2 | 79 | 7129 | 83.45 | 390 | 382 | 80.8 |
| B | 0 | 186 | 51301 | 675.95 | 386 | 376 | 75.3 |
| B | 12 | 111 | 9209 | 117.24 | 386 | 376 | 75.3 |
| B | 11 | 111 | 8507 | 107.93 | 386 | 376 | 75.3 |
| C | 15 | 214 | 134434 | 1525.6 | 374 | 378 | 87.9 |
| C | 14 | 254 | 117354 | 1331.23 | 374 | 378 | 87.9 |
| C | 0 | 10 | 91331 | 1035.08 | 374 | 378 | 87.9 |
| D | 2 | 249 | 96337 | 1035.07 | 378 | 367 | 92.7 |
| D | 13 | 249 | 77611 | 833.11 | 378 | 367 | 92.7 |
| D | 1 | 52 | 49663 | 531.68 | 378 | 367 | 92.7 |
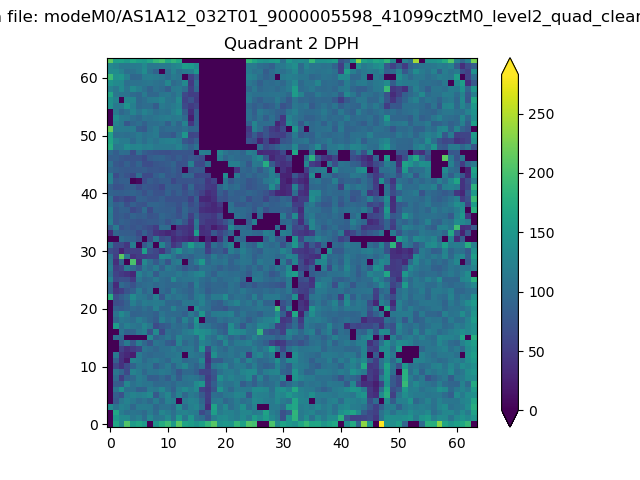
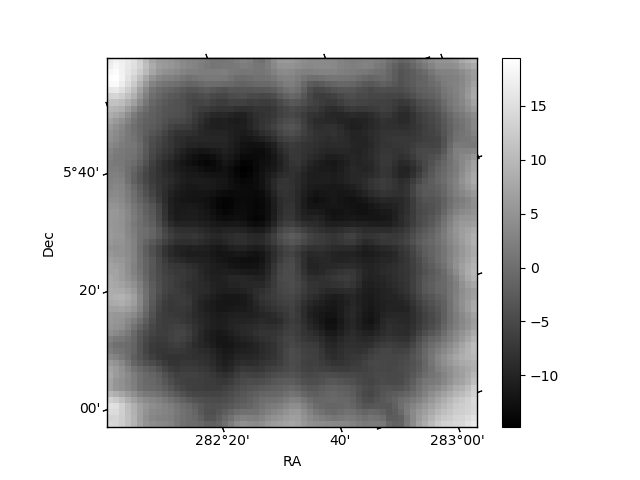
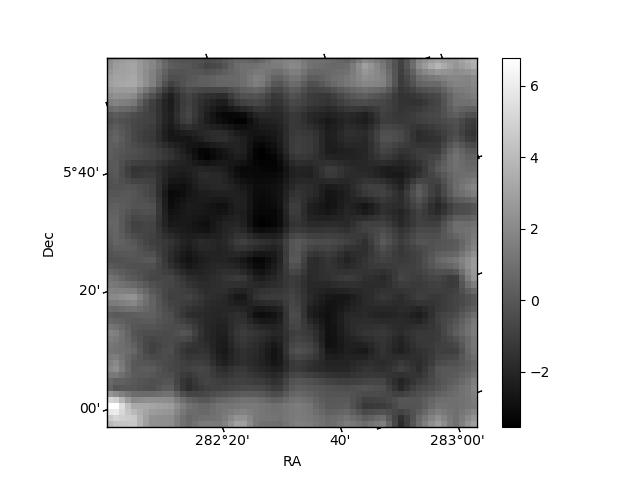
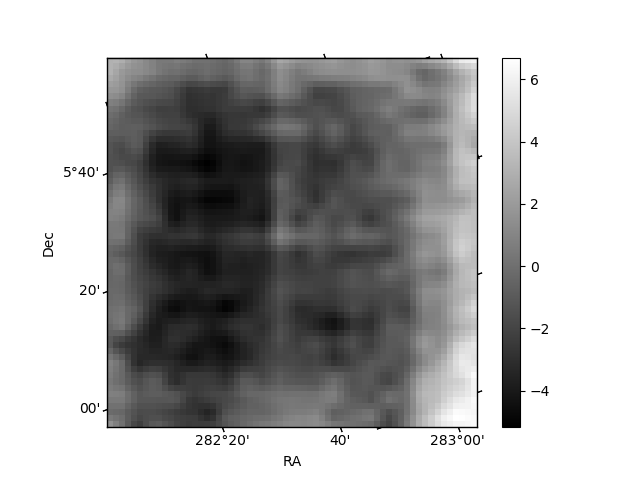
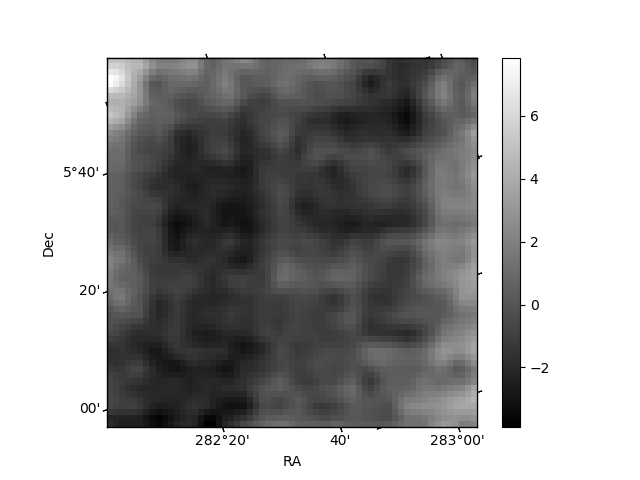
Histogram calculated using DETX and DETY for each event in the final _common_clean file
| Quadrant A | 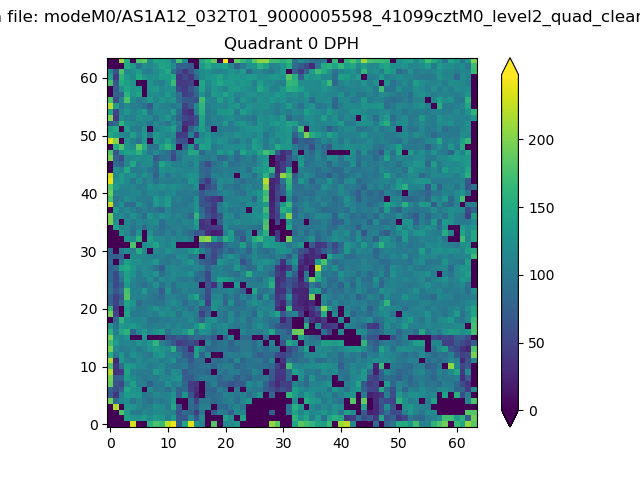 |
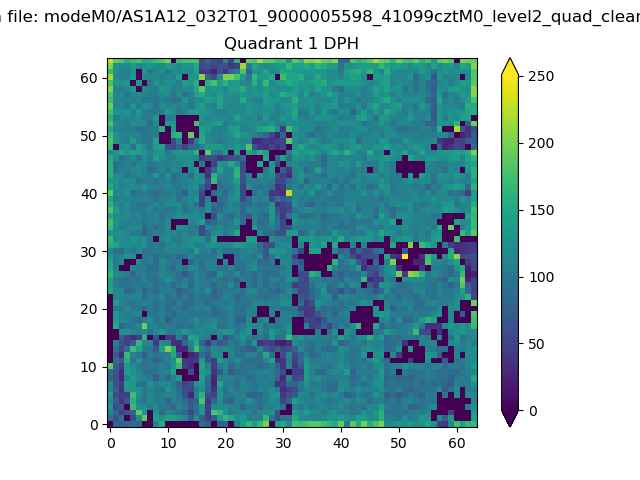 |
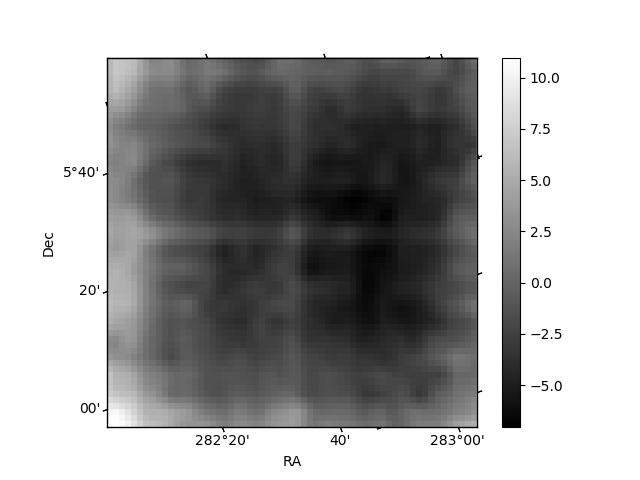
Quadrant B |
|---|---|---|---|
| Quadrant D | 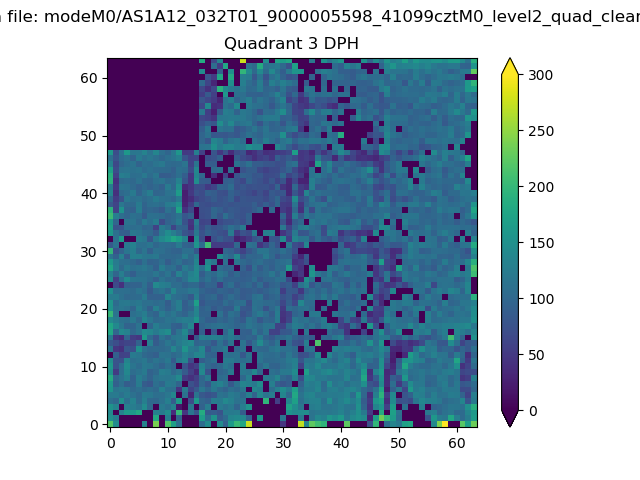 |
 |
Quadrant C |
| Plot type | Count rate plots | Images |
|---|---|---|
| Comparison with Poisson distribution Blue bars denote a histogram of data divided into 1 sec bins. Red curve is a Poisson curve with rate = median count rate of data. |
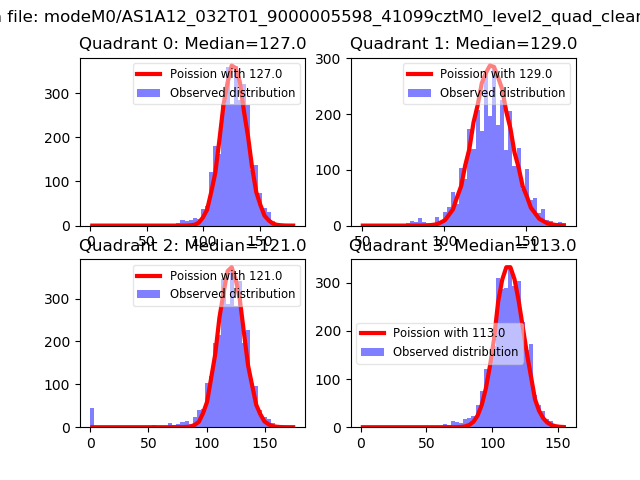 |
 |
| Quadrant-wise count rates Data is divided into 100 sec bins |
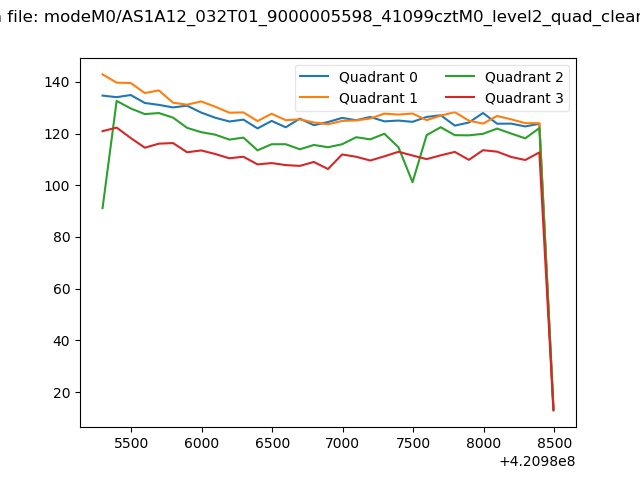 |
|
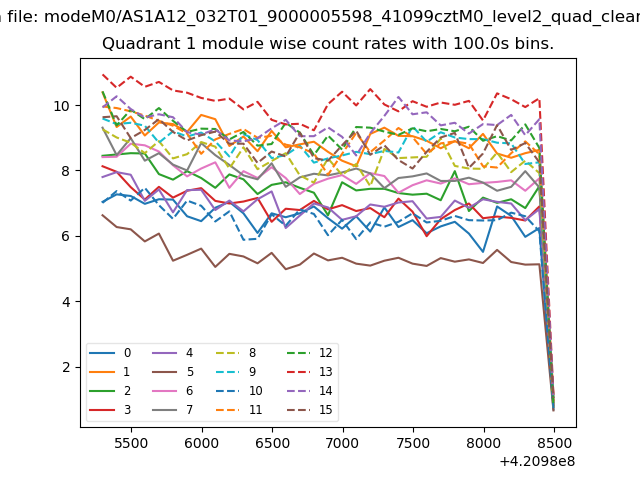
| Module-wise count rates for Quadrant A Data is divided into 100 sec bins |
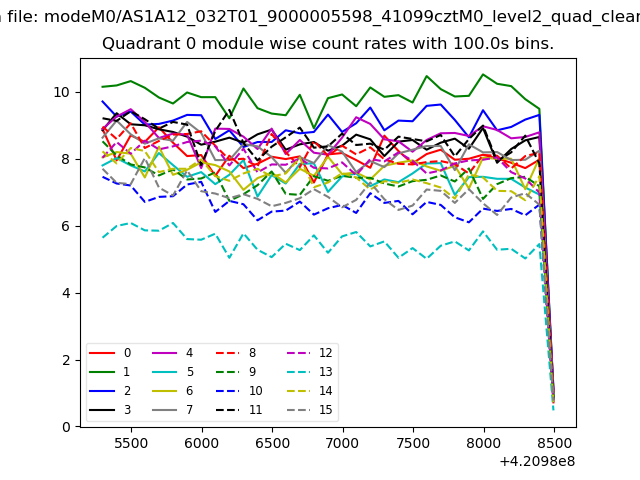 |
 |
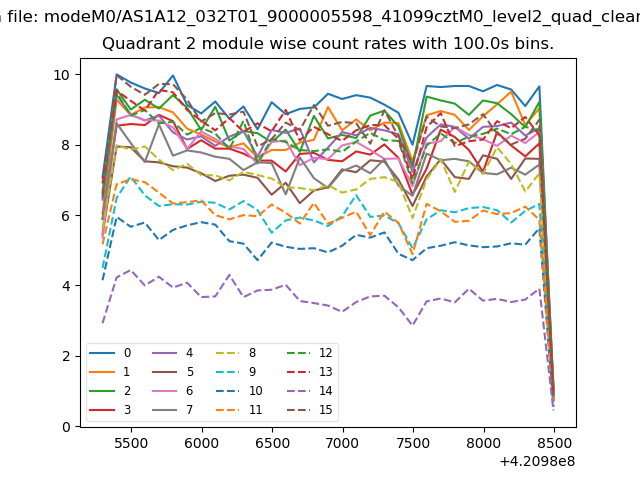
| Module-wise count rates for Quadrant B Data is divided into 100 sec bins |
 |
 |
| Module-wise count rates for Quadrant C Data is divided into 100 sec bins |
 |
 |
| Module-wise count rates for Quadrant D Data is divided into 100 sec bins |
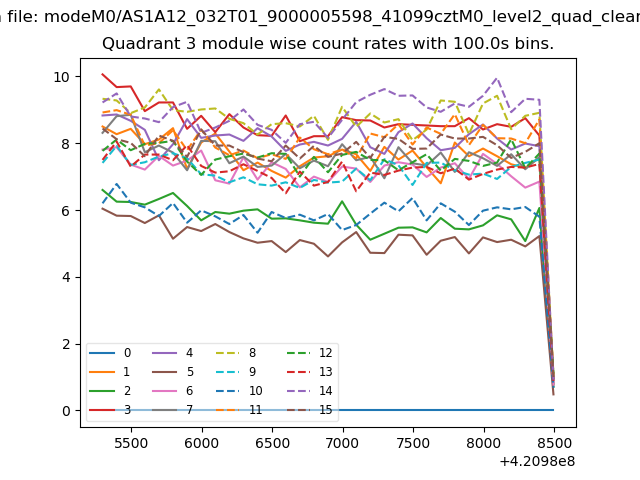 |
 |
| Parameter | Plot |
|---|---|
| CZT HV Monitor | 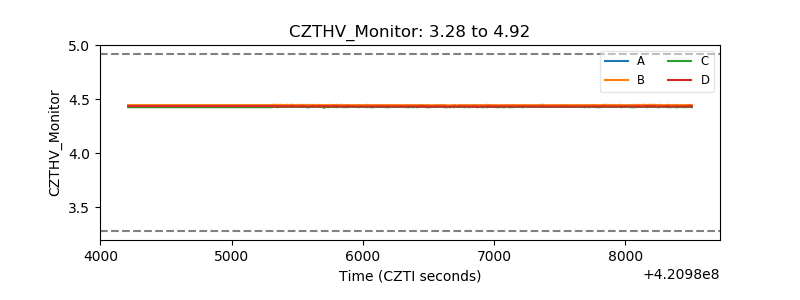 |
| D_VDD | 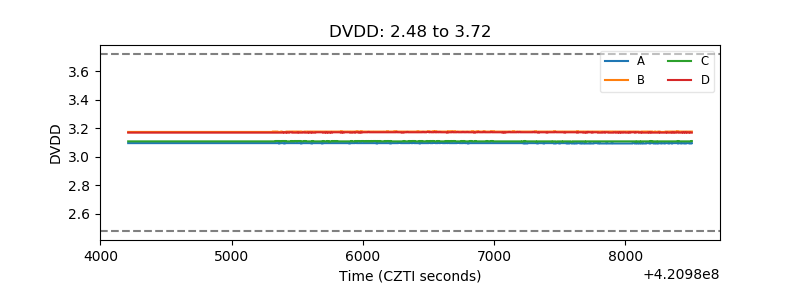 |
| Temperature 1 | 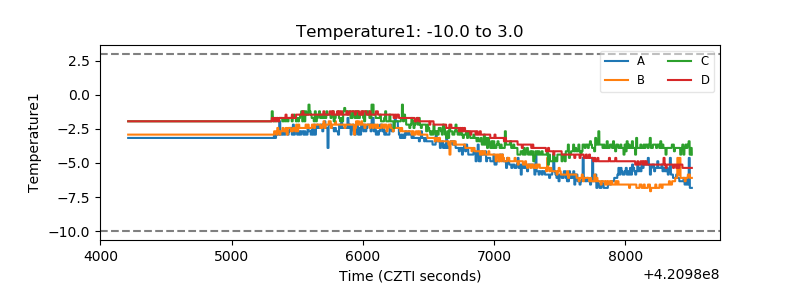 |
| Veto HV Monitor | 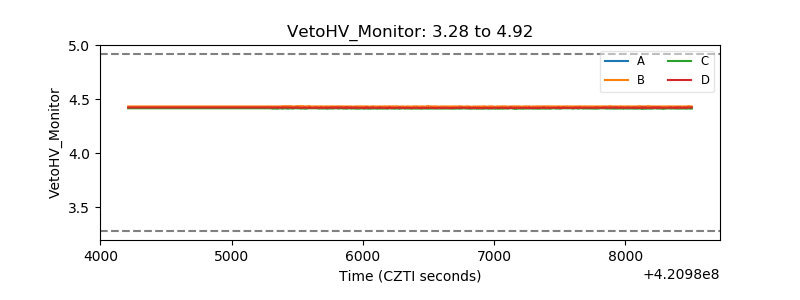 |
| Veto LLD | 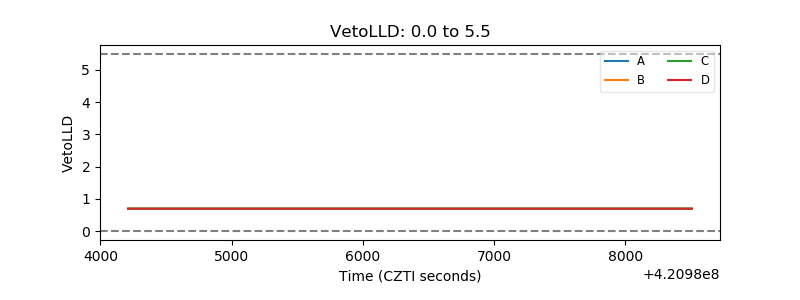 |
| Alpha Counter | 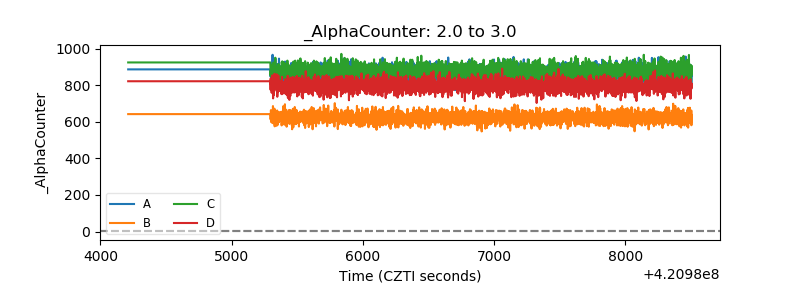 |
| _CPM_Rate | 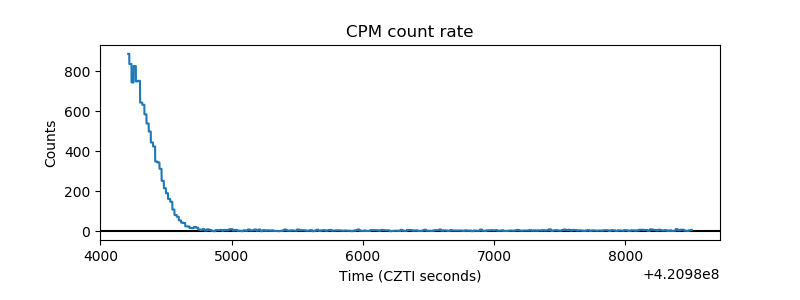 |
| CZT Counter | 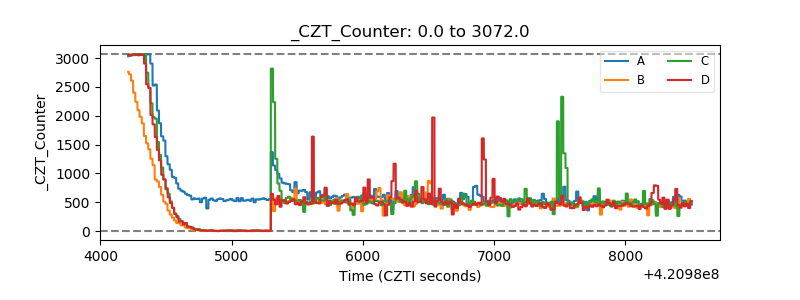 |
| +2.5 Volts monitor | 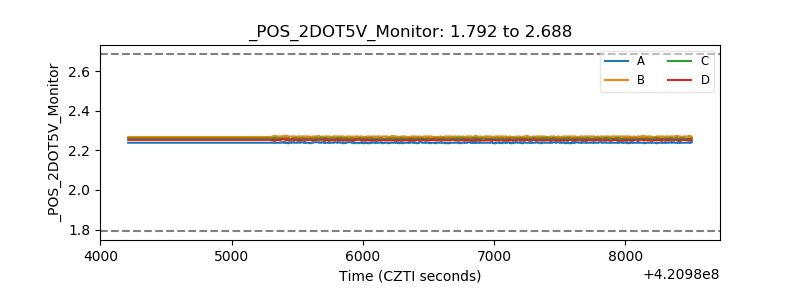 |
| +5 Volts monitor | 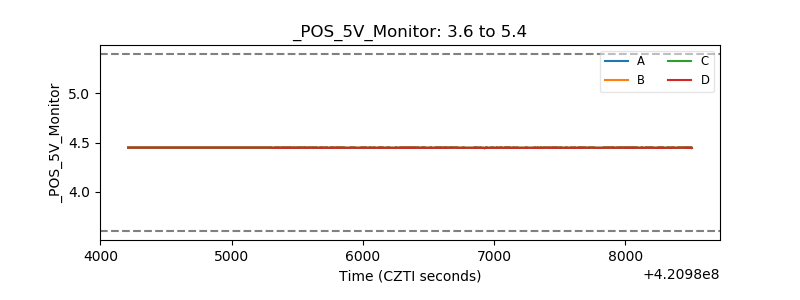 |
| _ROLL_ROT | 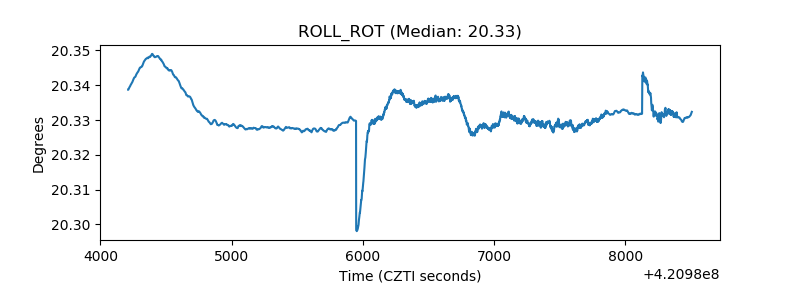 |
| _Roll_DEC | 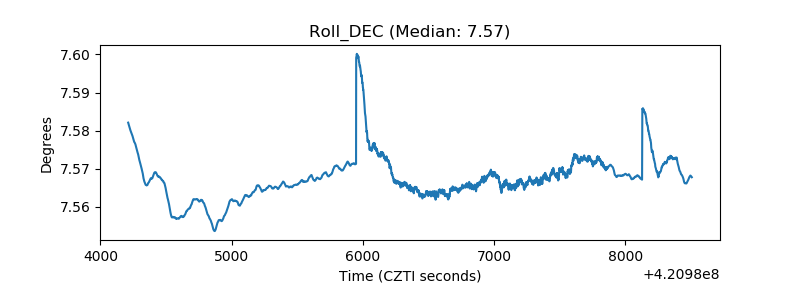 |
| _Roll_RA | 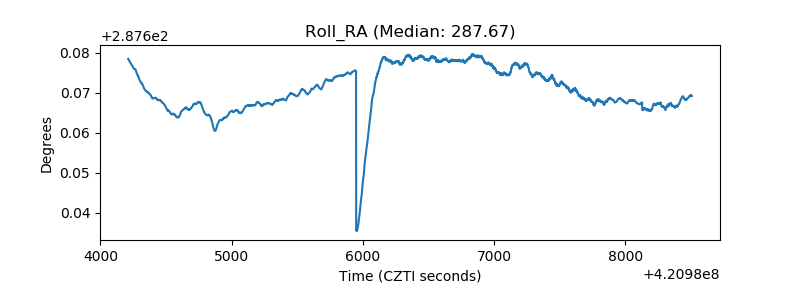 |
| Veto Counter | 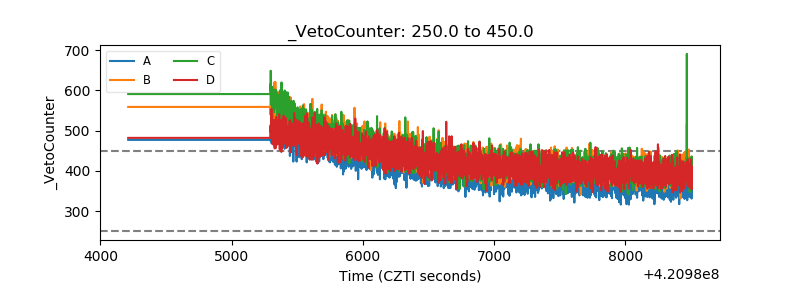 |