| Param | Original file | Final file |
|---|---|---|
| Filename | modeM0/AS1A12_044T19_9000005600_41099cztM0_level2.fits | modeM0/AS1A12_044T19_9000005600_41099cztM0_level2_quad_clean.evt |
| Size (bytes) | 71,737,920 | 18,414,720 |
| Size | 68.4 MB | 17.6 MB |
| Events in quadrant A | 681,659 | 125,628 |
| Events in quadrant B | 744,977 | 124,308 |
| Events in quadrant C | 559,551 | 118,145 |
| Events in quadrant D | 587,492 | 112,180 |
| Mode SS | |||
|---|---|---|---|
| Quadrant | BADHDUFLAG | Total packets | Discarded packets |
| A | 0 | 20 | 0 |
| B | 0 | 20 | 0 |
| C | 0 | 20 | 0 |
| D | 0 | 20 | 0 |
| Mode M0 | |||
|---|---|---|---|
| Quadrant | BADHDUFLAG | Total packets | Discarded packets |
| A | 0 | 2744 | 2 |
| B | 0 | 2839 | 1 |
| C | 0 | 2225 | 1 |
| D | 0 | 2349 | 1 |
| Mode M9 | |||
|---|---|---|---|
| Quadrant | BADHDUFLAG | Total packets | Discarded packets |
| A | 0 | 15 | 0 |
| B | 0 | 15 | 0 |
| C | 0 | 15 | 0 |
| D | 0 | 15 | 0 |
| Quadrant | Total seconds | Saturated seconds | Saturation percentage |
|---|---|---|---|
| A | 1012 | 7 | 0.691700% |
| B | 1012 | 45 | 4.446640% |
| C | 1012 | 11 | 1.086957% |
| D | 1012 | 13 | 1.284585% |
Noise dominated data is calculated using 1-second bins in cleaned event files. If a bin has >2000 counts, and if more than 50% of those come from <1% of pixels, then it is considered to be noise-dominated and hence unusable.
| Quadrant | # 1 sec bins | Bins with >0 counts | Bins with >2000 counts | High rate bins dominated by noise | Noise dominated (total time) | Noise dominated (detector-on time) | Marked lightcurve |
|---|---|---|---|---|---|---|---|
| A | 1012 | 1012 | 4 | 4 | 0.40% | 0.40% | 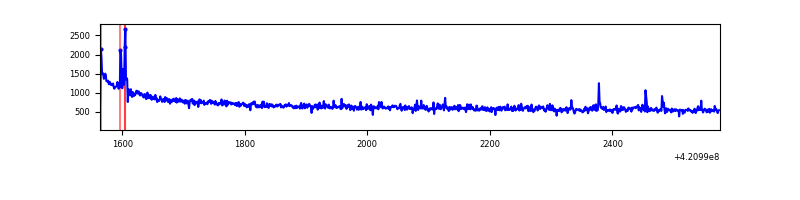 |
| B | 1012 | 1012 | 31 | 31 | 3.06% | 3.06% | 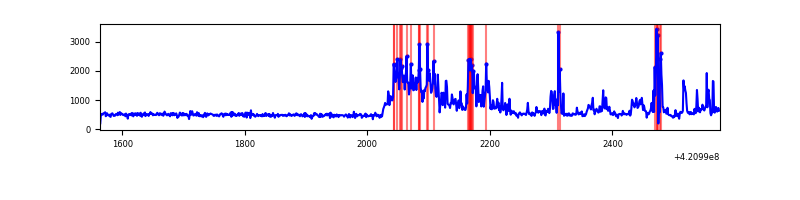 |
| C | 1012 | 1012 | 6 | 6 | 0.59% | 0.59% | 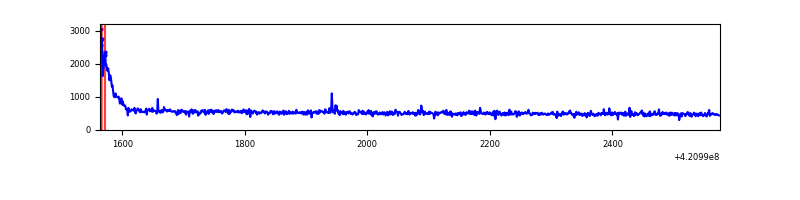 |
| D | 1012 | 1012 | 11 | 11 | 1.09% | 1.09% | 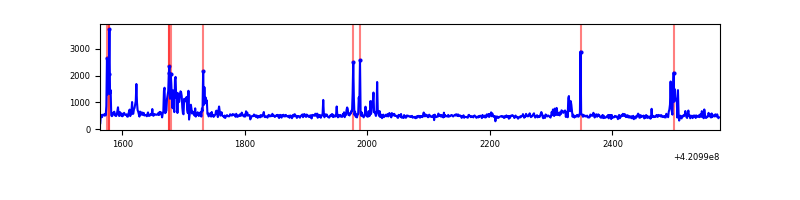 |
Top three noisy pixels from each quadrant. If the there are fewer than three noisy pixels in the level2.evt file, extra rows are filled as -1
| Pixel properties | Quadrant properties | ||||||
|---|---|---|---|---|---|---|---|
| Quadrant | DetID | PixID | Counts | Sigma | Mean | Median | Sigma |
| A | 10 | 83 | 166249 | 5923.44 | 126 | 123 | 28.0 |
| A | 2 | 79 | 10495 | 369.83 | 126 | 123 | 28.0 |
| A | 7 | 3 | 9212 | 324.08 | 126 | 123 | 28.0 |
| B | 0 | 186 | 210720 | 8233.29 | 121 | 118 | 25.6 |
| B | 5 | 255 | 40725 | 1587.49 | 121 | 118 | 25.6 |
| B | 15 | 85 | 15190 | 589.23 | 121 | 118 | 25.6 |
| C | 15 | 214 | 47399 | 1592.79 | 119 | 120 | 29.7 |
| C | 0 | 10 | 41689 | 1400.43 | 119 | 120 | 29.7 |
| C | 14 | 254 | 3504 | 114.0 | 119 | 120 | 29.7 |
| D | 2 | 249 | 45422 | 1432.14 | 122 | 119 | 31.6 |
| D | 13 | 249 | 26274 | 826.82 | 122 | 119 | 31.6 |
| D | 13 | 112 | 12477 | 390.67 | 122 | 119 | 31.6 |
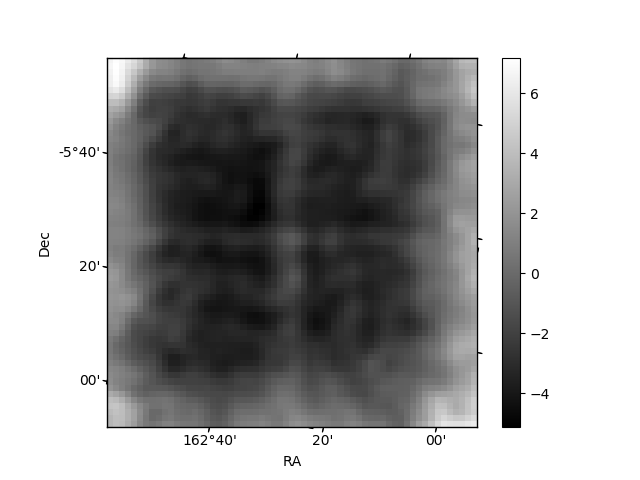
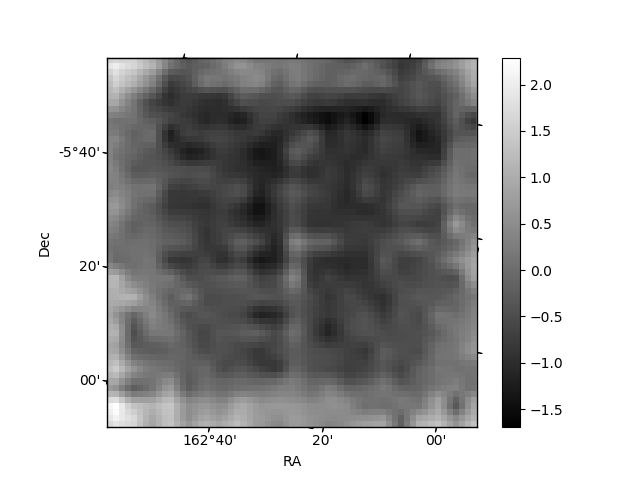
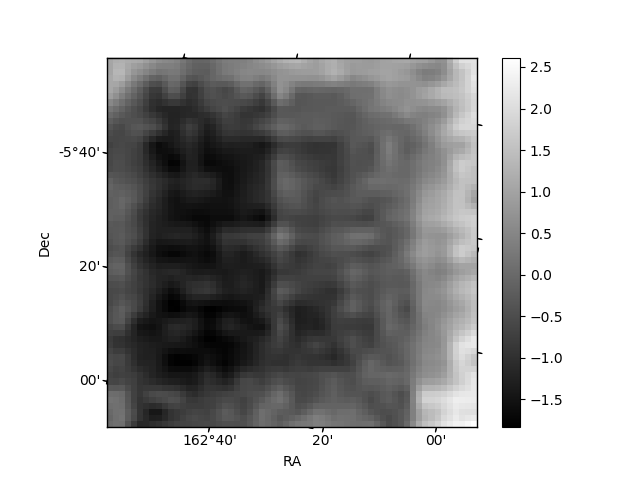
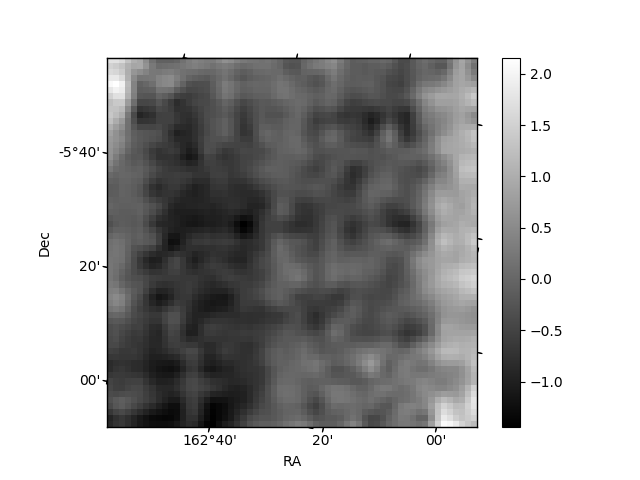
Histogram calculated using DETX and DETY for each event in the final _common_clean file
| Quadrant A | 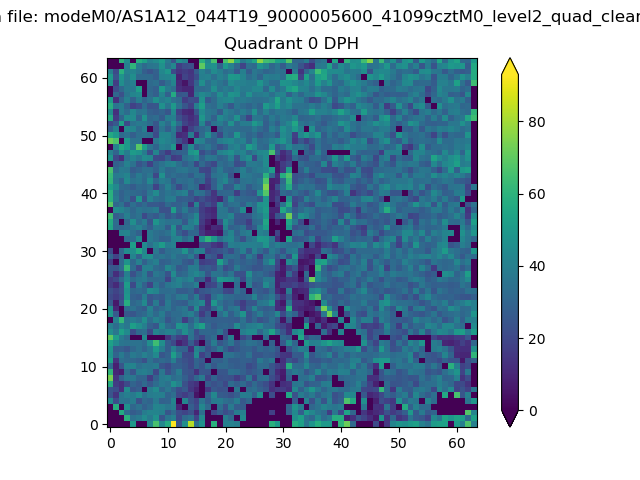 |
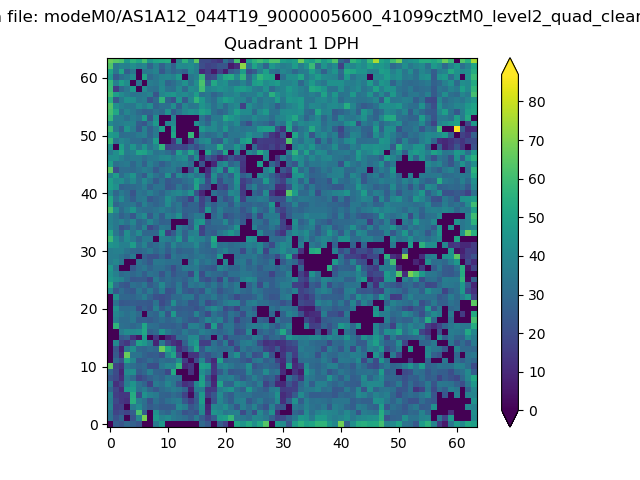 |
Quadrant B |
|---|---|---|---|
| Quadrant D | 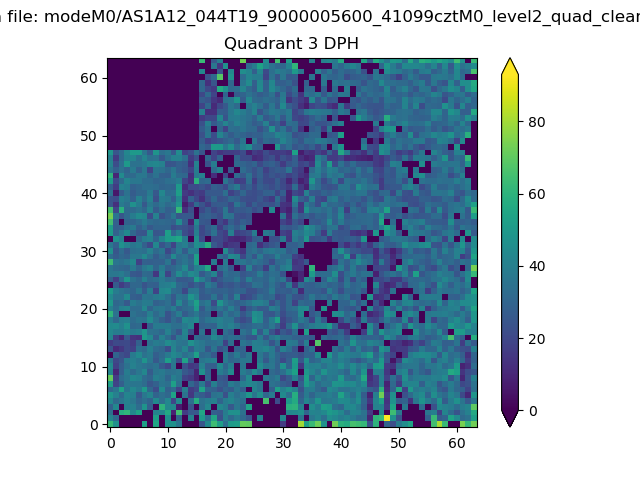 |
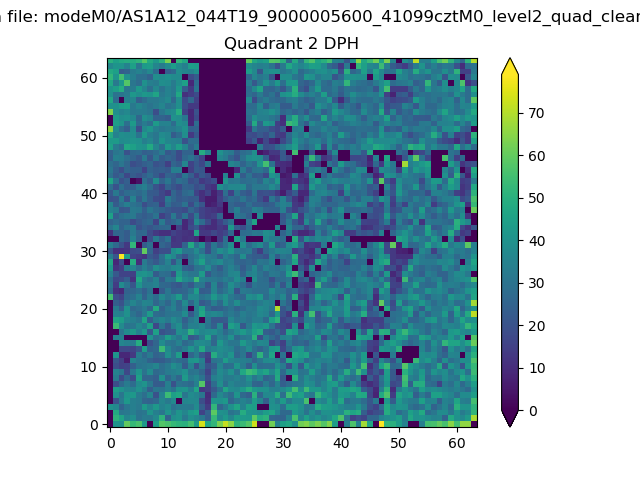 |
Quadrant C |
| Plot type | Count rate plots | Images |
|---|---|---|
| Comparison with Poisson distribution Blue bars denote a histogram of data divided into 1 sec bins. Red curve is a Poisson curve with rate = median count rate of data. |
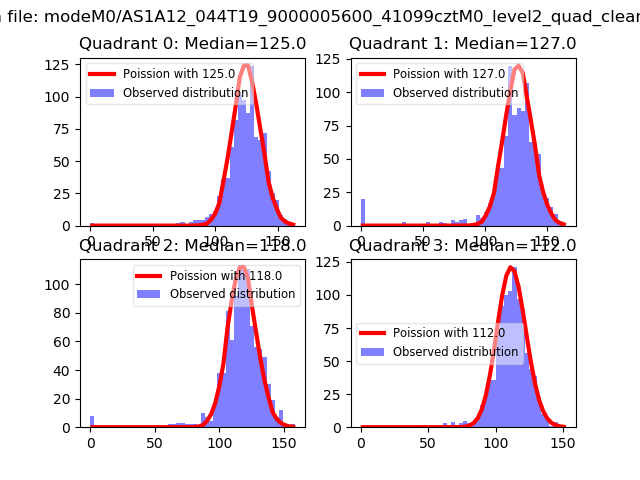 |
 |
| Quadrant-wise count rates Data is divided into 100 sec bins |
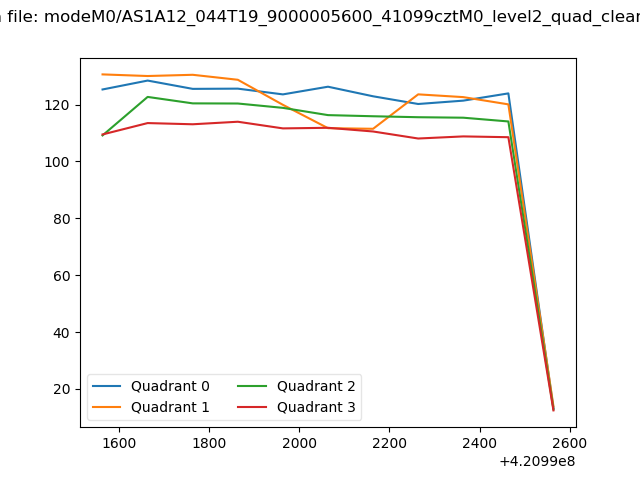 |
|
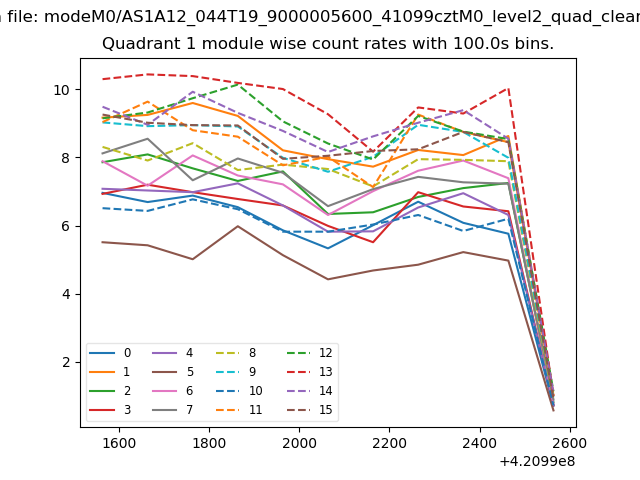
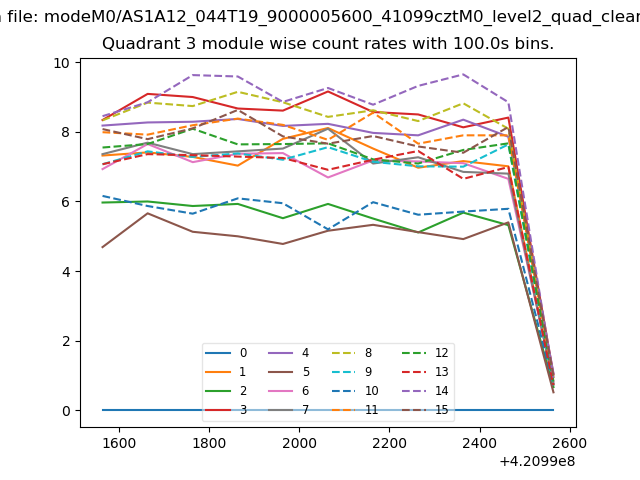
| Module-wise count rates for Quadrant A Data is divided into 100 sec bins |
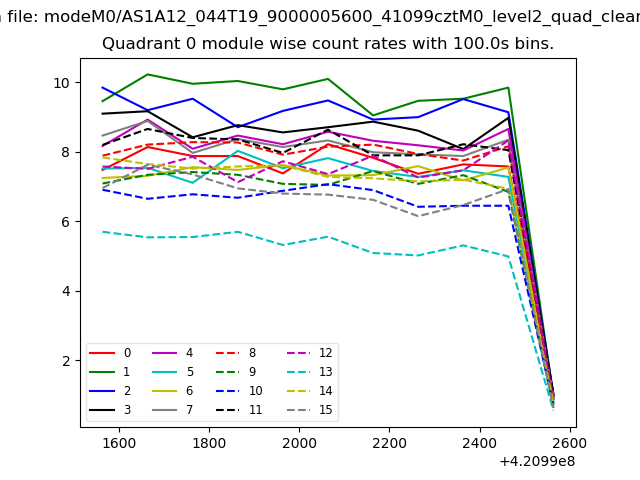 |
 |
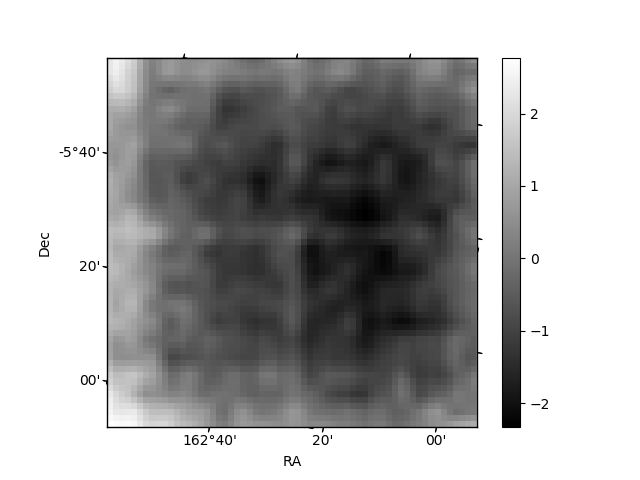
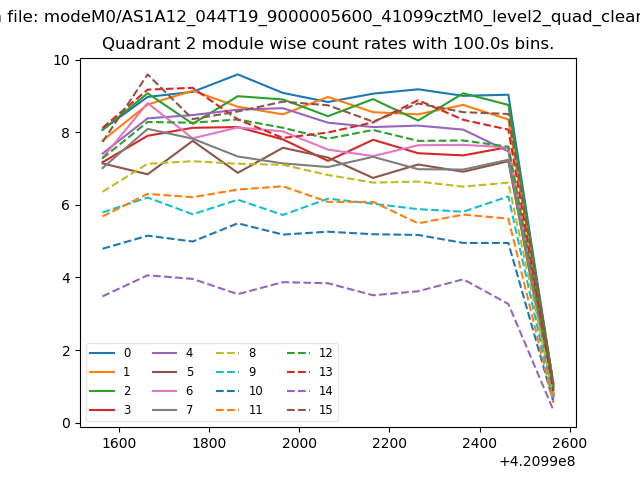
| Module-wise count rates for Quadrant B Data is divided into 100 sec bins |
 |
 |
| Module-wise count rates for Quadrant C Data is divided into 100 sec bins |
 |
 |
| Module-wise count rates for Quadrant D Data is divided into 100 sec bins |
 |
 |
| Parameter | Plot |
|---|---|
| CZT HV Monitor | 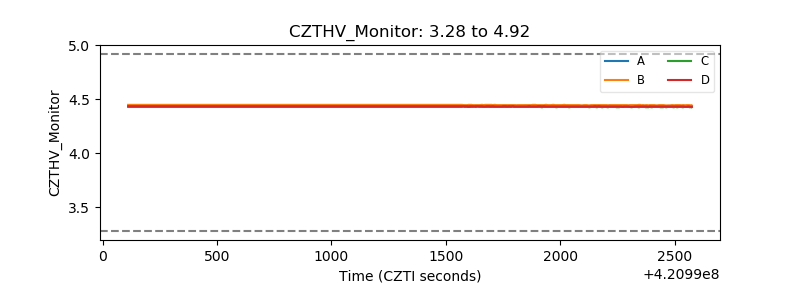 |
| D_VDD | 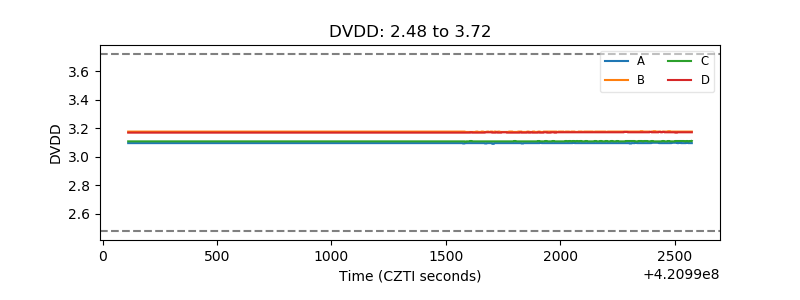 |
| Temperature 1 | 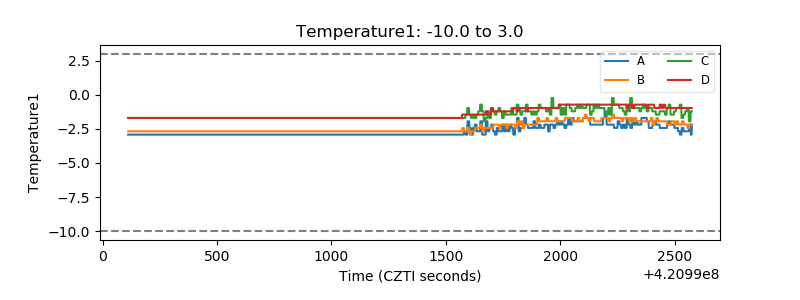 |
| Veto HV Monitor | 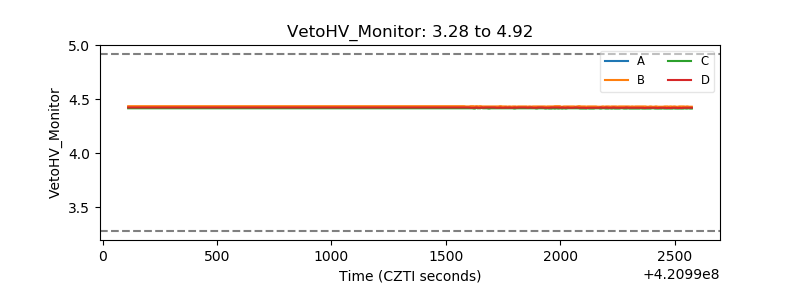 |
| Veto LLD | 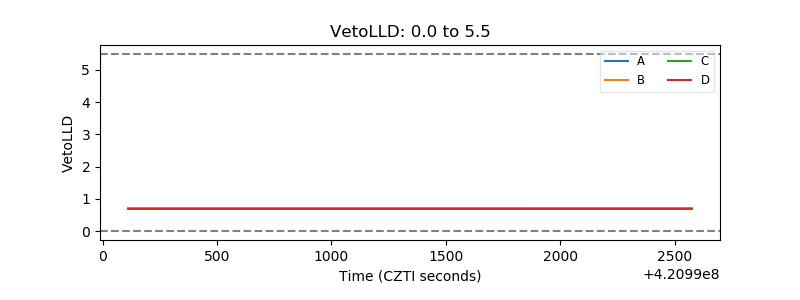 |
| Alpha Counter | 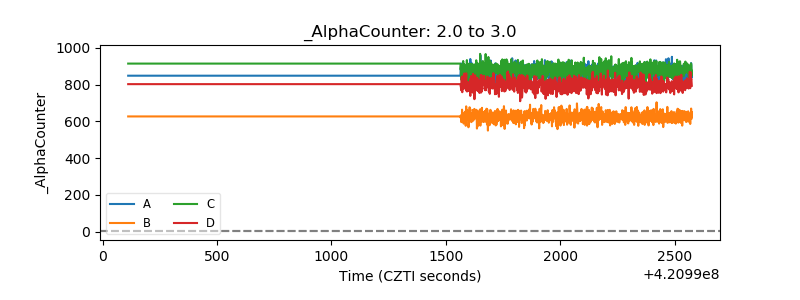 |
| _CPM_Rate | 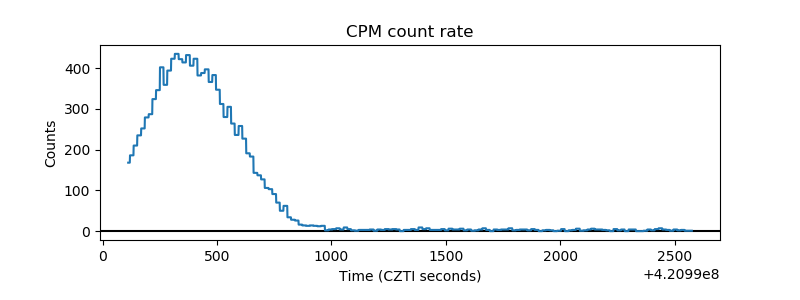 |
| CZT Counter | 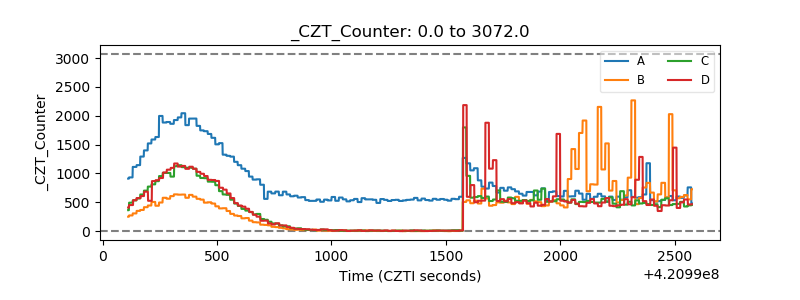 |
| +2.5 Volts monitor | 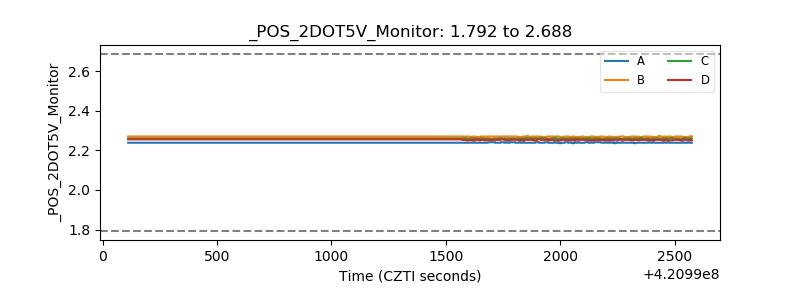 |
| +5 Volts monitor |  |
| _ROLL_ROT | 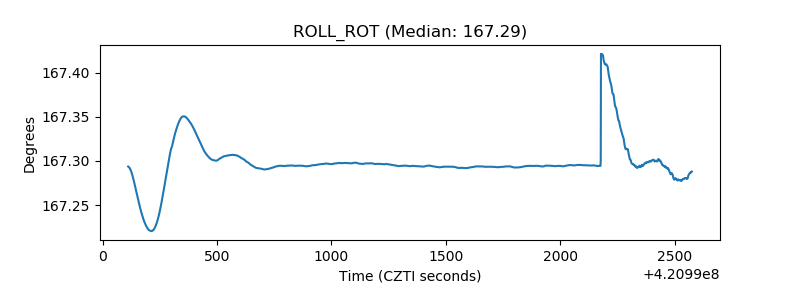 |
| _Roll_DEC | 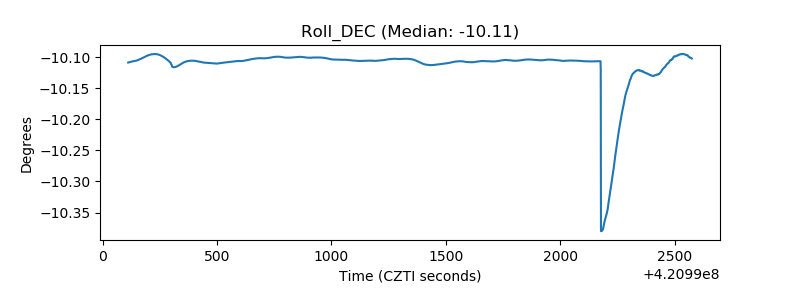 |
| _Roll_RA | 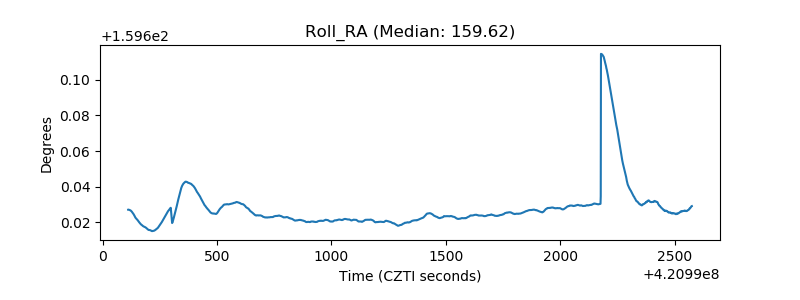 |
| Veto Counter | 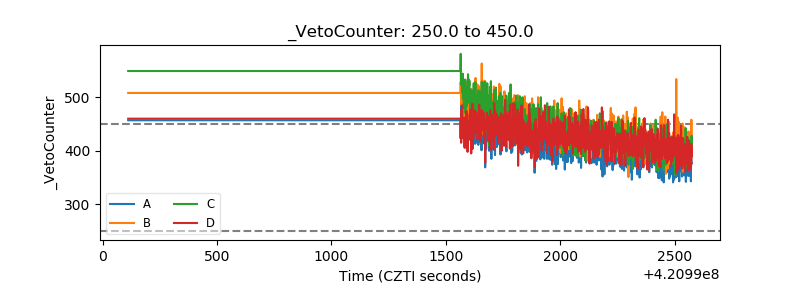 |