| Param | Original file | Final file |
|---|---|---|
| Filename | modeM0/AS1A12_044T19_9000005600_41100cztM0_level2.fits | modeM0/AS1A12_044T19_9000005600_41100cztM0_level2_quad_clean.evt |
| Size (bytes) | 344,977,920 | 89,792,640 |
| Size | 329.0 MB | 85.6 MB |
| Events in quadrant A | 3,038,367 | 620,216 |
| Events in quadrant B | 3,864,507 | 592,272 |
| Events in quadrant C | 2,755,904 | 585,067 |
| Events in quadrant D | 2,701,378 | 553,386 |
| Mode SS | |||
|---|---|---|---|
| Quadrant | BADHDUFLAG | Total packets | Discarded packets |
| A | 0 | 106 | 0 |
| B | 0 | 106 | 0 |
| C | 0 | 106 | 0 |
| D | 0 | 106 | 0 |
| Mode M0 | |||
|---|---|---|---|
| Quadrant | BADHDUFLAG | Total packets | Discarded packets |
| A | 0 | 12250 | 3 |
| B | 0 | 15064 | 2 |
| C | 0 | 11536 | 2 |
| D | 0 | 11623 | 2 |
| Mode M9 | |||
|---|---|---|---|
| Quadrant | BADHDUFLAG | Total packets | Discarded packets |
| A | 0 | 22 | 0 |
| B | 0 | 22 | 0 |
| C | 0 | 22 | 0 |
| D | 0 | 23 | 0 |
| Quadrant | Total seconds | Saturated seconds | Saturation percentage |
|---|---|---|---|
| A | 5261 | 47 | 0.893366% |
| B | 5261 | 400 | 7.603117% |
| C | 5261 | 67 | 1.273522% |
| D | 5261 | 48 | 0.912374% |
Noise dominated data is calculated using 1-second bins in cleaned event files. If a bin has >2000 counts, and if more than 50% of those come from <1% of pixels, then it is considered to be noise-dominated and hence unusable.
| Quadrant | # 1 sec bins | Bins with >0 counts | Bins with >2000 counts | High rate bins dominated by noise | Noise dominated (total time) | Noise dominated (detector-on time) | Marked lightcurve |
|---|---|---|---|---|---|---|---|
| A | 7323 | 5262 | 35 | 35 | 0.48% | 0.67% | 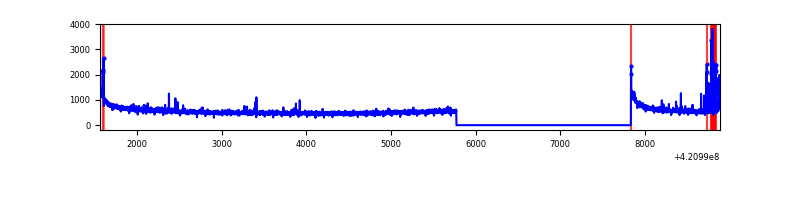 |
| B | 7323 | 5262 | 341 | 341 | 4.66% | 6.48% | 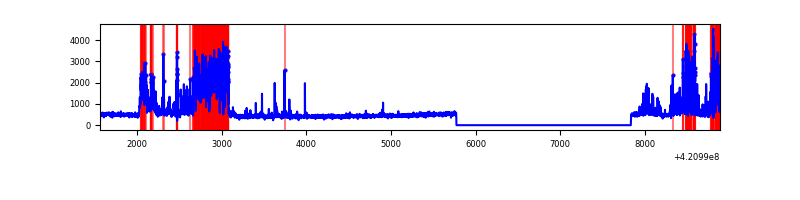 |
| C | 7323 | 5262 | 57 | 57 | 0.78% | 1.08% | 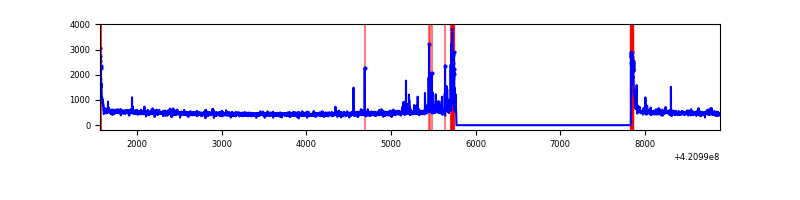 |
| D | 7323 | 5262 | 41 | 41 | 0.56% | 0.78% | 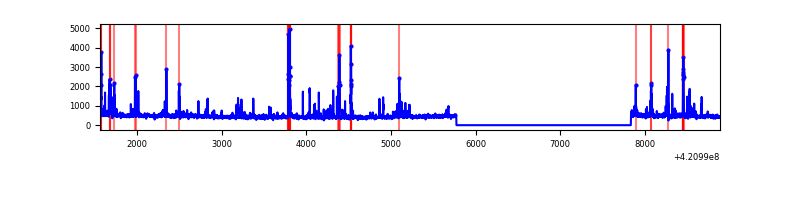 |
Top three noisy pixels from each quadrant. If the there are fewer than three noisy pixels in the level2.evt file, extra rows are filled as -1
| Pixel properties | Quadrant properties | ||||||
|---|---|---|---|---|---|---|---|
| Quadrant | DetID | PixID | Counts | Sigma | Mean | Median | Sigma |
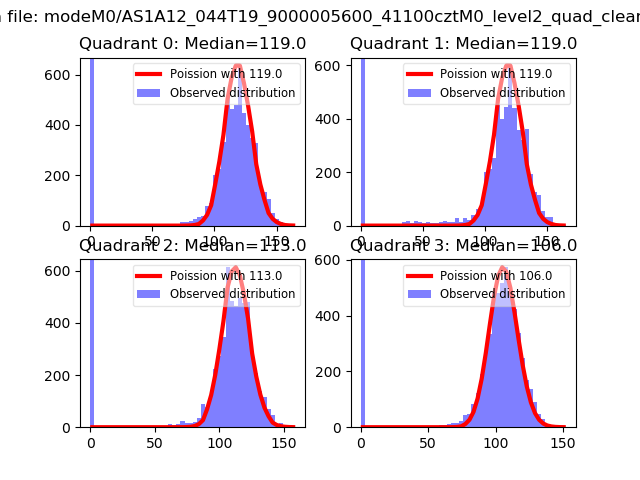
| A | 10 | 83 | 540033 | 4352.24 | 600 | 587 | 123.9 |
| A | 13 | 248 | 124197 | 997.28 | 600 | 587 | 123.9 |
| A | 2 | 79 | 38849 | 308.7 | 600 | 587 | 123.9 |
| B | 0 | 186 | 1447937 | 12837.65 | 581 | 566 | 112.7 |
| B | 5 | 255 | 104321 | 920.27 | 581 | 566 | 112.7 |
| B | 15 | 85 | 17803 | 152.89 | 581 | 566 | 112.7 |
| C | 15 | 214 | 225053 | 1666.72 | 572 | 576 | 134.7 |
| C | 12 | 249 | 147822 | 1093.29 | 572 | 576 | 134.7 |
| C | 0 | 10 | 126599 | 935.71 | 572 | 576 | 134.7 |
| D | 13 | 249 | 140023 | 965.0 | 581 | 565 | 144.5 |
| D | 2 | 249 | 94872 | 652.57 | 581 | 565 | 144.5 |
| D | 1 | 52 | 65385 | 448.53 | 581 | 565 | 144.5 |
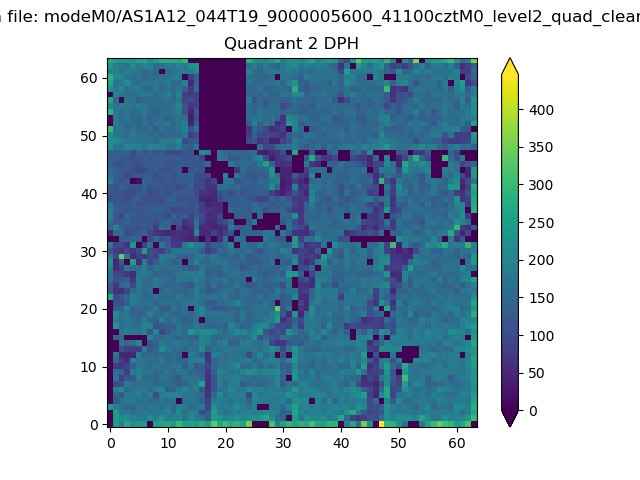
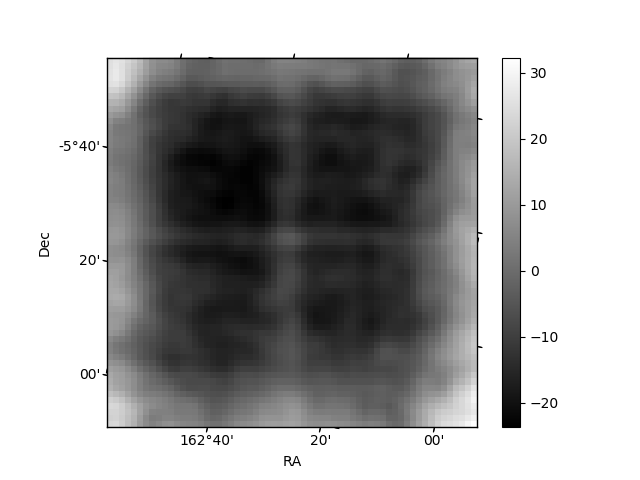
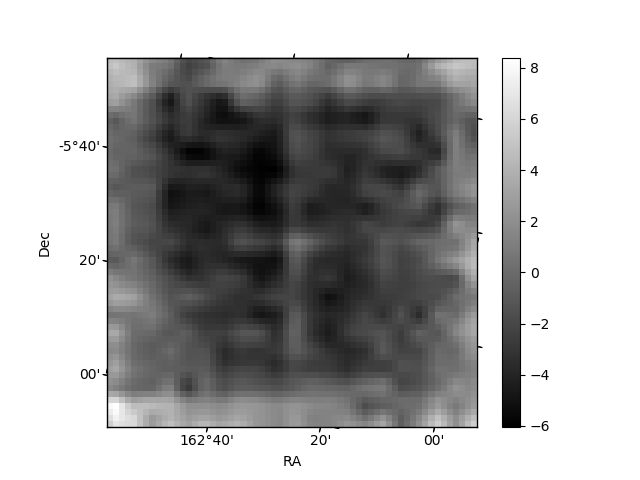
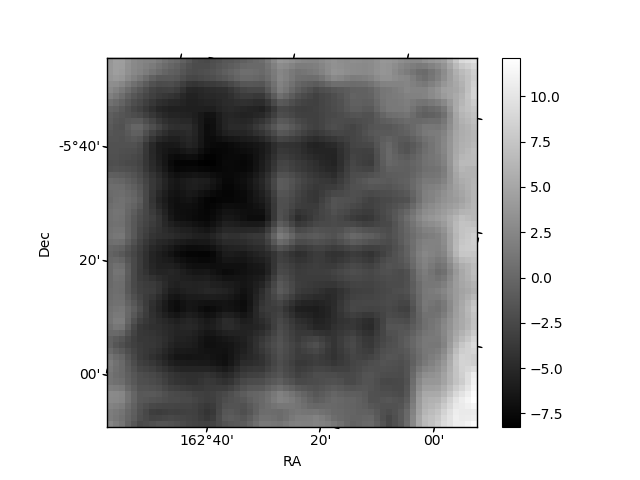
Histogram calculated using DETX and DETY for each event in the final _common_clean file
| Quadrant A | 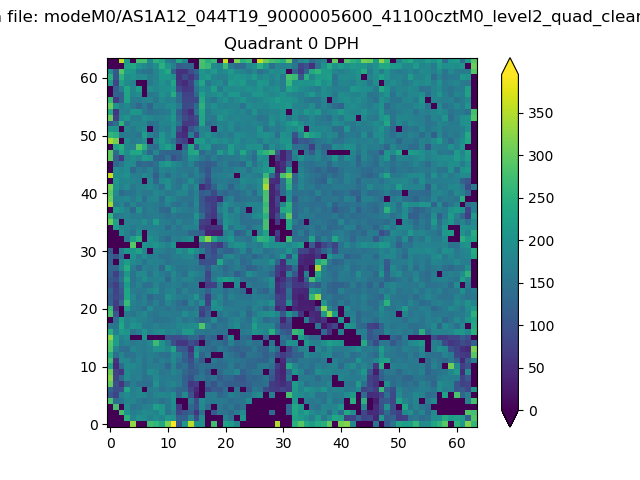 |
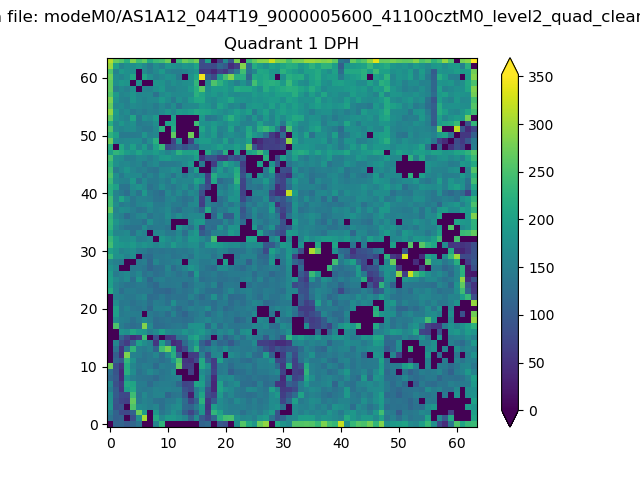 |
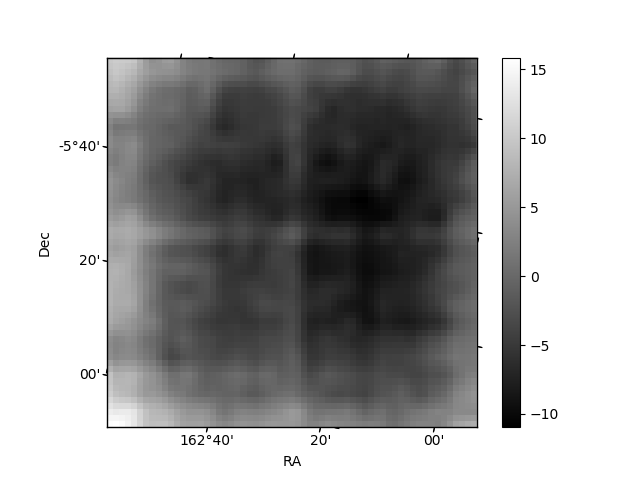
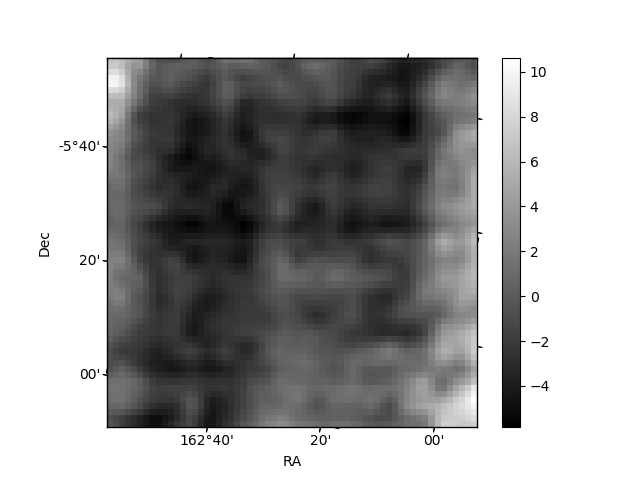
Quadrant B |
|---|---|---|---|
| Quadrant D | 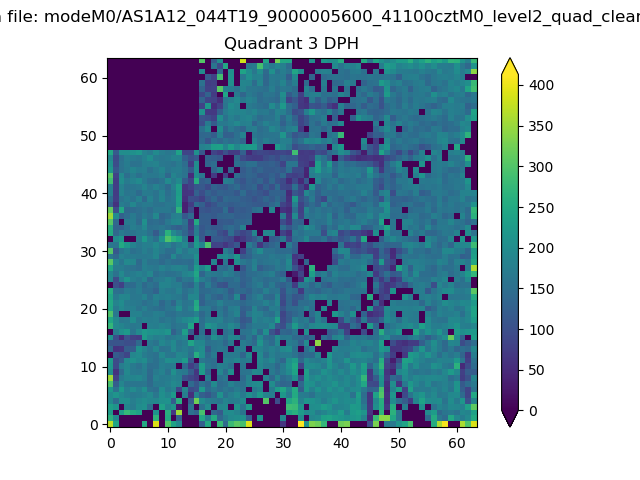 |
 |
Quadrant C |
| Plot type | Count rate plots | Images |
|---|---|---|
| Comparison with Poisson distribution Blue bars denote a histogram of data divided into 1 sec bins. Red curve is a Poisson curve with rate = median count rate of data. |
 |
 |
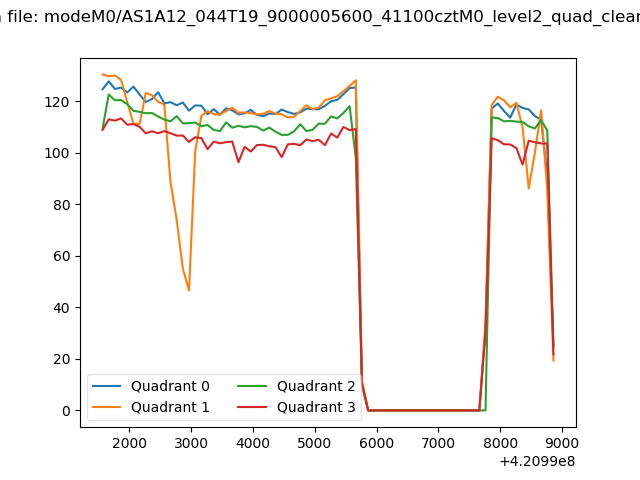
| Quadrant-wise count rates Data is divided into 100 sec bins |
 |
|
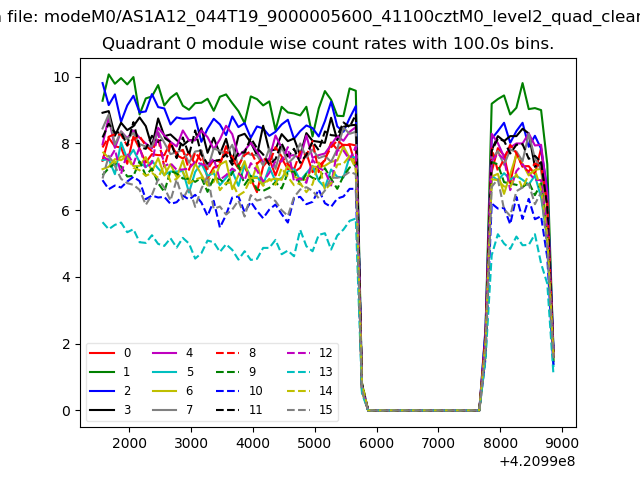
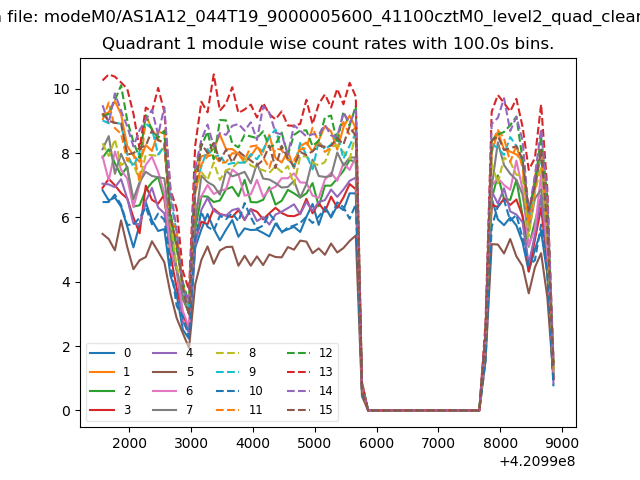
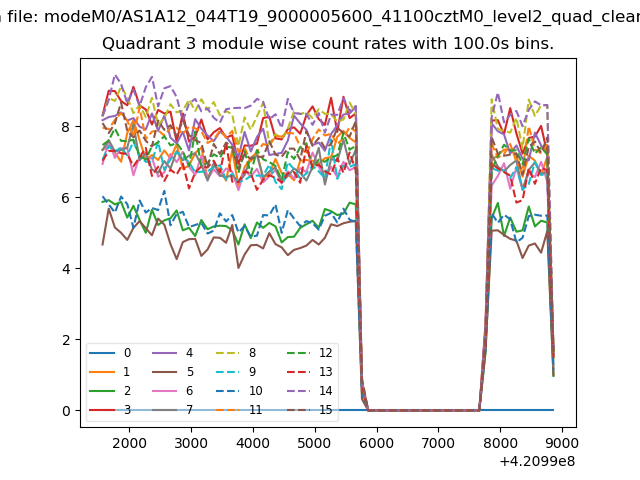
| Module-wise count rates for Quadrant A Data is divided into 100 sec bins |
 |
 |
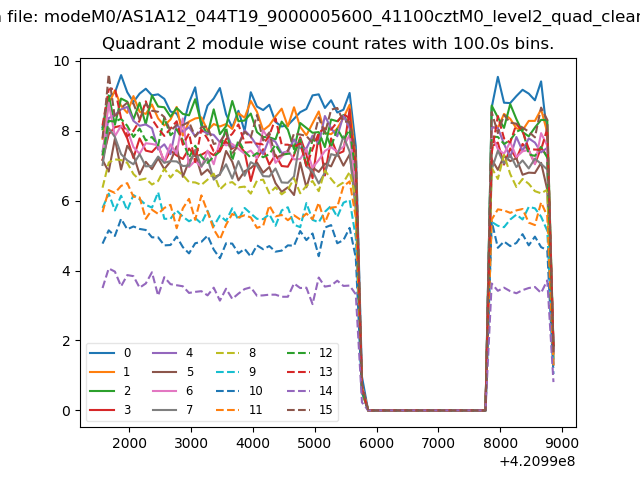
| Module-wise count rates for Quadrant B Data is divided into 100 sec bins |
 |
 |
| Module-wise count rates for Quadrant C Data is divided into 100 sec bins |
 |
 |
| Module-wise count rates for Quadrant D Data is divided into 100 sec bins |
 |
 |
| Parameter | Plot |
|---|---|
| CZT HV Monitor | 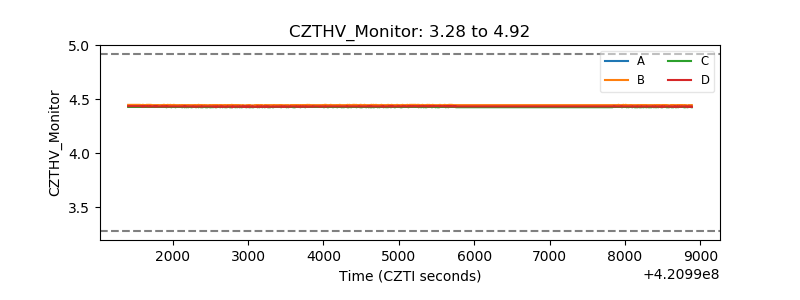 |
| D_VDD | 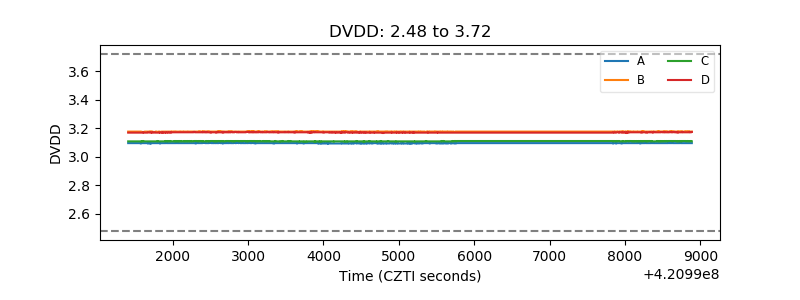 |
| Temperature 1 | 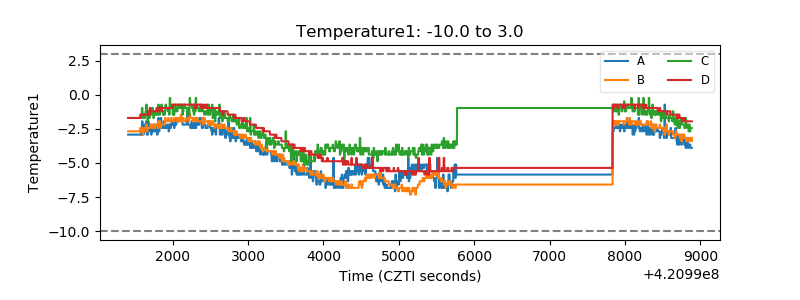 |
| Veto HV Monitor | 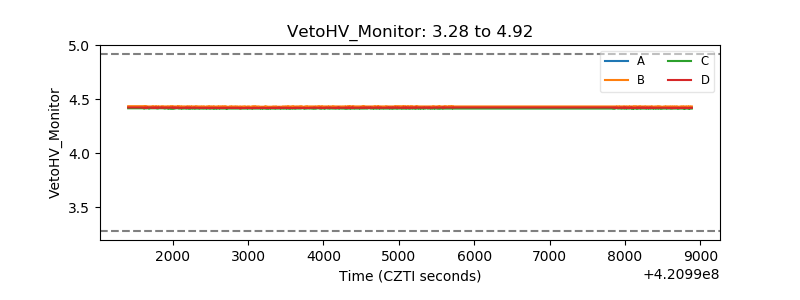 |
| Veto LLD | 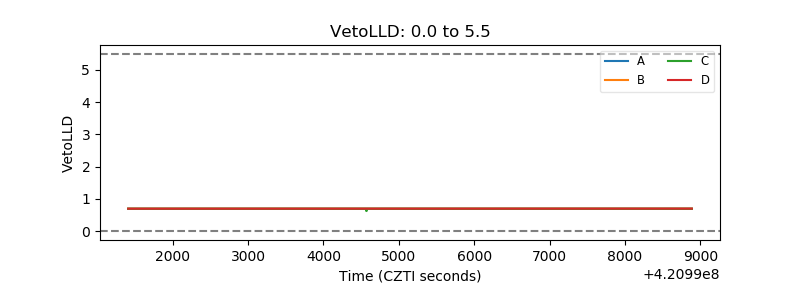 |
| Alpha Counter | 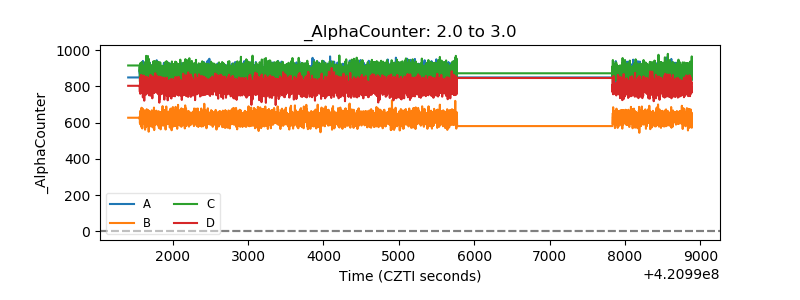 |
| _CPM_Rate | 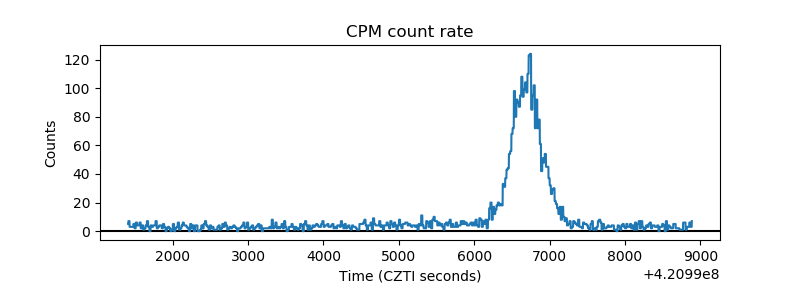 |
| CZT Counter | 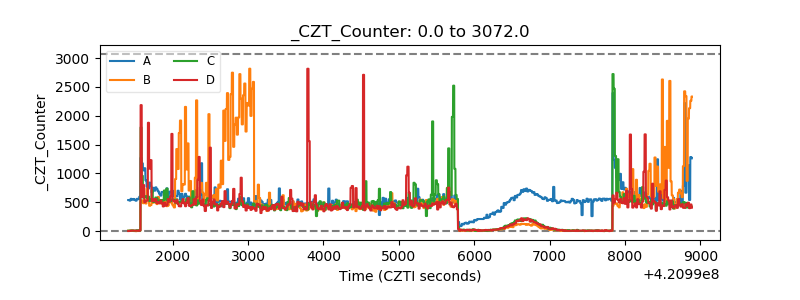 |
| +2.5 Volts monitor | 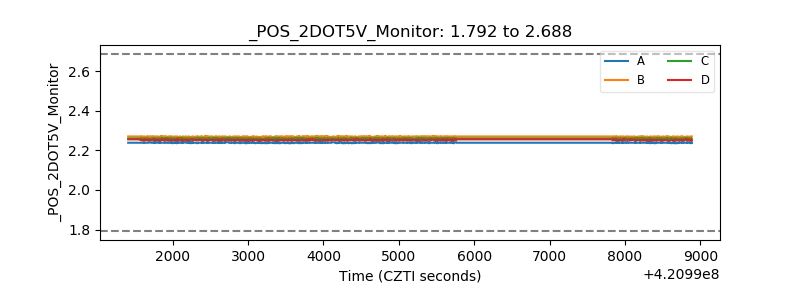 |
| +5 Volts monitor | 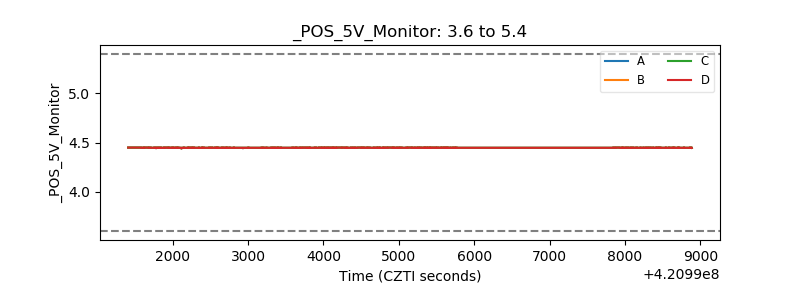 |
| _ROLL_ROT | 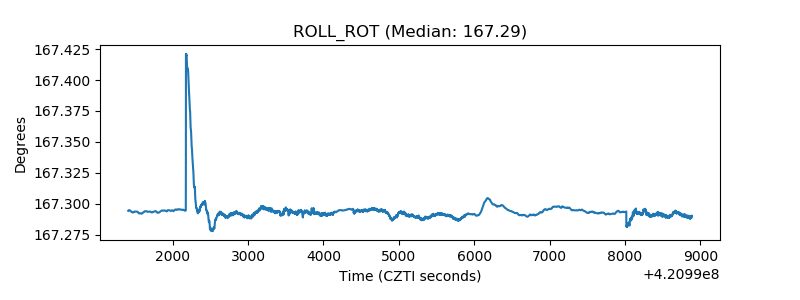 |
| _Roll_DEC | 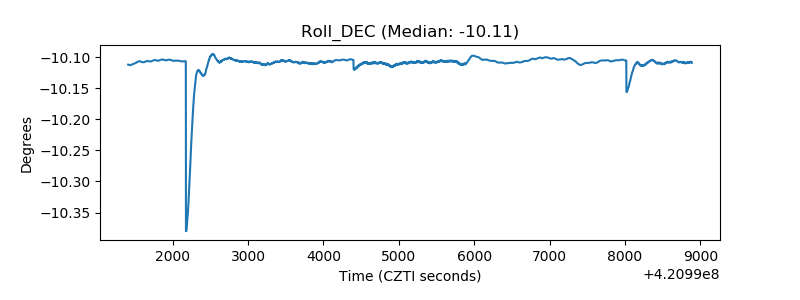 |
| _Roll_RA | 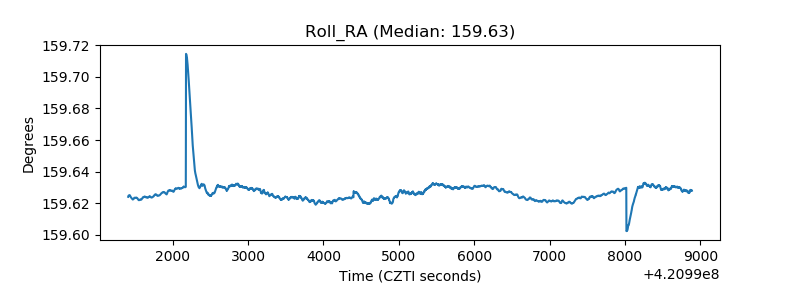 |
| Veto Counter | 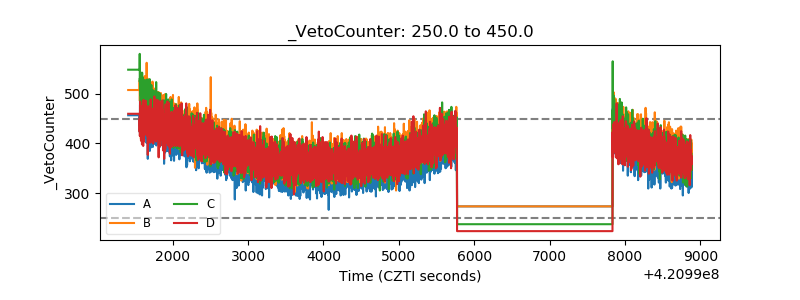 |