| Param | Original file | Final file |
|---|---|---|
| Filename | modeM0/AS1A12_044T19_9000005600_41101cztM0_level2.fits | modeM0/AS1A12_044T19_9000005600_41101cztM0_level2_quad_clean.evt |
| Size (bytes) | 355,112,640 | 88,879,680 |
| Size | 338.7 MB | 84.8 MB |
| Events in quadrant A | 3,371,404 | 601,141 |
| Events in quadrant B | 3,161,326 | 606,754 |
| Events in quadrant C | 2,729,117 | 577,625 |
| Events in quadrant D | 3,465,530 | 529,945 |
| Mode SS | |||
|---|---|---|---|
| Quadrant | BADHDUFLAG | Total packets | Discarded packets |
| A | 0 | 110 | 0 |
| B | 0 | 110 | 0 |
| C | 0 | 110 | 0 |
| D | 0 | 110 | 0 |
| Mode M0 | |||
|---|---|---|---|
| Quadrant | BADHDUFLAG | Total packets | Discarded packets |
| A | 0 | 13358 | 3 |
| B | 0 | 13127 | 2 |
| C | 0 | 11466 | 2 |
| D | 0 | 14065 | 2 |
| Mode M9 | |||
|---|---|---|---|
| Quadrant | BADHDUFLAG | Total packets | Discarded packets |
| A | 0 | 19 | 0 |
| B | 0 | 19 | 0 |
| C | 0 | 19 | 0 |
| D | 0 | 20 | 0 |
| Quadrant | Total seconds | Saturated seconds | Saturation percentage |
|---|---|---|---|
| A | 5365 | 121 | 2.255359% |
| B | 5365 | 157 | 2.926375% |
| C | 5365 | 46 | 0.857409% |
| D | 5365 | 231 | 4.305685% |
Noise dominated data is calculated using 1-second bins in cleaned event files. If a bin has >2000 counts, and if more than 50% of those come from <1% of pixels, then it is considered to be noise-dominated and hence unusable.
| Quadrant | # 1 sec bins | Bins with >0 counts | Bins with >2000 counts | High rate bins dominated by noise | Noise dominated (total time) | Noise dominated (detector-on time) | Marked lightcurve |
|---|---|---|---|---|---|---|---|
| A | 7158 | 5366 | 107 | 107 | 1.49% | 1.99% | 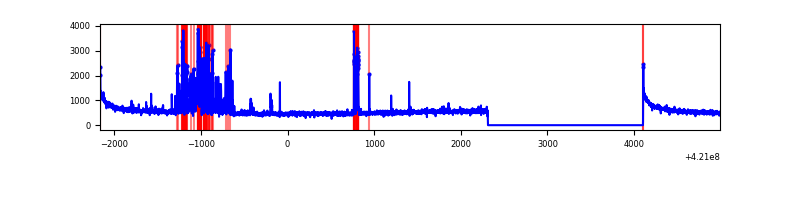 |
| B | 7158 | 5366 | 112 | 112 | 1.56% | 2.09% |  |
| C | 7158 | 5366 | 39 | 39 | 0.54% | 0.73% | 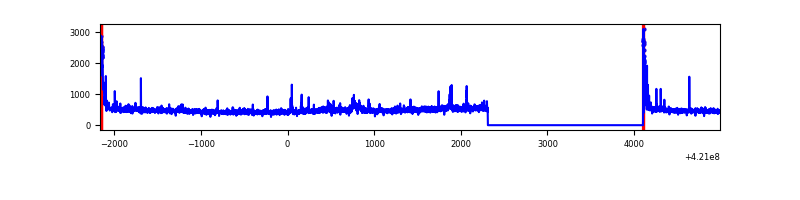 |
| D | 7158 | 5366 | 210 | 210 | 2.93% | 3.91% | 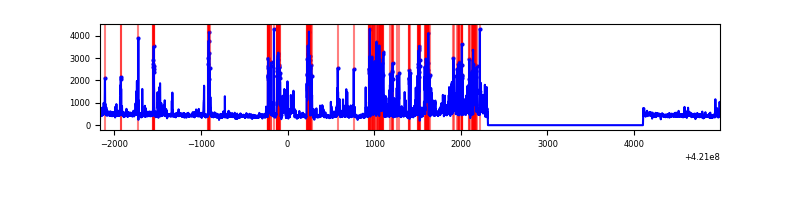 |
Top three noisy pixels from each quadrant. If the there are fewer than three noisy pixels in the level2.evt file, extra rows are filled as -1
| Pixel properties | Quadrant properties | ||||||
|---|---|---|---|---|---|---|---|
| Quadrant | DetID | PixID | Counts | Sigma | Mean | Median | Sigma |
| A | 10 | 83 | 533515 | 4334.6 | 596 | 584 | 122.9 |
| A | 13 | 248 | 406032 | 3297.71 | 596 | 584 | 122.9 |
| A | 0 | 230 | 70215 | 566.34 | 596 | 584 | 122.9 |
| B | 0 | 186 | 741995 | 6482.33 | 588 | 570 | 114.4 |
| B | 5 | 255 | 63808 | 552.89 | 588 | 570 | 114.4 |
| B | 0 | 190 | 27096 | 231.92 | 588 | 570 | 114.4 |
| C | 15 | 214 | 229540 | 1697.0 | 576 | 580 | 134.9 |
| C | 0 | 10 | 133571 | 985.7 | 576 | 580 | 134.9 |
| C | 14 | 254 | 96445 | 710.53 | 576 | 580 | 134.9 |
| D | 2 | 249 | 648729 | 4556.27 | 572 | 555 | 142.3 |
| D | 12 | 79 | 348955 | 2449.04 | 572 | 555 | 142.3 |
| D | 10 | 34 | 98357 | 687.49 | 572 | 555 | 142.3 |
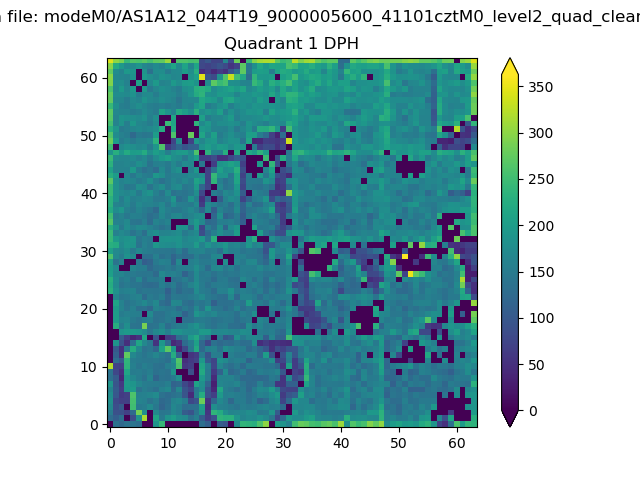
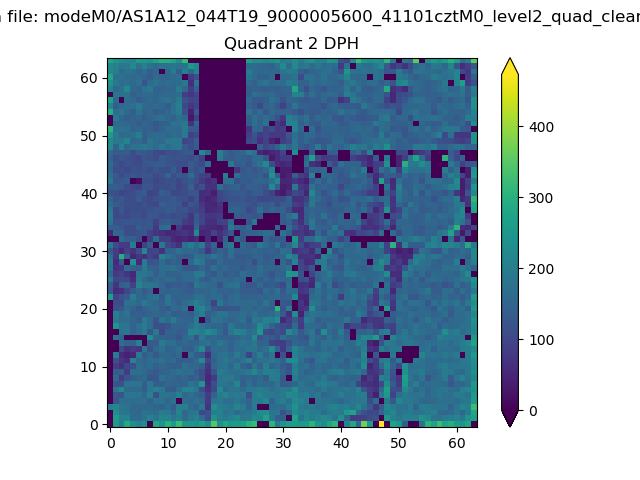
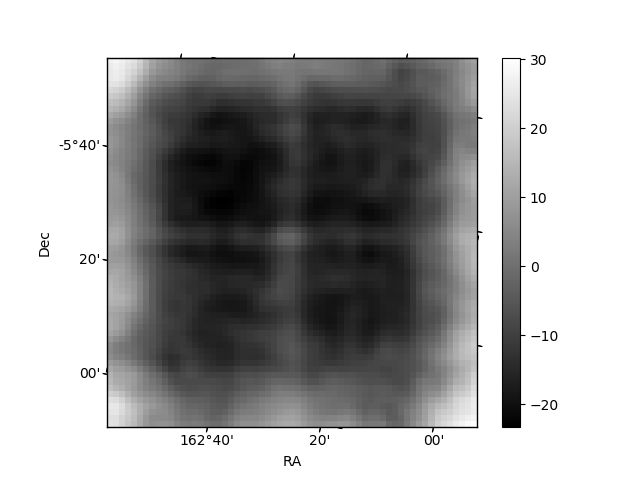
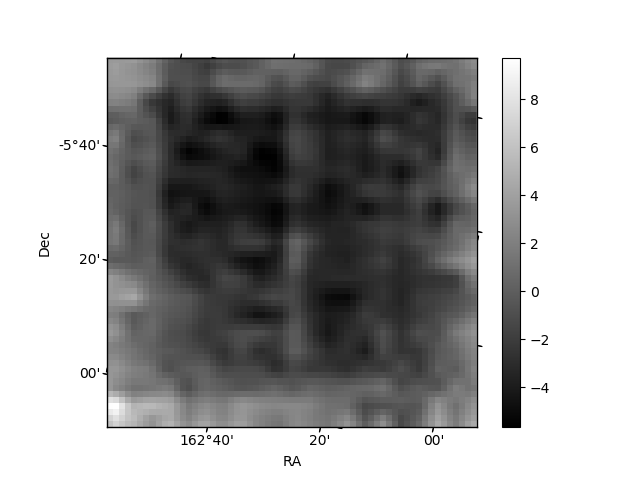
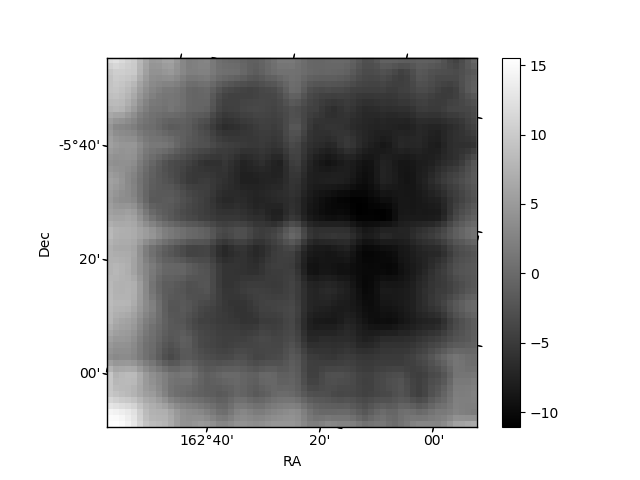
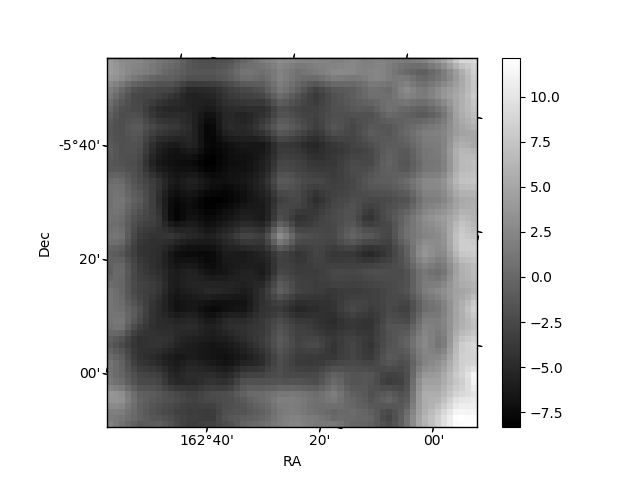
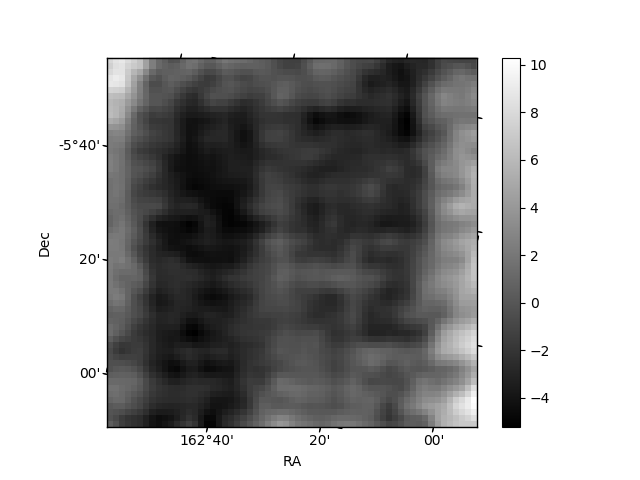
Histogram calculated using DETX and DETY for each event in the final _common_clean file
| Quadrant A | 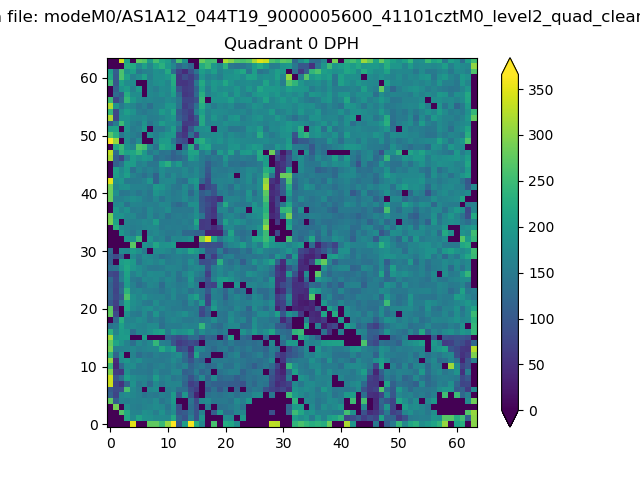 |
 |
Quadrant B |
|---|---|---|---|
| Quadrant D | 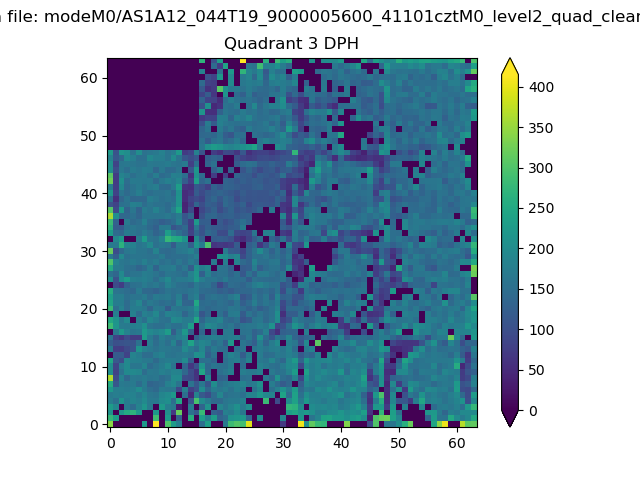 |
 |
Quadrant C |
| Plot type | Count rate plots | Images |
|---|---|---|
| Comparison with Poisson distribution Blue bars denote a histogram of data divided into 1 sec bins. Red curve is a Poisson curve with rate = median count rate of data. |
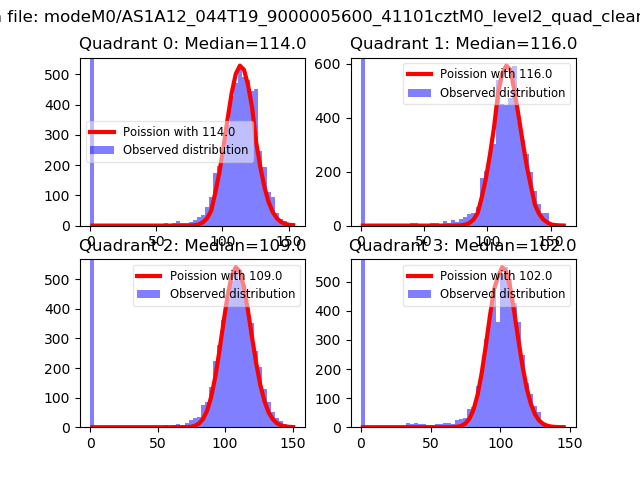 |
 |
| Quadrant-wise count rates Data is divided into 100 sec bins |
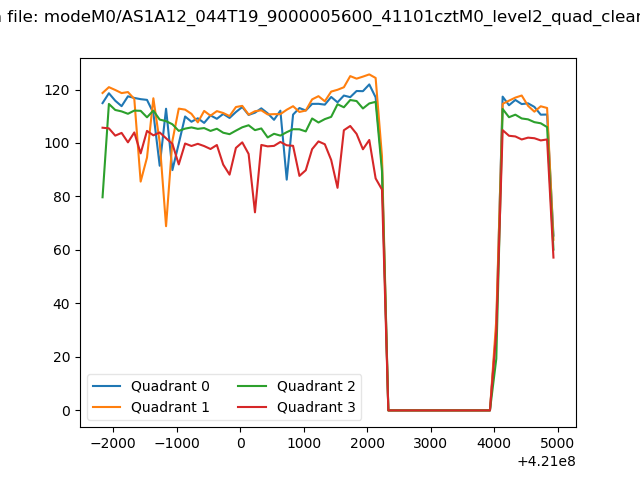 |
|
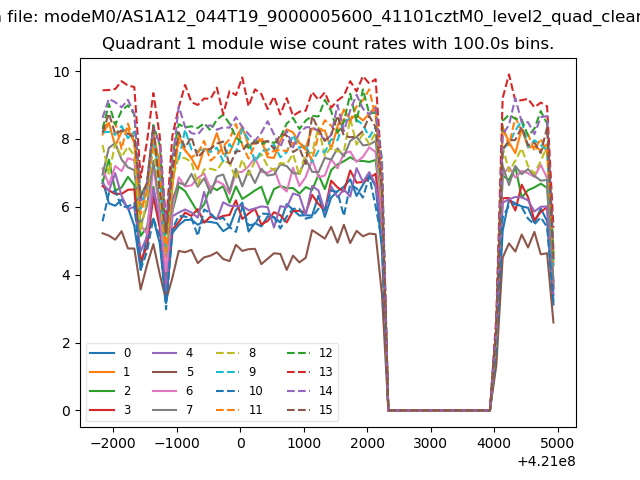
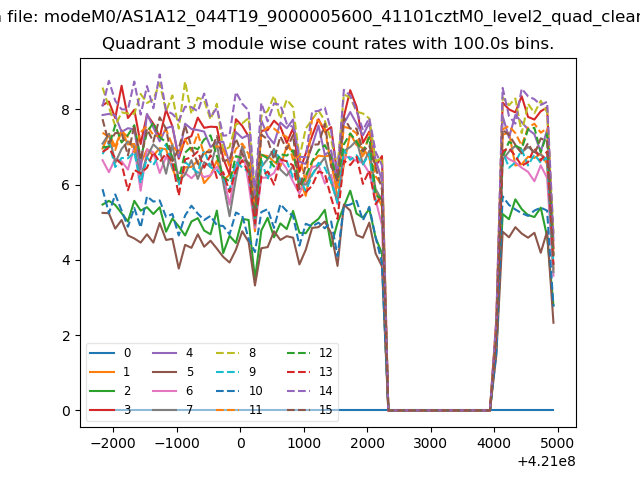
| Module-wise count rates for Quadrant A Data is divided into 100 sec bins |
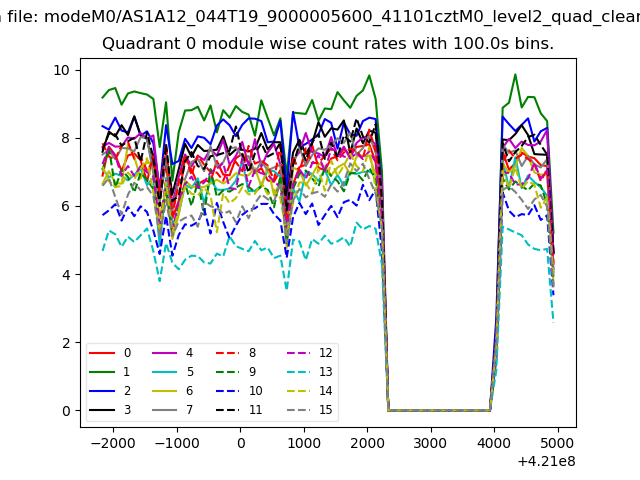 |
 |
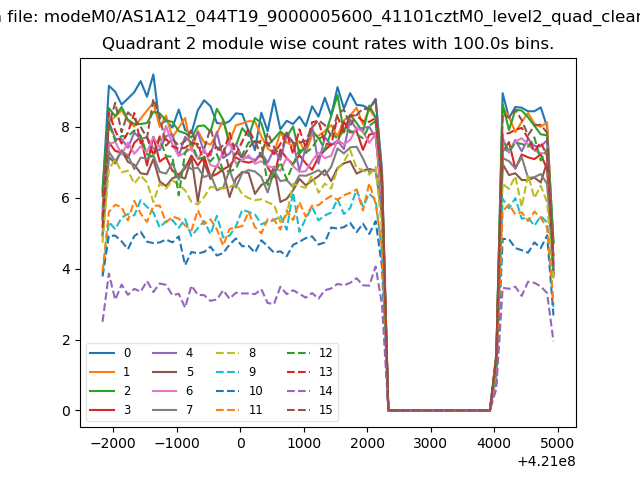
| Module-wise count rates for Quadrant B Data is divided into 100 sec bins |
 |
 |
| Module-wise count rates for Quadrant C Data is divided into 100 sec bins |
 |
 |
| Module-wise count rates for Quadrant D Data is divided into 100 sec bins |
 |
 |
| Parameter | Plot |
|---|---|
| CZT HV Monitor |  |
| D_VDD | 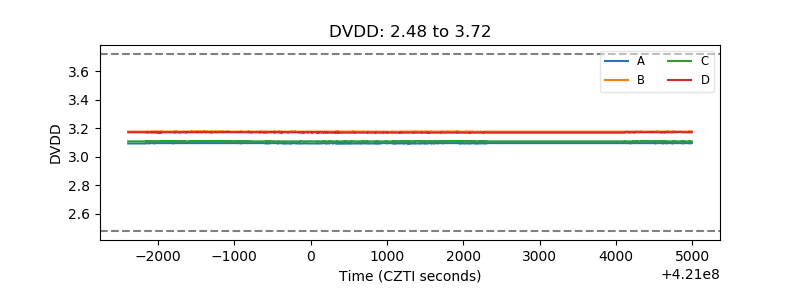 |
| Temperature 1 | 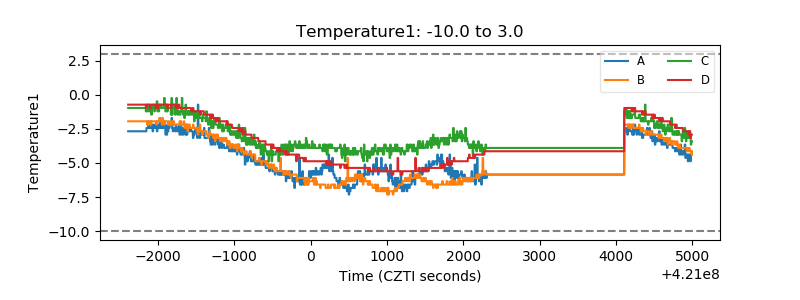 |
| Veto HV Monitor | 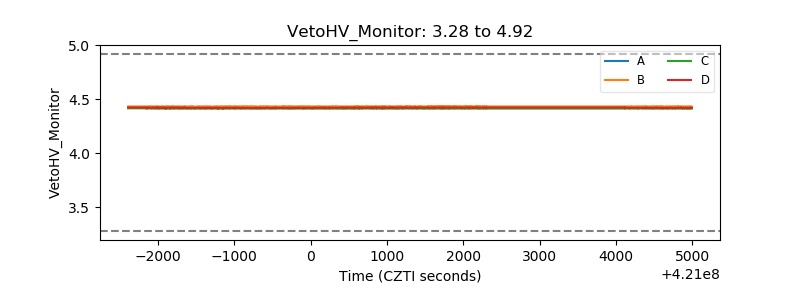 |
| Veto LLD | 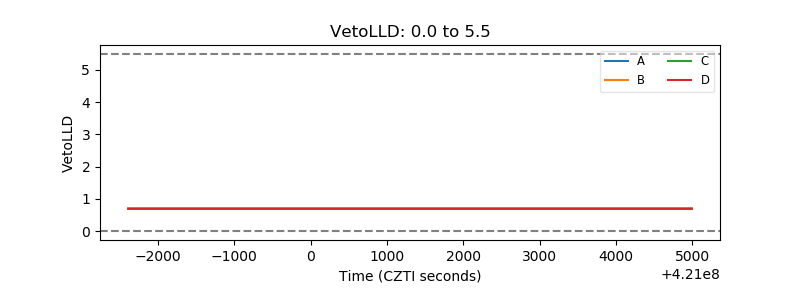 |
| Alpha Counter | 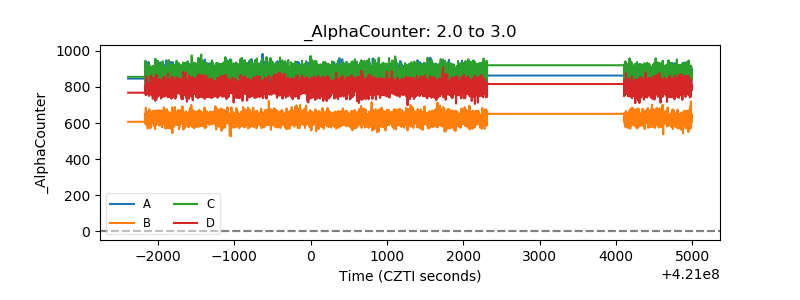 |
| _CPM_Rate | 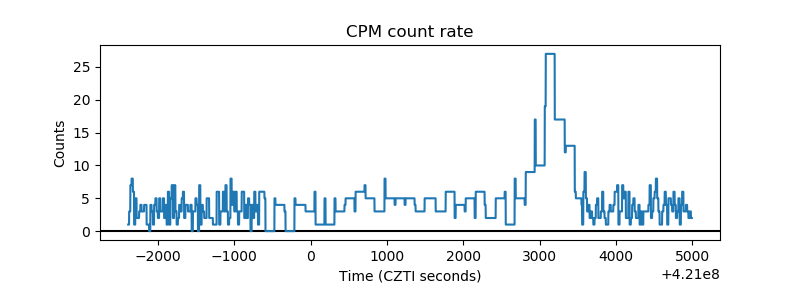 |
| CZT Counter | 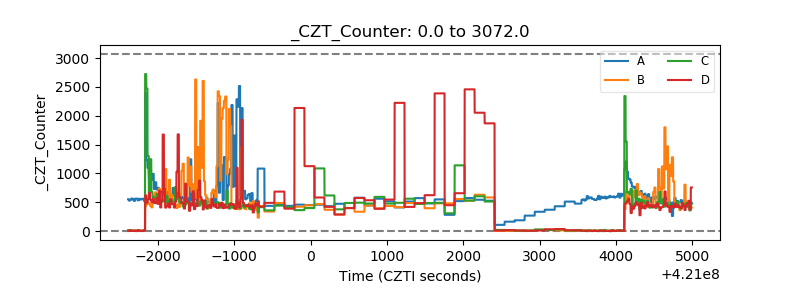 |
| +2.5 Volts monitor |  |
| +5 Volts monitor | 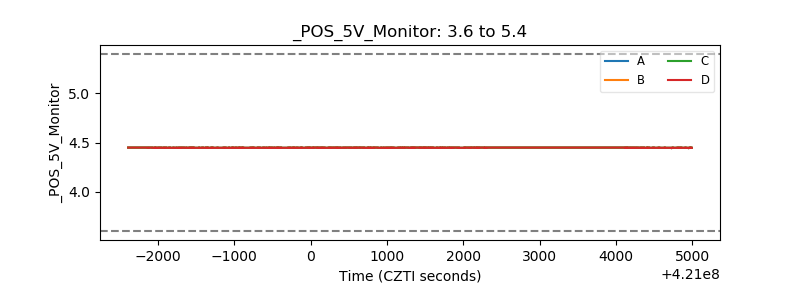 |
| _ROLL_ROT | 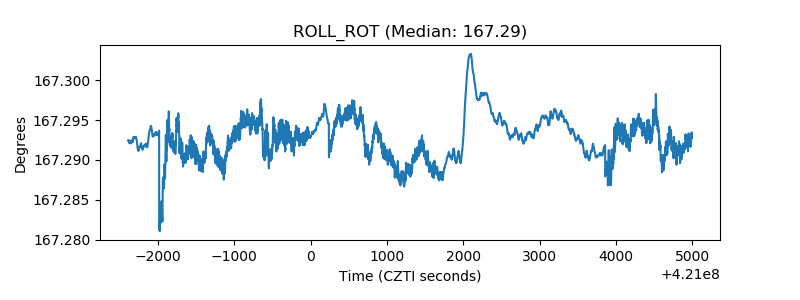 |
| _Roll_DEC | 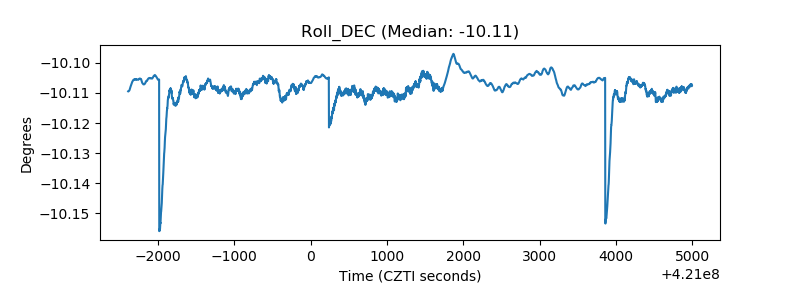 |
| _Roll_RA | 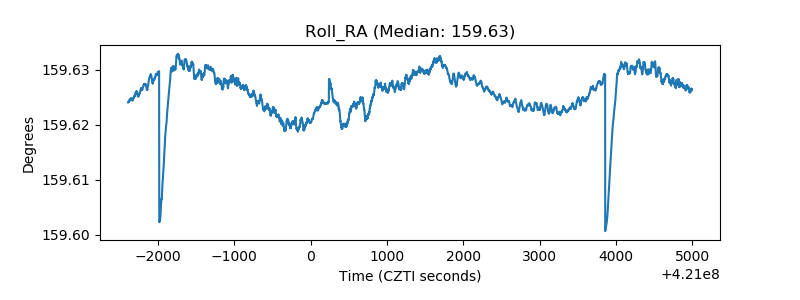 |
| Veto Counter | 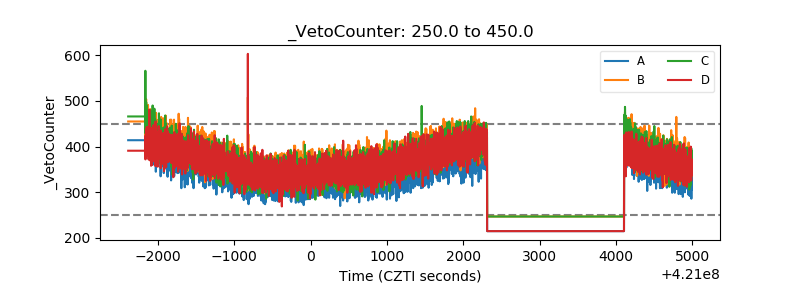 |